Andrésy Airbnb Market Analysis 2025: Short Term Rental Data & Vacation Rental Statistics in Ile-de-France, France
Is Airbnb profitable in Andrésy in 2025? Explore comprehensive Airbnb analytics for Andrésy, Ile-de-France, France to uncover income potential. This 2025 STR market report for Andrésy, based on AirROI data from April 2024 to March 2025, reveals key trends in the niche market of 33 active listings.
Whether you're considering an Airbnb investment in Andrésy, optimizing your existing vacation rental, or exploring rental arbitrage opportunities, understanding the Andrésy Airbnb data is crucial. Leveraging the low regulation environment is key to maximizing your short term rental income potential. Let's dive into the specifics.
Key Andrésy Airbnb Performance Metrics Overview
Monthly Airbnb Revenue Variations & Income Potential in Andrésy (2025)
Understanding the monthly revenue variations for Airbnb listings in Andrésy is key to maximizing your short term rental income potential. Seasonality significantly impacts earnings. Our analysis, based on data from the past 12 months, shows that the peak revenue month for STRs in Andrésy is typically July, while March often presents the lowest earnings, highlighting opportunities for strategic pricing adjustments during shoulder and low seasons. Explore the typical Airbnb income in Andrésy across different performance tiers:
- Best-in-class properties (Top 10%) achieve $2,867+ monthly, often utilizing dynamic pricing and superior guest experiences.
- Strong performing properties (Top 25%) earn $2,006 or more, indicating effective management and desirable locations/amenities.
- Typical properties (Median) generate around $1,257 per month, representing the average market performance.
- Entry-level properties (Bottom 25%) see earnings around $719, often with potential for optimization.
Average Monthly Airbnb Earnings Trend in Andrésy
Andrésy Airbnb Occupancy Rate Trends (2025)
Maximize your bookings by understanding the Andrésy STR occupancy trends. Seasonal demand shifts significantly influence how often properties are booked. Typically, Novembersees the highest demand (peak season occupancy), while March experiences the lowest (low season). Effective strategies, like adjusting minimum stays or offering promotions, can boost occupancy during slower periods. Here's how different property tiers perform in Andrésy:
- Best-in-class properties (Top 10%) achieve 80%+ occupancy, indicating high desirability and potentially optimized availability.
- Strong performing properties (Top 25%) maintain 58% or higher occupancy, suggesting good market fit and guest satisfaction.
- Typical properties (Median) have an occupancy rate around 33%.
- Entry-level properties (Bottom 25%) average 20% occupancy, potentially facing higher vacancy.
Average Monthly Occupancy Rate Trend in Andrésy
Average Daily Rate (ADR) Airbnb Trends in Andrésy (2025)
Effective short term rental pricing strategy in Andrésy involves understanding monthly ADR fluctuations. The Average Daily Rate (ADR) for Airbnb in Andrésy typically peaks in July and dips lowest during March. Leveraging Airbnb dynamic pricing tools or strategies based on this seasonality can significantly boost revenue. Here's a look at the typical nightly rates achieved:
- Best-in-class properties (Top 10%) command rates of $338+ per night, often due to premium features or locations.
- Strong performing properties (Top 25%) achieve nightly rates of $173 or more.
- Typical properties (Median) charge around $104 per night.
- Entry-level properties (Bottom 25%) earn around $70 per night.
Average Daily Rate (ADR) Trend by Month in Andrésy
Get Live Andrésy Market Intelligence 👇

Explore Real-time Analytics
Airbnb Seasonality Analysis & Trends in Andrésy (2025)
Peak Season (July, August, May)
- Revenue averages $2,422 per month
- Occupancy rates average 38.8%
- Daily rates average $194
Shoulder Season
- Revenue averages $1,411 per month
- Occupancy maintains around 43.7%
- Daily rates hold near $166
Low Season (January, February, March)
- Revenue drops to average $966 per month
- Occupancy decreases to average 38.9%
- Daily rates adjust to average $127
Seasonality Insights for Andrésy
- The Airbnb seasonality in Andrésy shows highly seasonal trends requiring careful strategy. While the sections above show seasonal averages, it's also insightful to look at the extremes:
- During the high season, the absolute peak month showcases Andrésy's highest earning potential, with monthly revenues capable of climbing to $2,736, occupancy reaching a high of 54.0%, and ADRs peaking at $202.
- Conversely, the slowest single month of the year, typically falling within the low season, marks the market's lowest point. In this month, revenue might dip to $864, occupancy could drop to 31.6%, and ADRs may adjust down to $125.
- Understanding both the seasonal averages and these monthly peaks and troughs in revenue, occupancy, and ADR is crucial for maximizing your Airbnb profit potential in Andrésy.
Seasonal Strategies for Maximizing Profit
- Peak Season: Maximize revenue through premium pricing and potentially longer minimum stays. Ensure high availability.
- Low Season: Offer competitive pricing, special promotions (e.g., extended stay discounts), and flexible cancellation policies. Target off-season travelers like remote workers or budget-conscious guests.
- Shoulder Seasons: Implement dynamic pricing that balances peak and low rates. Target weekend travelers or specific events. Offer slightly more flexible terms than peak season.
- Regularly analyze your own performance against these Andrésy seasonality benchmarks and adjust your pricing and availability strategy accordingly.
Best Areas for Airbnb Investment in Andrésy (2025)
Exploring the top neighborhoods for short-term rentals in Andrésy? This section highlights key areas, outlining why they are attractive for hosts and guests, along with notable local attractions. Consider these locations based on your target guest profile and investment strategy.
| Neighborhood / Area | Why Host Here? (Target Guests & Appeal) | Key Attractions & Landmarks |
|---|---|---|
| Central Andrésy | The heart of Andrésy, offering proximity to local shops, cafés, and public transport. Ideal for visitors wanting easy access to amenities and transportation to Paris. | Place de la Mairie, Église Saint-Corneille, local markets, café terraces, walking paths along the Seine |
| River Seine | Areas along the Seine River boast beautiful views and scenic walks, making it attractive for tourists looking for a peaceful retreat with nature. | Seine River banks, walking paths, picnic spots, water activities, scenic bike trails |
| Andrésy Park | A spacious park area that is great for families and outdoor activities. The park is perfect for those looking to enjoy nature and recreational activities during their stay. | Andrésy Park, children's play areas, sports facilities, picnic areas, nature trails |
| Historical District | Andrésy's historical buildings and charm attract those interested in culture and history. This area offers a more authentic French experience. | historic architecture, local museums, art exhibitions, cultural events, festivals |
| Transport Hub | Close to train stations and bus routes, this area attracts business travelers and tourists who need to commute easily to nearby cities including Paris. | Andrésy train station, bus services, taxi ranks, local eateries, nearby shopping |
| Quiet Residential Streets | Serene neighborhoods that provide a relaxing atmosphere for guests looking to escape the hustle and bustle of urban life while still being close to essential services. | local parks, family homes, community events, peaceful surroundings, grocery stores |
| Wineyards of the Yvelines | Close to wine-growing areas, visitors can enjoy wine tours and tastings, making it a unique experience in the region. | local vineyards, wine tasting tours, scenic drives, agritourism, local gastronomy |
| Proximity to Cesson | Just a short distance from Cesson, a town with cultural events and amenities, attracting visitors who wish to explore beyond Andrésy. | town centers, cultural festivals, local cuisine, art galleries, theater performances |
Understanding Airbnb License Requirements & STR Laws in Andrésy (2025)
While Andrésy, Ile-de-France, France currently shows low STR regulations, specific Airbnb license requirements might still exist or change. Always verify the latest short term rental regulations and Airbnb license requirements directly with local government authorities for Andrésy to ensure full compliance before hosting.
(Source: AirROI data, 2025, finding no licensed listings among those analyzed)
Top Performing Airbnb Properties in Andrésy (2025)
Benchmark your potential! Explore examples of top-performing Airbnb properties in Andrésybased on Trailing Twelve Month (TTM) revenue. Analyze their characteristics, revenue, occupancy rate, and ADR to understand what drives success in this market.
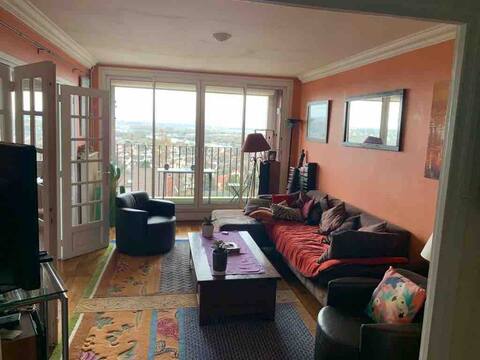
110sqm,panoramic view 30mn Paris
Entire Place • 2 bedrooms
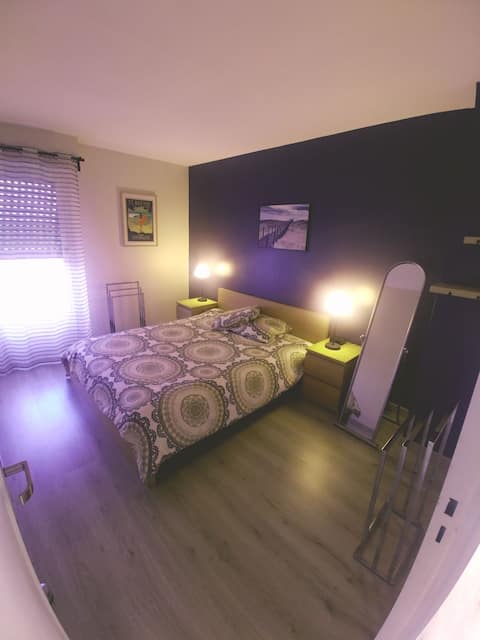
Duplex apartment 2 bedrooms sleeping 5
Entire Place • 1 bedroom
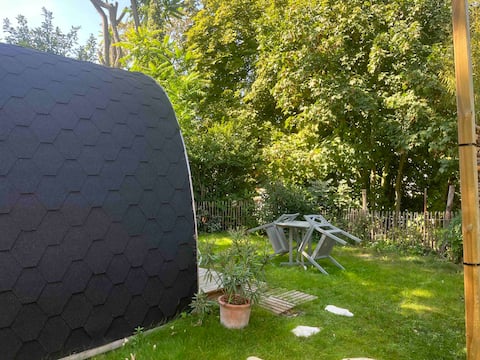
Eco lodge cabin on an island 30km from Paris
Entire Place • 1 bedroom
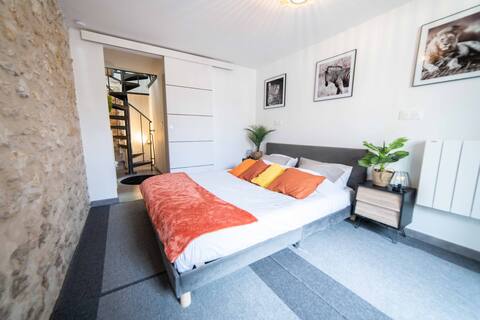
Luxury 🔆house with exterior- Waterfront
Entire Place • 1 bedroom

Wooden cabin on an island 30km from Paris
Entire Place • 1 bedroom
CharmingT4 Duplex with Garden
Entire Place • 3 bedrooms
Note: Performance varies based on location, size, amenities, seasonality, and management quality. Data reflects the past 12 months.
Top Performing Airbnb Hosts in Andrésy (2025)
Learn from the best! This table showcases top-performing Airbnb hosts in Andrésy based on the number of properties managed and estimated total revenue over the past year. Analyze their scale and performance metrics.
| Host Name | Properties | Grossing Revenue | Stay Reviews | Avg Rating |
|---|---|---|---|---|
| Isabelle | 3 | $46,006 | 167 | 3.15/5.0 |
| Nicolas | 1 | $23,984 | 199 | 4.82/5.0 |
| René-Pierre | 1 | $22,385 | 38 | 4.79/5.0 |
| Vincent | 1 | $19,509 | 101 | 4.73/5.0 |
| Pauline | 1 | $18,754 | 7 | 4.86/5.0 |
| Guillaume | 1 | $17,976 | 14 | 4.93/5.0 |
| Lea | 1 | $17,459 | 127 | 4.79/5.0 |
| Host #248638358 | 1 | $16,763 | 1 | 0.00/5.0 |
| Host #106778889 | 1 | $12,587 | 1 | 0.00/5.0 |
| David Et Cécile | 1 | $10,888 | 38 | 4.92/5.0 |
Analyzing the strategies of top hosts, such as their property selection, pricing, and guest communication, can offer valuable lessons for optimizing your own Airbnb operations in Andrésy.
Dive Deeper: Advanced Andrésy STR Market Data (2025)
Ready to unlock more insights? AirROI provides access to advanced metrics and comprehensive Airbnb data for Andrésy. Explore detailed analytics beyond this report to refine your investment strategy, optimize pricing, and maximize your vacation rental profits.
Explore Advanced MetricsAndrésy Short-Term Rental Market Composition (2025): Property & Room Types
Room Type Distribution
Property Type Distribution
Market Composition Insights for Andrésy
- The Andrésy Airbnb market composition is heavily skewed towards Entire Home/Apt listings, which make up 87.9% of the 33 active rentals. This indicates strong guest preference for privacy and space.
- Looking at the property type distribution in Andrésy, House properties are the most common (48.5%), reflecting the local real estate landscape.
- Houses represent a significant 48.5% portion, catering likely to families or larger groups.
- Smaller segments like hotel/boutique (combined 3.0%) offer potential for unique stay experiences.
Andrésy Airbnb Room Capacity Analysis (2025): Bedroom Distribution
Distribution of Listings by Number of Bedrooms
Room Capacity Insights for Andrésy
- The dominant room capacity in Andrésy is 1 bedroom listings, making up 30.3% of the market. This suggests a strong demand for properties suitable for couples or solo travelers.
- Together, 1 bedroom and 2 bedrooms properties represent 60.6% of the active Airbnb listings in Andrésy, indicating a high concentration in these sizes.
- A significant 24.2% of listings offer 3+ bedrooms, catering to larger groups and families seeking more space in Andrésy.
Andrésy Vacation Rental Guest Capacity Trends (2025)
Distribution of Listings by Guest Capacity
Guest Capacity Insights for Andrésy
- The most common guest capacity trend in Andrésy vacation rentals is listings accommodating 4 guests (33.3%). This suggests the primary traveler segment is likely small families or groups.
- Properties designed for 4 guests and 5 guests dominate the Andrésy STR market, accounting for 51.5% of listings.
- 18.2% of properties accommodate 6+ guests, serving the market segment for larger families or group travel in Andrésy.
- On average, properties in Andrésy are equipped to host 3.8 guests.
Andrésy Airbnb Booking Patterns (2025): Available vs. Booked Days
Available Days Distribution
Booked Days Distribution
Booking Pattern Insights for Andrésy
- The most common availability pattern in Andrésy falls within the 271-366 days range, representing 63.6% of listings. This suggests many properties have significant open periods on their calendars.
- Approximately 84.8% of listings show high availability (181+ days open annually), indicating potential for increased bookings or specific owner usage patterns.
- For booked days, the 1-30 days range is most frequent in Andrésy (39.4%), reflecting common guest stay durations or potential owner blocking patterns.
- A notable 18.2% of properties secure long booking periods (181+ days booked per year), highlighting successful long-term rental strategies or significant owner usage.
Andrésy Airbnb Minimum Stay Requirements Analysis
Distribution of Listings by Minimum Night Requirement
1 Night
6 listings
20.7% of total
2 Nights
11 listings
37.9% of total
3 Nights
3 listings
10.3% of total
4-6 Nights
3 listings
10.3% of total
7-29 Nights
2 listings
6.9% of total
30+ Nights
4 listings
13.8% of total
Key Insights
- The most prevalent minimum stay requirement in Andrésy is 2 Nights, adopted by 37.9% of listings. This highlights the market's preference for shorter, flexible bookings.
- A significant segment (13.8%) caters to monthly stays (30+ nights) in Andrésy, pointing to opportunities in the extended-stay market.
Recommendations
- Align with the market by considering a 2 Nights minimum stay, as 37.9% of Andrésy hosts use this setting.
- If feasible, allowing 1-night stays, especially midweek or during low season, could capture last-minute bookings, as only 20.7% currently do.
- Explore offering discounts for stays of 30+ nights to attract the 13.8% of the market seeking extended stays.
- Adjust minimum nights based on seasonality – potentially shorter during low season and longer during peak demand periods in Andrésy.
Andrésy Airbnb Cancellation Policy Trends Analysis (2025)
Flexible
7 listings
33.3% of total
Moderate
6 listings
28.6% of total
Firm
8 listings
38.1% of total
Cancellation Policy Insights for Andrésy
- The prevailing Airbnb cancellation policy trend in Andrésy is Firm, used by 38.1% of listings.
- There's a relatively balanced mix between guest-friendly (61.9%) and stricter (38.1%) policies, offering choices for different guest needs.
Recommendations for Hosts
- Consider adopting a Firm policy to align with the 38.1% market standard in Andrésy.
- Regularly review your cancellation policy against competitors and market demand shifts in Andrésy.
Andrésy STR Booking Lead Time Analysis (2025)
Average Booking Lead Time by Month
Booking Lead Time Insights for Andrésy
- The overall average booking lead time for vacation rentals in Andrésy is 44 days.
- Guests book furthest in advance for stays during August (average 90 days), likely coinciding with peak travel demand or local events.
- The shortest booking windows occur for stays in March (average 25 days), indicating more last-minute travel plans during this time.
- Seasonally, Summer (82 days avg.) sees the longest lead times, while Winter (29 days avg.) has the shortest, reflecting typical travel planning cycles.
Recommendations for Hosts
- Use the overall average lead time (44 days) as a baseline for your pricing and availability strategy in Andrésy.
- For August stays, consider implementing length-of-stay discounts or slightly higher rates for bookings made less than 90 days out to capitalize on advance planning.
- Target marketing efforts for the Summer season well in advance (at least 82 days) to capture early planners.
- Monitor your own booking lead times against these Andrésy averages to identify opportunities for dynamic pricing adjustments.
Popular & Essential Airbnb Amenities in Andrésy (2025)
Amenity Prevalence
Amenity Insights for Andrésy
- Essential amenities in Andrésy that guests expect include: Hot water. Lacking these (this) could significantly impact bookings.
- Popular amenities like Kitchen, Heating, Wifi are common but not universal. Offering these can provide a competitive edge.
- Warning: Wifi is not universally provided but is considered essential globally. Ensure reliable Wifi is offered.
Recommendations for Hosts
- Ensure your listing includes all essential amenities for Andrésy: Hot water.
- Prioritize adding missing essentials: Hot water.
- Consider adding popular differentiators like Kitchen or Heating to increase appeal.
- Highlight unique or less common amenities you offer (e.g., hot tub, dedicated workspace, EV charger) in your listing description and photos.
- Regularly check competitor amenities in Andrésy to stay competitive.
Andrésy Airbnb Guest Demographics & Profile Analysis (2025)
Guest Profile Summary for Andrésy
- The typical guest profile for Airbnb in Andrésy consists of primarily domestic travelers (79%), often arriving from nearby Paris, typically belonging to the Post-2000s (Gen Z/Alpha) group (50%), primarily speaking French or English.
- Domestic travelers account for 79.2% of guests.
- Key international markets include France (79.2%) and United Kingdom (3.4%).
- Top languages spoken are French (37.6%) followed by English (36.3%).
- A significant demographic segment is the Post-2000s (Gen Z/Alpha) group, representing 50% of guests.
Recommendations for Hosts
- Target domestic marketing efforts towards travelers from Paris and Chanteloup-les-Vignes.
- Tailor amenities and listing descriptions to appeal to the dominant Post-2000s (Gen Z/Alpha) demographic (e.g., highlight fast WiFi, smart home features, local guides).
- Highlight unique local experiences or amenities relevant to the primary guest profile.
- Consider seasonal promotions aligned with peak travel times for key origin markets.
Nearby Short-Term Rental Market Comparison
How does the Andrésy Airbnb market stack up against its neighbors? Compare key performance metrics like average monthly revenue, ADR, and occupancy rates in surrounding areas to understand the broader regional STR landscape.
| Market | Active Properties | Monthly Revenue | Daily Rate | Avg. Occupancy |
|---|---|---|---|---|
| Morienval | 10 | $5,794 | $400.84 | 32% |
| Verdelot | 13 | $3,885 | $300.79 | 46% |
| Trigny | 10 | $3,775 | $248.19 | 46% |
| La Couture-Boussey | 12 | $3,620 | $378.08 | 28% |
| Dourdan | 15 | $3,576 | $223.06 | 52% |
| Rosoy-en-Multien | 15 | $3,558 | $367.61 | 51% |
| Millançay | 11 | $3,476 | $370.42 | 39% |
| Chaintreaux | 11 | $3,136 | $278.28 | 34% |
| Langon-sur-Cher | 12 | $3,127 | $400.27 | 35% |
| Mesnils-sur-Iton | 22 | $3,028 | $309.05 | 40% |