Trith-Saint-Léger Airbnb Market Analysis 2025: Short Term Rental Data & Vacation Rental Statistics in Hauts-de-France, France
Is Airbnb profitable in Trith-Saint-Léger in 2025? Explore comprehensive Airbnb analytics for Trith-Saint-Léger, Hauts-de-France, France to uncover income potential. This 2025 STR market report for Trith-Saint-Léger, based on AirROI data from April 2024 to March 2025, reveals key trends in the niche market of 22 active listings.
Whether you're considering an Airbnb investment in Trith-Saint-Léger, optimizing your existing vacation rental, or exploring rental arbitrage opportunities, understanding the Trith-Saint-Léger Airbnb data is crucial. Leveraging the low regulation environment is key to maximizing your short term rental income potential. Let's dive into the specifics.
Key Trith-Saint-Léger Airbnb Performance Metrics Overview
Monthly Airbnb Revenue Variations & Income Potential in Trith-Saint-Léger (2025)
Understanding the monthly revenue variations for Airbnb listings in Trith-Saint-Léger is key to maximizing your short term rental income potential. Seasonality significantly impacts earnings. Our analysis, based on data from the past 12 months, shows that the peak revenue month for STRs in Trith-Saint-Léger is typically December, while March often presents the lowest earnings, highlighting opportunities for strategic pricing adjustments during shoulder and low seasons. Explore the typical Airbnb income in Trith-Saint-Léger across different performance tiers:
- Best-in-class properties (Top 10%) achieve $2,442+ monthly, often utilizing dynamic pricing and superior guest experiences.
- Strong performing properties (Top 25%) earn $1,164 or more, indicating effective management and desirable locations/amenities.
- Typical properties (Median) generate around $676 per month, representing the average market performance.
- Entry-level properties (Bottom 25%) see earnings around $278, often with potential for optimization.
Average Monthly Airbnb Earnings Trend in Trith-Saint-Léger
Trith-Saint-Léger Airbnb Occupancy Rate Trends (2025)
Maximize your bookings by understanding the Trith-Saint-Léger STR occupancy trends. Seasonal demand shifts significantly influence how often properties are booked. Typically, Augustsees the highest demand (peak season occupancy), while June experiences the lowest (low season). Effective strategies, like adjusting minimum stays or offering promotions, can boost occupancy during slower periods. Here's how different property tiers perform in Trith-Saint-Léger:
- Best-in-class properties (Top 10%) achieve 60%+ occupancy, indicating high desirability and potentially optimized availability.
- Strong performing properties (Top 25%) maintain 44% or higher occupancy, suggesting good market fit and guest satisfaction.
- Typical properties (Median) have an occupancy rate around 20%.
- Entry-level properties (Bottom 25%) average 9% occupancy, potentially facing higher vacancy.
Average Monthly Occupancy Rate Trend in Trith-Saint-Léger
Average Daily Rate (ADR) Airbnb Trends in Trith-Saint-Léger (2025)
Effective short term rental pricing strategy in Trith-Saint-Léger involves understanding monthly ADR fluctuations. The Average Daily Rate (ADR) for Airbnb in Trith-Saint-Léger typically peaks in August and dips lowest during February. Leveraging Airbnb dynamic pricing tools or strategies based on this seasonality can significantly boost revenue. Here's a look at the typical nightly rates achieved:
- Best-in-class properties (Top 10%) command rates of $199+ per night, often due to premium features or locations.
- Strong performing properties (Top 25%) achieve nightly rates of $148 or more.
- Typical properties (Median) charge around $75 per night.
- Entry-level properties (Bottom 25%) earn around $59 per night.
Average Daily Rate (ADR) Trend by Month in Trith-Saint-Léger
Get Live Trith-Saint-Léger Market Intelligence 👇

Explore Real-time Analytics
Airbnb Seasonality Analysis & Trends in Trith-Saint-Léger (2025)
Peak Season (December, August, July)
- Revenue averages $1,182 per month
- Occupancy rates average 33.5%
- Daily rates average $114
Shoulder Season
- Revenue averages $948 per month
- Occupancy maintains around 27.5%
- Daily rates hold near $101
Low Season (February, March, June)
- Revenue drops to average $740 per month
- Occupancy decreases to average 21.5%
- Daily rates adjust to average $96
Seasonality Insights for Trith-Saint-Léger
- The Airbnb seasonality in Trith-Saint-Léger shows moderate seasonality with distinct peak and low periods. While the sections above show seasonal averages, it's also insightful to look at the extremes:
- During the high season, the absolute peak month showcases Trith-Saint-Léger's highest earning potential, with monthly revenues capable of climbing to $1,223, occupancy reaching a high of 37.8%, and ADRs peaking at $122.
- Conversely, the slowest single month of the year, typically falling within the low season, marks the market's lowest point. In this month, revenue might dip to $686, occupancy could drop to 18.4%, and ADRs may adjust down to $90.
- Understanding both the seasonal averages and these monthly peaks and troughs in revenue, occupancy, and ADR is crucial for maximizing your Airbnb profit potential in Trith-Saint-Léger.
Seasonal Strategies for Maximizing Profit
- Peak Season: Maximize revenue through premium pricing and potentially longer minimum stays. Ensure high availability.
- Low Season: Offer competitive pricing, special promotions (e.g., extended stay discounts), and flexible cancellation policies. Target off-season travelers like remote workers or budget-conscious guests.
- Shoulder Seasons: Implement dynamic pricing that balances peak and low rates. Target weekend travelers or specific events. Offer slightly more flexible terms than peak season.
- Regularly analyze your own performance against these Trith-Saint-Léger seasonality benchmarks and adjust your pricing and availability strategy accordingly.
Best Areas for Airbnb Investment in Trith-Saint-Léger (2025)
Exploring the top neighborhoods for short-term rentals in Trith-Saint-Léger? This section highlights key areas, outlining why they are attractive for hosts and guests, along with notable local attractions. Consider these locations based on your target guest profile and investment strategy.
| Neighborhood / Area | Why Host Here? (Target Guests & Appeal) | Key Attractions & Landmarks |
|---|---|---|
| Village Center | Trith-Saint-Léger's picturesque village center offers a charming atmosphere with local shops and cafes. It's perfect for travelers looking to experience authentic rural French life. | Local shops, Cafes, Community events, Nearby parks, Historical sites |
| Natural Park Areas | The surrounding natural parks provide stunning landscapes and outdoor activities. Ideal for nature lovers and those seeking a quiet retreat close to nature. | Hiking trails, Birdwatching, Scenic viewpoints, Wildlife observation, Cycling routes |
| Cultural Heritage Sites | Trith-Saint-Léger has a rich cultural heritage, including historical landmarks and architecture that attract guests interested in history and culture. | Historical churches, Heritage museums, Local art galleries, Guided historical tours, Cultural events |
| Local Festivals and Events | The village hosts various local festivals throughout the year, drawing visitors and creating a vibrant community atmosphere. | Annual festivals, Art fairs, Food markets, Live music events, Local gastronomy experiences |
| Family-friendly Areas | Many accommodations cater to families, offering spacious living options and proximity to family-friendly attractions. | Playgrounds, Family-friendly parks, Nearby zoos, Amusement parks, Child-friendly restaurants |
| Weekend Getaway Spots | Close proximity to larger cities makes Trith-Saint-Léger an ideal weekend getaway destination for urban dwellers seeking relaxation. | Proximity to Hauts-de-France cities, Weekend markets, Countryside escapades, Relaxing accommodations, Scenic drives |
| Cycling and Walking Paths | The area features beautiful cycling and walking paths that attract outdoor enthusiasts and individuals seeking a healthy lifestyle. | Marked cycling routes, Scenic walking trails, Local fitness events, Bicycle rentals, Nature tours |
| Wine and Dine Experiences | The region is known for its culinary delights and local wines, attracting foodies and those seeking culturally rich experiences. | Local wineries, Gastronomic restaurants, Cooking classes, Food and wine tours, Culinary events |
Understanding Airbnb License Requirements & STR Laws in Trith-Saint-Léger (2025)
While Trith-Saint-Léger, Hauts-de-France, France currently shows low STR regulations, specific Airbnb license requirements might still exist or change. Always verify the latest short term rental regulations and Airbnb license requirements directly with local government authorities for Trith-Saint-Léger to ensure full compliance before hosting.
(Source: AirROI data, 2025, finding no licensed listings among those analyzed)
Top Performing Airbnb Properties in Trith-Saint-Léger (2025)
Benchmark your potential! Explore examples of top-performing Airbnb properties in Trith-Saint-Légerbased on Trailing Twelve Month (TTM) revenue. Analyze their characteristics, revenue, occupancy rate, and ADR to understand what drives success in this market.
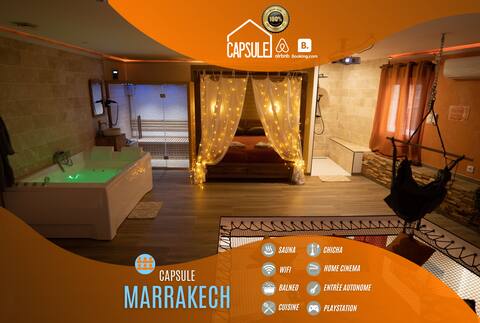
Capsule Marrakech-Hookah-Jacuzzi-Sauna-Billiards
Entire Place • 1 bedroom

chic house with all comforts
Entire Place • 4 bedrooms

Large villa, outdoor games and cinema room
Entire Place • 5 bedrooms
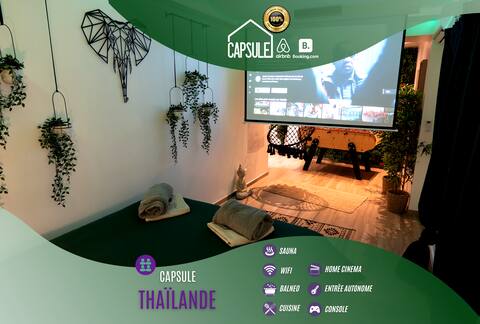
Capsule Thai Jacuzzi-Sauna Projecteur Console
Entire Place • 1 bedroom
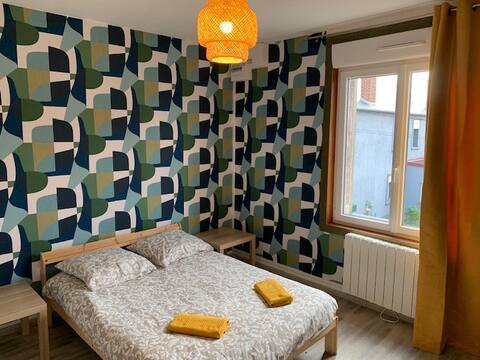
Lovely comfortable studio #3
Entire Place • 1 bedroom

Beautiful Loft
Entire Place • 1 bedroom
Note: Performance varies based on location, size, amenities, seasonality, and management quality. Data reflects the past 12 months.
Top Performing Airbnb Hosts in Trith-Saint-Léger (2025)
Learn from the best! This table showcases top-performing Airbnb hosts in Trith-Saint-Léger based on the number of properties managed and estimated total revenue over the past year. Analyze their scale and performance metrics.
| Host Name | Properties | Grossing Revenue | Stay Reviews | Avg Rating |
|---|---|---|---|---|
| Mehdi | 13 | $91,066 | 654 | 4.36/5.0 |
| Robin | 5 | $48,371 | 677 | 4.52/5.0 |
| Romain | 1 | $24,452 | 21 | 5.00/5.0 |
| Melanie | 1 | $18,247 | 10 | 4.90/5.0 |
| Sylvie | 1 | $7,330 | 15 | 4.87/5.0 |
| Host #316655800 | 1 | $2,255 | 36 | 4.25/5.0 |
Analyzing the strategies of top hosts, such as their property selection, pricing, and guest communication, can offer valuable lessons for optimizing your own Airbnb operations in Trith-Saint-Léger.
Dive Deeper: Advanced Trith-Saint-Léger STR Market Data (2025)
Ready to unlock more insights? AirROI provides access to advanced metrics and comprehensive Airbnb data for Trith-Saint-Léger. Explore detailed analytics beyond this report to refine your investment strategy, optimize pricing, and maximize your vacation rental profits.
Explore Advanced MetricsTrith-Saint-Léger Short-Term Rental Market Composition (2025): Property & Room Types
Room Type Distribution
Property Type Distribution
Market Composition Insights for Trith-Saint-Léger
- The Trith-Saint-Léger Airbnb market composition is heavily skewed towards Entire Home/Apt listings, which make up 86.4% of the 22 active rentals. This indicates strong guest preference for privacy and space.
- Looking at the property type distribution in Trith-Saint-Léger, Apartment/Condo properties are the most common (86.4%), reflecting the local real estate landscape.
Trith-Saint-Léger Airbnb Room Capacity Analysis (2025): Bedroom Distribution
Distribution of Listings by Number of Bedrooms
Room Capacity Insights for Trith-Saint-Léger
- The dominant room capacity in Trith-Saint-Léger is 1 bedroom listings, making up 86.4% of the market. This suggests a strong demand for properties suitable for couples or solo travelers.
- Together, 1 bedroom and 5+ bedrooms properties represent 90.9% of the active Airbnb listings in Trith-Saint-Léger, indicating a high concentration in these sizes.
- With over half the market (86.4%) consisting of studios or 1-bedroom units, Trith-Saint-Léger is particularly well-suited for individuals or couples.
- Listings with 3+ bedrooms (9.0%) represent a smaller niche, potentially indicating an underserved market for larger group accommodations in Trith-Saint-Léger.
Trith-Saint-Léger Vacation Rental Guest Capacity Trends (2025)
Distribution of Listings by Guest Capacity
Guest Capacity Insights for Trith-Saint-Léger
- The most common guest capacity trend in Trith-Saint-Léger vacation rentals is listings accommodating 2 guests (63.6%). This suggests the primary traveler segment is likely couples or solo travelers.
- Properties designed for 2 guests and 4 guests dominate the Trith-Saint-Léger STR market, accounting for 77.2% of listings.
- A significant 63.6% of listings cater specifically to 1-2 guests, highlighting strong demand from couples and solo travelers in Trith-Saint-Léger.
- 13.6% of properties accommodate 6+ guests, serving the market segment for larger families or group travel in Trith-Saint-Léger.
- On average, properties in Trith-Saint-Léger are equipped to host 3.0 guests.
Trith-Saint-Léger Airbnb Booking Patterns (2025): Available vs. Booked Days
Available Days Distribution
Booked Days Distribution
Booking Pattern Insights for Trith-Saint-Léger
- The most common availability pattern in Trith-Saint-Léger falls within the 271-366 days range, representing 59.1% of listings. This suggests many properties have significant open periods on their calendars.
- Approximately 86.4% of listings show high availability (181+ days open annually), indicating potential for increased bookings or specific owner usage patterns.
- For booked days, the 31-90 days range is most frequent in Trith-Saint-Léger (31.8%), reflecting common guest stay durations or potential owner blocking patterns.
- A notable 13.6% of properties secure long booking periods (181+ days booked per year), highlighting successful long-term rental strategies or significant owner usage.
Trith-Saint-Léger Airbnb Minimum Stay Requirements Analysis
Distribution of Listings by Minimum Night Requirement
1 Night
13 listings
76.5% of total
2 Nights
2 listings
11.8% of total
30+ Nights
2 listings
11.8% of total
Key Insights
- The most prevalent minimum stay requirement in Trith-Saint-Léger is 1 Night, adopted by 76.5% of listings. This highlights the market's preference for shorter, flexible bookings.
- A strong majority (88.3%) of the Trith-Saint-Léger Airbnb data shows acceptance of very short stays (1-2 nights), indicating a dynamic, high-turnover market.
- A significant segment (11.8%) caters to monthly stays (30+ nights) in Trith-Saint-Léger, pointing to opportunities in the extended-stay market.
Recommendations
- Align with the market by considering a 1 Night minimum stay, as 76.5% of Trith-Saint-Léger hosts use this setting.
- Explore offering discounts for stays of 30+ nights to attract the 11.8% of the market seeking extended stays.
- Adjust minimum nights based on seasonality – potentially shorter during low season and longer during peak demand periods in Trith-Saint-Léger.
Trith-Saint-Léger Airbnb Cancellation Policy Trends Analysis (2025)
Flexible
5 listings
26.3% of total
Moderate
12 listings
63.2% of total
Firm
1 listings
5.3% of total
Strict
1 listings
5.3% of total
Cancellation Policy Insights for Trith-Saint-Léger
- The prevailing Airbnb cancellation policy trend in Trith-Saint-Léger is Moderate, used by 63.2% of listings.
- The market strongly favors guest-friendly terms, with 89.5% of listings offering Flexible or Moderate policies. This suggests guests in Trith-Saint-Léger may expect booking flexibility.
- Strict cancellation policies are quite rare (5.3%), potentially making listings with this policy less competitive unless justified by high demand or property type.
Recommendations for Hosts
- Consider adopting a Moderate policy to align with the 63.2% market standard in Trith-Saint-Léger.
- Using a Strict policy might deter some guests, as only 5.3% of listings use it. Evaluate if potential revenue protection outweighs possible lower booking rates.
- Regularly review your cancellation policy against competitors and market demand shifts in Trith-Saint-Léger.
Trith-Saint-Léger STR Booking Lead Time Analysis (2025)
Average Booking Lead Time by Month
Booking Lead Time Insights for Trith-Saint-Léger
- The overall average booking lead time for vacation rentals in Trith-Saint-Léger is 23 days.
- Guests book furthest in advance for stays during July (average 43 days), likely coinciding with peak travel demand or local events.
- The shortest booking windows occur for stays in November (average 8 days), indicating more last-minute travel plans during this time.
- Seasonally, Summer (27 days avg.) sees the longest lead times, while Fall (9 days avg.) has the shortest, reflecting typical travel planning cycles.
Recommendations for Hosts
- Use the overall average lead time (23 days) as a baseline for your pricing and availability strategy in Trith-Saint-Léger.
- For July stays, consider implementing length-of-stay discounts or slightly higher rates for bookings made less than 43 days out to capitalize on advance planning.
- During November, focus on last-minute booking availability and promotions, as guests book with very short notice (8 days avg.).
- Target marketing efforts for the Summer season well in advance (at least 27 days) to capture early planners.
- Monitor your own booking lead times against these Trith-Saint-Léger averages to identify opportunities for dynamic pricing adjustments.
Popular & Essential Airbnb Amenities in Trith-Saint-Léger (2025)
Amenity Prevalence
Amenity Insights for Trith-Saint-Léger
- Essential amenities in Trith-Saint-Léger that guests expect include: Free parking on premises, Wifi, Kitchen, Smoke alarm, Coffee maker, Dishes and silverware, TV, Heating, Refrigerator, Hot water. Lacking these (any) could significantly impact bookings.
Recommendations for Hosts
- Ensure your listing includes all essential amenities for Trith-Saint-Léger: Free parking on premises, Wifi, Kitchen, Smoke alarm, Coffee maker, Dishes and silverware, TV, Heating, Refrigerator, Hot water.
- Prioritize adding missing essentials: Coffee maker, Dishes and silverware, TV, Heating, Refrigerator, Hot water.
- Highlight unique or less common amenities you offer (e.g., hot tub, dedicated workspace, EV charger) in your listing description and photos.
- Regularly check competitor amenities in Trith-Saint-Léger to stay competitive.
Trith-Saint-Léger Airbnb Guest Demographics & Profile Analysis (2025)
Guest Profile Summary for Trith-Saint-Léger
- The typical guest profile for Airbnb in Trith-Saint-Léger consists of primarily domestic travelers (78%), often arriving from nearby Paris, typically belonging to the Post-2000s (Gen Z/Alpha) group (50%), primarily speaking French or English.
- Domestic travelers account for 77.5% of guests.
- Key international markets include France (77.5%) and Germany (7.6%).
- Top languages spoken are French (41.6%) followed by English (29%).
- A significant demographic segment is the Post-2000s (Gen Z/Alpha) group, representing 50% of guests.
Recommendations for Hosts
- Target domestic marketing efforts towards travelers from Paris and Valenciennes.
- Tailor amenities and listing descriptions to appeal to the dominant Post-2000s (Gen Z/Alpha) demographic (e.g., highlight fast WiFi, smart home features, local guides).
- Highlight unique local experiences or amenities relevant to the primary guest profile.
- Consider seasonal promotions aligned with peak travel times for key origin markets.
Nearby Short-Term Rental Market Comparison
How does the Trith-Saint-Léger Airbnb market stack up against its neighbors? Compare key performance metrics like average monthly revenue, ADR, and occupancy rates in surrounding areas to understand the broader regional STR landscape.
| Market | Active Properties | Monthly Revenue | Daily Rate | Avg. Occupancy |
|---|---|---|---|---|
| Lo-Reninge | 12 | $6,193 | $432.10 | 49% |
| Morienval | 10 | $5,794 | $400.84 | 32% |
| Mont-de-l'Enclus | 10 | $5,508 | $360.62 | 39% |
| Dion | 13 | $4,589 | $265.41 | 58% |
| Incourt | 11 | $4,281 | $293.31 | 43% |
| Merksplas | 10 | $3,885 | $256.59 | 44% |
| Trigny | 10 | $3,775 | $248.19 | 46% |
| Kluisbergen | 17 | $3,584 | $401.50 | 44% |
| Rosoy-en-Multien | 15 | $3,558 | $367.61 | 51% |
| Brecht | 10 | $3,531 | $251.70 | 54% |