Saint-Quentin Airbnb Market Analysis 2025: Short Term Rental Data & Vacation Rental Statistics in Hauts-de-France, France
Is Airbnb profitable in Saint-Quentin in 2025? Explore comprehensive Airbnb analytics for Saint-Quentin, Hauts-de-France, France to uncover income potential. This 2025 STR market report for Saint-Quentin, based on AirROI data from April 2024 to March 2025, reveals key trends in the market of 229 active listings.
Whether you're considering an Airbnb investment in Saint-Quentin, optimizing your existing vacation rental, or exploring rental arbitrage opportunities, understanding the Saint-Quentin Airbnb data is crucial. Leveraging the low regulation environment is key to maximizing your short term rental income potential. Let's dive into the specifics.
Key Saint-Quentin Airbnb Performance Metrics Overview
Monthly Airbnb Revenue Variations & Income Potential in Saint-Quentin (2025)
Understanding the monthly revenue variations for Airbnb listings in Saint-Quentin is key to maximizing your short term rental income potential. Seasonality significantly impacts earnings. Our analysis, based on data from the past 12 months, shows that the peak revenue month for STRs in Saint-Quentin is typically May, while March often presents the lowest earnings, highlighting opportunities for strategic pricing adjustments during shoulder and low seasons. Explore the typical Airbnb income in Saint-Quentin across different performance tiers:
- Best-in-class properties (Top 10%) achieve $1,646+ monthly, often utilizing dynamic pricing and superior guest experiences.
- Strong performing properties (Top 25%) earn $1,118 or more, indicating effective management and desirable locations/amenities.
- Typical properties (Median) generate around $682 per month, representing the average market performance.
- Entry-level properties (Bottom 25%) see earnings around $291, often with potential for optimization.
Average Monthly Airbnb Earnings Trend in Saint-Quentin
Saint-Quentin Airbnb Occupancy Rate Trends (2025)
Maximize your bookings by understanding the Saint-Quentin STR occupancy trends. Seasonal demand shifts significantly influence how often properties are booked. Typically, Julysees the highest demand (peak season occupancy), while June experiences the lowest (low season). Effective strategies, like adjusting minimum stays or offering promotions, can boost occupancy during slower periods. Here's how different property tiers perform in Saint-Quentin:
- Best-in-class properties (Top 10%) achieve 69%+ occupancy, indicating high desirability and potentially optimized availability.
- Strong performing properties (Top 25%) maintain 47% or higher occupancy, suggesting good market fit and guest satisfaction.
- Typical properties (Median) have an occupancy rate around 27%.
- Entry-level properties (Bottom 25%) average 14% occupancy, potentially facing higher vacancy.
Average Monthly Occupancy Rate Trend in Saint-Quentin
Average Daily Rate (ADR) Airbnb Trends in Saint-Quentin (2025)
Effective short term rental pricing strategy in Saint-Quentin involves understanding monthly ADR fluctuations. The Average Daily Rate (ADR) for Airbnb in Saint-Quentin typically peaks in July and dips lowest during March. Leveraging Airbnb dynamic pricing tools or strategies based on this seasonality can significantly boost revenue. Here's a look at the typical nightly rates achieved:
- Best-in-class properties (Top 10%) command rates of $106+ per night, often due to premium features or locations.
- Strong performing properties (Top 25%) achieve nightly rates of $77 or more.
- Typical properties (Median) charge around $55 per night.
- Entry-level properties (Bottom 25%) earn around $43 per night.
Average Daily Rate (ADR) Trend by Month in Saint-Quentin
Get Live Saint-Quentin Market Intelligence 👇

Explore Real-time Analytics
Airbnb Seasonality Analysis & Trends in Saint-Quentin (2025)
Peak Season (May, April, June)
- Revenue averages $1,231 per month
- Occupancy rates average 31.4%
- Daily rates average $73
Shoulder Season
- Revenue averages $740 per month
- Occupancy maintains around 35.0%
- Daily rates hold near $72
Low Season (January, February, March)
- Revenue drops to average $555 per month
- Occupancy decreases to average 29.9%
- Daily rates adjust to average $65
Seasonality Insights for Saint-Quentin
- The Airbnb seasonality in Saint-Quentin shows highly seasonal trends requiring careful strategy. While the sections above show seasonal averages, it's also insightful to look at the extremes:
- During the high season, the absolute peak month showcases Saint-Quentin's highest earning potential, with monthly revenues capable of climbing to $1,303, occupancy reaching a high of 41.0%, and ADRs peaking at $75.
- Conversely, the slowest single month of the year, typically falling within the low season, marks the market's lowest point. In this month, revenue might dip to $511, occupancy could drop to 26.7%, and ADRs may adjust down to $65.
- Understanding both the seasonal averages and these monthly peaks and troughs in revenue, occupancy, and ADR is crucial for maximizing your Airbnb profit potential in Saint-Quentin.
Seasonal Strategies for Maximizing Profit
- Peak Season: Maximize revenue through premium pricing and potentially longer minimum stays. Ensure high availability.
- Low Season: Offer competitive pricing, special promotions (e.g., extended stay discounts), and flexible cancellation policies. Target off-season travelers like remote workers or budget-conscious guests.
- Shoulder Seasons: Implement dynamic pricing that balances peak and low rates. Target weekend travelers or specific events. Offer slightly more flexible terms than peak season.
- Regularly analyze your own performance against these Saint-Quentin seasonality benchmarks and adjust your pricing and availability strategy accordingly.
Best Areas for Airbnb Investment in Saint-Quentin (2025)
Exploring the top neighborhoods for short-term rentals in Saint-Quentin? This section highlights key areas, outlining why they are attractive for hosts and guests, along with notable local attractions. Consider these locations based on your target guest profile and investment strategy.
| Neighborhood / Area | Why Host Here? (Target Guests & Appeal) | Key Attractions & Landmarks |
|---|---|---|
| Quartier Saint-Jean | A charming area known for its historic architecture and close proximity to the city center. It caters to families and couples looking for a quiet yet accessible neighborhood. | Saint-Quentin Basilica, Parc d'Isle, Le Palais de Compiègne, Musee Antoine Lecuyer, Marineland |
| Centre Ville | The heart of Saint-Quentin, this area is bustling with shops, cafes, and local culture. It's ideal for tourists wanting to explore the local lifestyle and attractions. | Place de l'Hôtel de Ville, Les Halles, Basilique de Saint-Quentin, Musée Picard, Royal Kids Saint Quentin |
| Saint-Quentin Est | A residential area that is becoming popular with visitors looking for more space and a local feel. It's a great option for families or longer stays. | Parc des Champs-Elysées, Lac de l'Aisne, Centre aquatique de Saint-Quentin |
| Saint-Quentin Nord | Known for its recreational areas and parks, this region attracts guests who enjoy outdoor activities and nature, perfect for adventure seekers. | Les Jardins de la Paix, Base de Loisirs de la Fôret de Saint-Gobain, Riverside walks, Cycling routes |
| Saint-Quentin Sud | A developing neighborhood that offers a mix of urban life and peace, attracting a younger crowd looking for trendy options. | Bowling Saint-Quentin, Cinéville Saint-Quentin, Saint-Quentin Golf Club |
| La Fère | A nearby town with rich history and enjoyable surroundings, it appeals to those who seek a quieter stay with easy access to Saint-Quentin. | Historic Castle of La Fère, Local markets, Scenic countryside walks |
| Gauchy | A suburban area close to Saint-Quentin, suitable for guests who prefer a quieter environment away from the hustle and bustle. | Parc de la Beaumont, Château de Gauchy, Community Events |
| Péronne | A town just outside of Saint-Quentin, rich in history and culture, attracting visitors from all over who enjoy sightseeing and local traditions. | Historial de la Grande Guerre, Péronne Castle, Beautiful gardens, World War I memorial sites |
Understanding Airbnb License Requirements & STR Laws in Saint-Quentin (2025)
While Saint-Quentin, Hauts-de-France, France currently shows low STR regulations, specific Airbnb license requirements might still exist or change. Always verify the latest short term rental regulations and Airbnb license requirements directly with local government authorities for Saint-Quentin to ensure full compliance before hosting.
(Source: AirROI data, 2025, based on 7% licensed listings)
Top Performing Airbnb Properties in Saint-Quentin (2025)
Benchmark your potential! Explore examples of top-performing Airbnb properties in Saint-Quentinbased on Trailing Twelve Month (TTM) revenue. Analyze their characteristics, revenue, occupancy rate, and ADR to understand what drives success in this market.

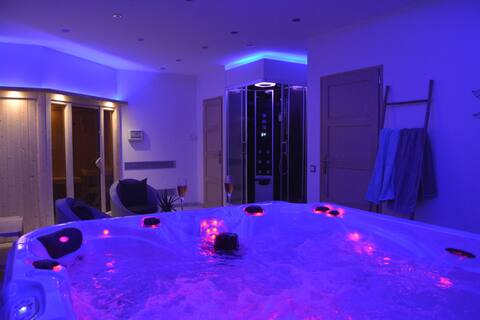
EloSpa Private Spa flat
Entire Place • 1 bedroom
Gîte ****, espace bien-être privatif, spa & sauna
Entire Place • 1 bedroom
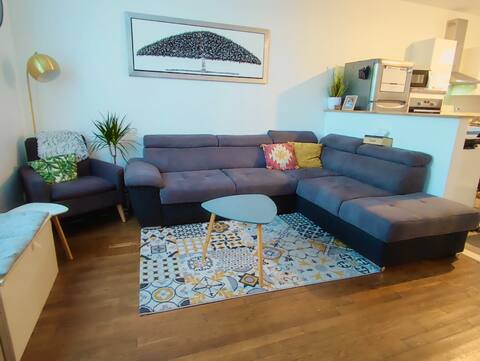
Luxury, peaceful, 3 bedroom family home
Entire Place • 3 bedrooms

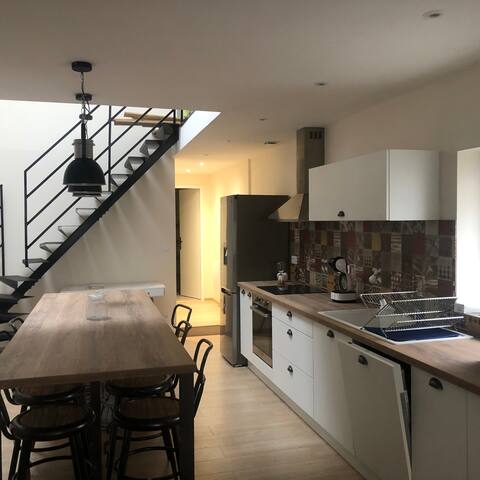
Tropical stopover, independent apartment on the ground floor
Entire Place • 2 bedrooms
A nice house to relax
Entire Place • 3 bedrooms

Nef d'Or Sapphire : Bright and Spacious Apartment
Entire Place • 1 bedroom
Note: Performance varies based on location, size, amenities, seasonality, and management quality. Data reflects the past 12 months.
Top Performing Airbnb Hosts in Saint-Quentin (2025)
Learn from the best! This table showcases top-performing Airbnb hosts in Saint-Quentin based on the number of properties managed and estimated total revenue over the past year. Analyze their scale and performance metrics.
| Host Name | Properties | Grossing Revenue | Stay Reviews | Avg Rating |
|---|---|---|---|---|
| Alexandre | 12 | $90,911 | 243 | 4.76/5.0 |
| Syndi | 16 | $74,813 | 642 | 2.86/5.0 |
| Akim | 4 | $65,155 | 199 | 4.88/5.0 |
| ZMN Conciergerie | 8 | $54,672 | 111 | 4.42/5.0 |
| David | 6 | $52,460 | 165 | 4.69/5.0 |
| Olivier | 11 | $50,190 | 796 | 4.77/5.0 |
| Fanny | 4 | $44,448 | 10 | 2.13/5.0 |
| Carole | 4 | $40,281 | 29 | 4.84/5.0 |
| By Fanny | 5 | $37,220 | 58 | 4.56/5.0 |
| Cyril | 2 | $34,263 | 60 | 4.78/5.0 |
Analyzing the strategies of top hosts, such as their property selection, pricing, and guest communication, can offer valuable lessons for optimizing your own Airbnb operations in Saint-Quentin.
Dive Deeper: Advanced Saint-Quentin STR Market Data (2025)
Ready to unlock more insights? AirROI provides access to advanced metrics and comprehensive Airbnb data for Saint-Quentin. Explore detailed analytics beyond this report to refine your investment strategy, optimize pricing, and maximize your vacation rental profits.
Explore Advanced MetricsSaint-Quentin Short-Term Rental Market Composition (2025): Property & Room Types
Room Type Distribution
Property Type Distribution
Market Composition Insights for Saint-Quentin
- The Saint-Quentin Airbnb market composition is heavily skewed towards Entire Home/Apt listings, which make up 93.4% of the 229 active rentals. This indicates strong guest preference for privacy and space.
- Looking at the property type distribution in Saint-Quentin, Apartment/Condo properties are the most common (83.4%), reflecting the local real estate landscape.
- Smaller segments like hotel/boutique, others (combined 2.1%) offer potential for unique stay experiences.
Saint-Quentin Airbnb Room Capacity Analysis (2025): Bedroom Distribution
Distribution of Listings by Number of Bedrooms
Room Capacity Insights for Saint-Quentin
- The dominant room capacity in Saint-Quentin is 1 bedroom listings, making up 63.3% of the market. This suggests a strong demand for properties suitable for couples or solo travelers.
- Together, 1 bedroom and 2 bedrooms properties represent 76.0% of the active Airbnb listings in Saint-Quentin, indicating a high concentration in these sizes.
- With over half the market (63.3%) consisting of studios or 1-bedroom units, Saint-Quentin is particularly well-suited for individuals or couples.
- Listings with 3+ bedrooms (3.9%) represent a smaller niche, potentially indicating an underserved market for larger group accommodations in Saint-Quentin.
Saint-Quentin Vacation Rental Guest Capacity Trends (2025)
Distribution of Listings by Guest Capacity
Guest Capacity Insights for Saint-Quentin
- The most common guest capacity trend in Saint-Quentin vacation rentals is listings accommodating 2 guests (50.7%). This suggests the primary traveler segment is likely couples or solo travelers.
- Properties designed for 2 guests and 4 guests dominate the Saint-Quentin STR market, accounting for 78.6% of listings.
- A significant 53.3% of listings cater specifically to 1-2 guests, highlighting strong demand from couples and solo travelers in Saint-Quentin.
- On average, properties in Saint-Quentin are equipped to host 3.0 guests.
Saint-Quentin Airbnb Booking Patterns (2025): Available vs. Booked Days
Available Days Distribution
Booked Days Distribution
Booking Pattern Insights for Saint-Quentin
- The most common availability pattern in Saint-Quentin falls within the 271-366 days range, representing 52.8% of listings. This suggests many properties have significant open periods on their calendars.
- Approximately 81.6% of listings show high availability (181+ days open annually), indicating potential for increased bookings or specific owner usage patterns.
- For booked days, the 31-90 days range is most frequent in Saint-Quentin (32.8%), reflecting common guest stay durations or potential owner blocking patterns.
- A notable 18.8% of properties secure long booking periods (181+ days booked per year), highlighting successful long-term rental strategies or significant owner usage.
Saint-Quentin Airbnb Minimum Stay Requirements Analysis
Distribution of Listings by Minimum Night Requirement
1 Night
119 listings
58.3% of total
2 Nights
34 listings
16.7% of total
3 Nights
6 listings
2.9% of total
4-6 Nights
7 listings
3.4% of total
7-29 Nights
2 listings
1% of total
30+ Nights
36 listings
17.6% of total
Key Insights
- The most prevalent minimum stay requirement in Saint-Quentin is 1 Night, adopted by 58.3% of listings. This highlights the market's preference for shorter, flexible bookings.
- A strong majority (75.0%) of the Saint-Quentin Airbnb data shows acceptance of very short stays (1-2 nights), indicating a dynamic, high-turnover market.
- A significant segment (17.6%) caters to monthly stays (30+ nights) in Saint-Quentin, pointing to opportunities in the extended-stay market.
Recommendations
- Align with the market by considering a 1 Night minimum stay, as 58.3% of Saint-Quentin hosts use this setting.
- Explore offering discounts for stays of 30+ nights to attract the 17.6% of the market seeking extended stays.
- Adjust minimum nights based on seasonality – potentially shorter during low season and longer during peak demand periods in Saint-Quentin.
Saint-Quentin Airbnb Cancellation Policy Trends Analysis (2025)
Refundable
1 listings
0.6% of total
Super Strict 60 Days
3 listings
1.7% of total
Non-refundable
3 listings
1.7% of total
Flexible
73 listings
42.4% of total
Moderate
43 listings
25% of total
Firm
19 listings
11% of total
Strict
30 listings
17.4% of total
Cancellation Policy Insights for Saint-Quentin
- The prevailing Airbnb cancellation policy trend in Saint-Quentin is Flexible, used by 42.4% of listings.
- There's a relatively balanced mix between guest-friendly (67.4%) and stricter (28.4%) policies, offering choices for different guest needs.
Recommendations for Hosts
- Consider adopting a Flexible policy to align with the 42.4% market standard in Saint-Quentin.
- Regularly review your cancellation policy against competitors and market demand shifts in Saint-Quentin.
Saint-Quentin STR Booking Lead Time Analysis (2025)
Average Booking Lead Time by Month
Booking Lead Time Insights for Saint-Quentin
- The overall average booking lead time for vacation rentals in Saint-Quentin is 26 days.
- Guests book furthest in advance for stays during July (average 52 days), likely coinciding with peak travel demand or local events.
- The shortest booking windows occur for stays in March (average 19 days), indicating more last-minute travel plans during this time.
- Seasonally, Summer (39 days avg.) sees the longest lead times, while Winter (21 days avg.) has the shortest, reflecting typical travel planning cycles.
Recommendations for Hosts
- Use the overall average lead time (26 days) as a baseline for your pricing and availability strategy in Saint-Quentin.
- For July stays, consider implementing length-of-stay discounts or slightly higher rates for bookings made less than 52 days out to capitalize on advance planning.
- Target marketing efforts for the Summer season well in advance (at least 39 days) to capture early planners.
- Monitor your own booking lead times against these Saint-Quentin averages to identify opportunities for dynamic pricing adjustments.
Popular & Essential Airbnb Amenities in Saint-Quentin (2025)
Amenity Prevalence
Amenity Insights for Saint-Quentin
- Essential amenities in Saint-Quentin that guests expect include: Heating, Wifi, TV, Hot water. Lacking these (any) could significantly impact bookings.
- Popular amenities like Kitchen, Smoke alarm, Essentials are common but not universal. Offering these can provide a competitive edge.
Recommendations for Hosts
- Ensure your listing includes all essential amenities for Saint-Quentin: Heating, Wifi, TV, Hot water.
- Prioritize adding missing essentials: Heating, Wifi, TV, Hot water.
- Consider adding popular differentiators like Kitchen or Smoke alarm to increase appeal.
- Highlight unique or less common amenities you offer (e.g., hot tub, dedicated workspace, EV charger) in your listing description and photos.
- Regularly check competitor amenities in Saint-Quentin to stay competitive.
Saint-Quentin Airbnb Guest Demographics & Profile Analysis (2025)
Guest Profile Summary for Saint-Quentin
- The typical guest profile for Airbnb in Saint-Quentin consists of primarily domestic travelers (78%), often arriving from nearby Paris, typically belonging to the Post-2000s (Gen Z/Alpha) group (50%), primarily speaking French or English.
- Domestic travelers account for 77.9% of guests.
- Key international markets include France (77.9%) and United Kingdom (7.9%).
- Top languages spoken are French (45.4%) followed by English (30.1%).
- A significant demographic segment is the Post-2000s (Gen Z/Alpha) group, representing 50% of guests.
Recommendations for Hosts
- Target domestic marketing efforts towards travelers from Paris and Saint-Quentin.
- Tailor amenities and listing descriptions to appeal to the dominant Post-2000s (Gen Z/Alpha) demographic (e.g., highlight fast WiFi, smart home features, local guides).
- Highlight unique local experiences or amenities relevant to the primary guest profile.
- Consider seasonal promotions aligned with peak travel times for key origin markets.
Nearby Short-Term Rental Market Comparison
How does the Saint-Quentin Airbnb market stack up against its neighbors? Compare key performance metrics like average monthly revenue, ADR, and occupancy rates in surrounding areas to understand the broader regional STR landscape.
| Market | Active Properties | Monthly Revenue | Daily Rate | Avg. Occupancy |
|---|---|---|---|---|
| Lo-Reninge | 12 | $6,193 | $432.10 | 49% |
| Morienval | 10 | $5,794 | $400.84 | 32% |
| Mont-de-l'Enclus | 10 | $5,508 | $360.62 | 39% |
| Dion | 13 | $4,589 | $265.41 | 58% |
| Incourt | 11 | $4,281 | $293.31 | 43% |
| Verdelot | 13 | $3,885 | $300.79 | 46% |
| Trigny | 10 | $3,775 | $248.19 | 46% |
| Kluisbergen | 17 | $3,584 | $401.50 | 44% |
| Dourdan | 15 | $3,576 | $223.06 | 52% |
| Rosoy-en-Multien | 15 | $3,558 | $367.61 | 51% |