Saint-André-lez-Lille Airbnb Market Analysis 2025: Short Term Rental Data & Vacation Rental Statistics in Hauts-de-France, France
Is Airbnb profitable in Saint-André-lez-Lille in 2025? Explore comprehensive Airbnb analytics for Saint-André-lez-Lille, Hauts-de-France, France to uncover income potential. This 2025 STR market report for Saint-André-lez-Lille, based on AirROI data from April 2024 to March 2025, reveals key trends in the niche market of 38 active listings.
Whether you're considering an Airbnb investment in Saint-André-lez-Lille, optimizing your existing vacation rental, or exploring rental arbitrage opportunities, understanding the Saint-André-lez-Lille Airbnb data is crucial. Leveraging the low regulation environment is key to maximizing your short term rental income potential. Let's dive into the specifics.
Key Saint-André-lez-Lille Airbnb Performance Metrics Overview
Monthly Airbnb Revenue Variations & Income Potential in Saint-André-lez-Lille (2025)
Understanding the monthly revenue variations for Airbnb listings in Saint-André-lez-Lille is key to maximizing your short term rental income potential. Seasonality significantly impacts earnings. Our analysis, based on data from the past 12 months, shows that the peak revenue month for STRs in Saint-André-lez-Lille is typically June, while March often presents the lowest earnings, highlighting opportunities for strategic pricing adjustments during shoulder and low seasons. Explore the typical Airbnb income in Saint-André-lez-Lille across different performance tiers:
- Best-in-class properties (Top 10%) achieve $4,297+ monthly, often utilizing dynamic pricing and superior guest experiences.
- Strong performing properties (Top 25%) earn $2,485 or more, indicating effective management and desirable locations/amenities.
- Typical properties (Median) generate around $1,456 per month, representing the average market performance.
- Entry-level properties (Bottom 25%) see earnings around $684, often with potential for optimization.
Average Monthly Airbnb Earnings Trend in Saint-André-lez-Lille
Saint-André-lez-Lille Airbnb Occupancy Rate Trends (2025)
Maximize your bookings by understanding the Saint-André-lez-Lille STR occupancy trends. Seasonal demand shifts significantly influence how often properties are booked. Typically, Octobersees the highest demand (peak season occupancy), while March experiences the lowest (low season). Effective strategies, like adjusting minimum stays or offering promotions, can boost occupancy during slower periods. Here's how different property tiers perform in Saint-André-lez-Lille:
- Best-in-class properties (Top 10%) achieve 84%+ occupancy, indicating high desirability and potentially optimized availability.
- Strong performing properties (Top 25%) maintain 69% or higher occupancy, suggesting good market fit and guest satisfaction.
- Typical properties (Median) have an occupancy rate around 40%.
- Entry-level properties (Bottom 25%) average 20% occupancy, potentially facing higher vacancy.
Average Monthly Occupancy Rate Trend in Saint-André-lez-Lille
Average Daily Rate (ADR) Airbnb Trends in Saint-André-lez-Lille (2025)
Effective short term rental pricing strategy in Saint-André-lez-Lille involves understanding monthly ADR fluctuations. The Average Daily Rate (ADR) for Airbnb in Saint-André-lez-Lille typically peaks in July and dips lowest during February. Leveraging Airbnb dynamic pricing tools or strategies based on this seasonality can significantly boost revenue. Here's a look at the typical nightly rates achieved:
- Best-in-class properties (Top 10%) command rates of $223+ per night, often due to premium features or locations.
- Strong performing properties (Top 25%) achieve nightly rates of $143 or more.
- Typical properties (Median) charge around $91 per night.
- Entry-level properties (Bottom 25%) earn around $62 per night.
Average Daily Rate (ADR) Trend by Month in Saint-André-lez-Lille
Get Live Saint-André-lez-Lille Market Intelligence 👇

Explore Real-time Analytics
Airbnb Seasonality Analysis & Trends in Saint-André-lez-Lille (2025)
Peak Season (June, April, May)
- Revenue averages $2,559 per month
- Occupancy rates average 38.1%
- Daily rates average $115
Shoulder Season
- Revenue averages $1,915 per month
- Occupancy maintains around 51.3%
- Daily rates hold near $112
Low Season (February, March, September)
- Revenue drops to average $1,072 per month
- Occupancy decreases to average 34.9%
- Daily rates adjust to average $106
Seasonality Insights for Saint-André-lez-Lille
- The Airbnb seasonality in Saint-André-lez-Lille shows highly seasonal trends requiring careful strategy. While the sections above show seasonal averages, it's also insightful to look at the extremes:
- During the high season, the absolute peak month showcases Saint-André-lez-Lille's highest earning potential, with monthly revenues capable of climbing to $2,706, occupancy reaching a high of 59.5%, and ADRs peaking at $119.
- Conversely, the slowest single month of the year, typically falling within the low season, marks the market's lowest point. In this month, revenue might dip to $791, occupancy could drop to 31.7%, and ADRs may adjust down to $103.
- Understanding both the seasonal averages and these monthly peaks and troughs in revenue, occupancy, and ADR is crucial for maximizing your Airbnb profit potential in Saint-André-lez-Lille.
Seasonal Strategies for Maximizing Profit
- Peak Season: Maximize revenue through premium pricing and potentially longer minimum stays. Ensure high availability.
- Low Season: Offer competitive pricing, special promotions (e.g., extended stay discounts), and flexible cancellation policies. Target off-season travelers like remote workers or budget-conscious guests.
- Shoulder Seasons: Implement dynamic pricing that balances peak and low rates. Target weekend travelers or specific events. Offer slightly more flexible terms than peak season.
- Regularly analyze your own performance against these Saint-André-lez-Lille seasonality benchmarks and adjust your pricing and availability strategy accordingly.
Best Areas for Airbnb Investment in Saint-André-lez-Lille (2025)
Exploring the top neighborhoods for short-term rentals in Saint-André-lez-Lille? This section highlights key areas, outlining why they are attractive for hosts and guests, along with notable local attractions. Consider these locations based on your target guest profile and investment strategy.
| Neighborhood / Area | Why Host Here? (Target Guests & Appeal) | Key Attractions & Landmarks |
|---|---|---|
| Centre-ville | The bustling city center with a vibrant atmosphere and a mix of shops, restaurants, and cultural attractions. Ideal for those looking to experience the local lifestyle and historical sites. | Espace culturel, la Gare, Lille Cathedral, Palais des Beaux-Arts, Grand Place, Old Stock Exchange |
| Saint-André Nord | A quieter residential area that appeals to families and long-term visitors. Close to parks and local amenities, perfect for longer stays. | Parc du Château, local markets, community parks, cafés and shops |
| Saint-Maurice | A charming area known for its green spaces and proximity to the Deûle River. Ideal for outdoor enthusiasts and those seeking relaxation away from the hustle. | Deûle River pathways, Parc des Cygnes, local trails, bike paths |
| Les Prés | A growing neighborhood that is starting to attract more visitors due to its local vibe and amenities. Offers affordable options and a glimpse of local life. | local eateries, Café de l'Horloge, local shops, Saint-André church |
| Rue du Vieux Lille | Known for its historical architecture and picturesque streets. This area is popular with tourists interested in local history and culture. | Rue de la Monnaie, Maison natale de Charles de Gaulle, Lille's cobbled streets, independent boutiques |
| Lille Sud | An area with a burgeoning art scene and cultural events. A favorite spot for young travelers and artists looking for creative inspiration. | street art, community art projects, local galleries, events at La Condition Publique |
| Courage | A dynamic area with a mix of modern and traditional French culture. Offers an engaging experience for visitors looking to blend local life with tourism. | local restaurants, cafés, craft shops, community events |
| Saint-André | A centrally located area with easy access to transport links and amenities, making it a convenient spot for short-term rentals. | Metro station access, local shopping, variety of restaurants, parks nearby |
Understanding Airbnb License Requirements & STR Laws in Saint-André-lez-Lille (2025)
While Saint-André-lez-Lille, Hauts-de-France, France currently shows low STR regulations, specific Airbnb license requirements might still exist or change. Always verify the latest short term rental regulations and Airbnb license requirements directly with local government authorities for Saint-André-lez-Lille to ensure full compliance before hosting.
(Source: AirROI data, 2025, finding no licensed listings among those analyzed)
Top Performing Airbnb Properties in Saint-André-lez-Lille (2025)
Benchmark your potential! Explore examples of top-performing Airbnb properties in Saint-André-lez-Lillebased on Trailing Twelve Month (TTM) revenue. Analyze their characteristics, revenue, occupancy rate, and ADR to understand what drives success in this market.
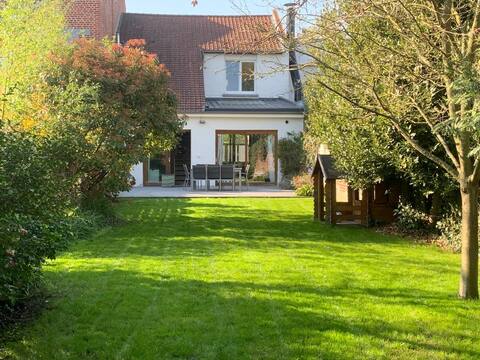
House,garden,near Lille, free parking.
Entire Place • 3 bedrooms

House T6, Vieux-Lille, free car park, Citadel
Entire Place • 5 bedrooms
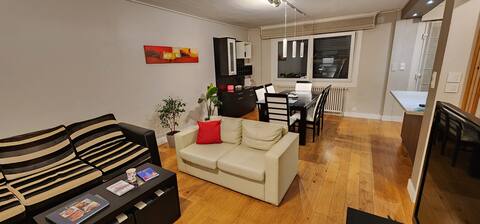
Two bedroom house with courtyard, quiet
Entire Place • 2 bedrooms
Amazing house in lovely neighborhood beside Lille
Entire Place • 4 bedrooms

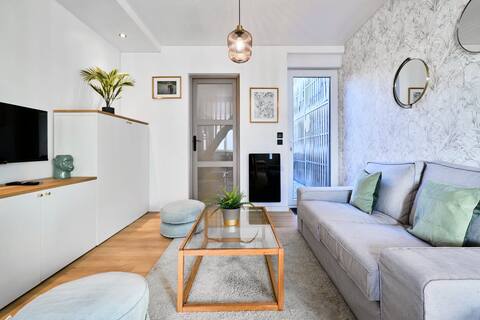
Apartment 2 steps from Old Lille
Entire Place • 1 bedroom
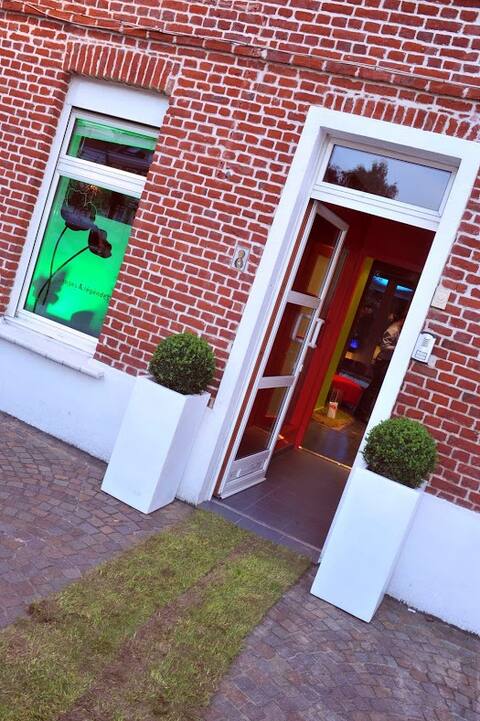
The house on the square
Entire Place • 1 bedroom
Note: Performance varies based on location, size, amenities, seasonality, and management quality. Data reflects the past 12 months.
Top Performing Airbnb Hosts in Saint-André-lez-Lille (2025)
Learn from the best! This table showcases top-performing Airbnb hosts in Saint-André-lez-Lille based on the number of properties managed and estimated total revenue over the past year. Analyze their scale and performance metrics.
| Host Name | Properties | Grossing Revenue | Stay Reviews | Avg Rating |
|---|---|---|---|---|
| Veronique | 1 | $57,443 | 12 | 4.83/5.0 |
| Monika | 1 | $45,321 | 7 | 5.00/5.0 |
| Hugo | 1 | $44,626 | 22 | 4.68/5.0 |
| Jonathan | 1 | $39,039 | 24 | 4.88/5.0 |
| Hugo | 1 | $32,198 | 52 | 5.00/5.0 |
| Laure | 1 | $26,016 | 66 | 4.88/5.0 |
| Caroline | 1 | $25,155 | 4 | 5.00/5.0 |
| Guillaume | 1 | $24,782 | 16 | 4.88/5.0 |
| Benoît | 1 | $24,758 | 43 | 4.79/5.0 |
| Stephanie | 1 | $22,439 | 33 | 4.97/5.0 |
Analyzing the strategies of top hosts, such as their property selection, pricing, and guest communication, can offer valuable lessons for optimizing your own Airbnb operations in Saint-André-lez-Lille.
Dive Deeper: Advanced Saint-André-lez-Lille STR Market Data (2025)
Ready to unlock more insights? AirROI provides access to advanced metrics and comprehensive Airbnb data for Saint-André-lez-Lille. Explore detailed analytics beyond this report to refine your investment strategy, optimize pricing, and maximize your vacation rental profits.
Explore Advanced MetricsSaint-André-lez-Lille Short-Term Rental Market Composition (2025): Property & Room Types
Room Type Distribution
Property Type Distribution
Market Composition Insights for Saint-André-lez-Lille
- The Saint-André-lez-Lille Airbnb market composition is heavily skewed towards Entire Home/Apt listings, which make up 71.1% of the 38 active rentals. This indicates strong guest preference for privacy and space.
- Looking at the property type distribution in Saint-André-lez-Lille, Apartment/Condo properties are the most common (55.3%), reflecting the local real estate landscape.
- Houses represent a significant 39.5% portion, catering likely to families or larger groups.
- The presence of 5.3% Hotel/Boutique listings indicates integration with traditional hospitality.
Saint-André-lez-Lille Airbnb Room Capacity Analysis (2025): Bedroom Distribution
Distribution of Listings by Number of Bedrooms
Room Capacity Insights for Saint-André-lez-Lille
- The dominant room capacity in Saint-André-lez-Lille is 1 bedroom listings, making up 42.1% of the market. This suggests a strong demand for properties suitable for couples or solo travelers.
- Together, 1 bedroom and 2 bedrooms properties represent 68.4% of the active Airbnb listings in Saint-André-lez-Lille, indicating a high concentration in these sizes.
Saint-André-lez-Lille Vacation Rental Guest Capacity Trends (2025)
Distribution of Listings by Guest Capacity
Guest Capacity Insights for Saint-André-lez-Lille
- The most common guest capacity trend in Saint-André-lez-Lille vacation rentals is listings accommodating 4 guests (34.2%). This suggests the primary traveler segment is likely small families or groups.
- Properties designed for 4 guests and 2 guests dominate the Saint-André-lez-Lille STR market, accounting for 55.3% of listings.
- 18.5% of properties accommodate 6+ guests, serving the market segment for larger families or group travel in Saint-André-lez-Lille.
- On average, properties in Saint-André-lez-Lille are equipped to host 3.5 guests.
Saint-André-lez-Lille Airbnb Booking Patterns (2025): Available vs. Booked Days
Available Days Distribution
Booked Days Distribution
Booking Pattern Insights for Saint-André-lez-Lille
- The most common availability pattern in Saint-André-lez-Lille falls within the 271-366 days range, representing 50% of listings. This suggests many properties have significant open periods on their calendars.
- Approximately 68.4% of listings show high availability (181+ days open annually), indicating potential for increased bookings or specific owner usage patterns.
- For booked days, the 181-270 days range is most frequent in Saint-André-lez-Lille (26.3%), reflecting common guest stay durations or potential owner blocking patterns.
- A notable 31.6% of properties secure long booking periods (181+ days booked per year), highlighting successful long-term rental strategies or significant owner usage.
Saint-André-lez-Lille Airbnb Minimum Stay Requirements Analysis
Distribution of Listings by Minimum Night Requirement
1 Night
13 listings
41.9% of total
2 Nights
9 listings
29% of total
3 Nights
2 listings
6.5% of total
4-6 Nights
1 listings
3.2% of total
30+ Nights
6 listings
19.4% of total
Key Insights
- The most prevalent minimum stay requirement in Saint-André-lez-Lille is 1 Night, adopted by 41.9% of listings. This highlights the market's preference for shorter, flexible bookings.
- A strong majority (70.9%) of the Saint-André-lez-Lille Airbnb data shows acceptance of very short stays (1-2 nights), indicating a dynamic, high-turnover market.
- A significant segment (19.4%) caters to monthly stays (30+ nights) in Saint-André-lez-Lille, pointing to opportunities in the extended-stay market.
Recommendations
- Align with the market by considering a 1 Night minimum stay, as 41.9% of Saint-André-lez-Lille hosts use this setting.
- Explore offering discounts for stays of 30+ nights to attract the 19.4% of the market seeking extended stays.
- Adjust minimum nights based on seasonality – potentially shorter during low season and longer during peak demand periods in Saint-André-lez-Lille.
Saint-André-lez-Lille Airbnb Cancellation Policy Trends Analysis (2025)
Flexible
7 listings
26.9% of total
Moderate
10 listings
38.5% of total
Firm
5 listings
19.2% of total
Strict
4 listings
15.4% of total
Cancellation Policy Insights for Saint-André-lez-Lille
- The prevailing Airbnb cancellation policy trend in Saint-André-lez-Lille is Moderate, used by 38.5% of listings.
- There's a relatively balanced mix between guest-friendly (65.4%) and stricter (34.6%) policies, offering choices for different guest needs.
Recommendations for Hosts
- Consider adopting a Moderate policy to align with the 38.5% market standard in Saint-André-lez-Lille.
- Regularly review your cancellation policy against competitors and market demand shifts in Saint-André-lez-Lille.
Saint-André-lez-Lille STR Booking Lead Time Analysis (2025)
Average Booking Lead Time by Month
Booking Lead Time Insights for Saint-André-lez-Lille
- The overall average booking lead time for vacation rentals in Saint-André-lez-Lille is 42 days.
- Guests book furthest in advance for stays during July (average 126 days), likely coinciding with peak travel demand or local events.
- The shortest booking windows occur for stays in February (average 29 days), indicating more last-minute travel plans during this time.
- Seasonally, Summer (94 days avg.) sees the longest lead times, while Winter (34 days avg.) has the shortest, reflecting typical travel planning cycles.
Recommendations for Hosts
- Use the overall average lead time (42 days) as a baseline for your pricing and availability strategy in Saint-André-lez-Lille.
- For July stays, consider implementing length-of-stay discounts or slightly higher rates for bookings made less than 126 days out to capitalize on advance planning.
- Target marketing efforts for the Summer season well in advance (at least 94 days) to capture early planners.
- Monitor your own booking lead times against these Saint-André-lez-Lille averages to identify opportunities for dynamic pricing adjustments.
Popular & Essential Airbnb Amenities in Saint-André-lez-Lille (2025)
Amenity Prevalence
Amenity Insights for Saint-André-lez-Lille
- Essential amenities in Saint-André-lez-Lille that guests expect include: Wifi, Kitchen, Heating. Lacking these (any) could significantly impact bookings.
- Popular amenities like Washer, TV, Hot water are common but not universal. Offering these can provide a competitive edge.
Recommendations for Hosts
- Ensure your listing includes all essential amenities for Saint-André-lez-Lille: Wifi, Kitchen, Heating.
- Prioritize adding missing essentials: Wifi, Kitchen, Heating.
- Consider adding popular differentiators like Washer or TV to increase appeal.
- Highlight unique or less common amenities you offer (e.g., hot tub, dedicated workspace, EV charger) in your listing description and photos.
- Regularly check competitor amenities in Saint-André-lez-Lille to stay competitive.
Saint-André-lez-Lille Airbnb Guest Demographics & Profile Analysis (2025)
Guest Profile Summary for Saint-André-lez-Lille
- The typical guest profile for Airbnb in Saint-André-lez-Lille consists of primarily domestic travelers (70%), often arriving from nearby Paris, typically belonging to the Post-2000s (Gen Z/Alpha) group (50%), primarily speaking English or French.
- Domestic travelers account for 70.4% of guests.
- Key international markets include France (70.4%) and Germany (5.7%).
- Top languages spoken are English (36.5%) followed by French (35.4%).
- A significant demographic segment is the Post-2000s (Gen Z/Alpha) group, representing 50% of guests.
Recommendations for Hosts
- Target domestic marketing efforts towards travelers from Paris and Lille.
- Tailor amenities and listing descriptions to appeal to the dominant Post-2000s (Gen Z/Alpha) demographic (e.g., highlight fast WiFi, smart home features, local guides).
- Highlight unique local experiences or amenities relevant to the primary guest profile.
- Consider seasonal promotions aligned with peak travel times for key origin markets.
Nearby Short-Term Rental Market Comparison
How does the Saint-André-lez-Lille Airbnb market stack up against its neighbors? Compare key performance metrics like average monthly revenue, ADR, and occupancy rates in surrounding areas to understand the broader regional STR landscape.
| Market | Active Properties | Monthly Revenue | Daily Rate | Avg. Occupancy |
|---|---|---|---|---|
| Lo-Reninge | 12 | $6,193 | $432.10 | 49% |
| Morienval | 10 | $5,794 | $400.84 | 32% |
| Mont-de-l'Enclus | 10 | $5,508 | $360.62 | 39% |
| Dion | 13 | $4,589 | $265.41 | 58% |
| Incourt | 11 | $4,281 | $293.31 | 43% |
| Merksplas | 10 | $3,885 | $256.59 | 44% |
| Trigny | 10 | $3,775 | $248.19 | 46% |
| Kluisbergen | 17 | $3,584 | $401.50 | 44% |
| Rosoy-en-Multien | 15 | $3,558 | $367.61 | 51% |
| Brecht | 10 | $3,531 | $251.70 | 54% |