Rue Airbnb Market Analysis 2025: Short Term Rental Data & Vacation Rental Statistics in Hauts-de-France, France
Is Airbnb profitable in Rue in 2025? Explore comprehensive Airbnb analytics for Rue, Hauts-de-France, France to uncover income potential. This 2025 STR market report for Rue, based on AirROI data from April 2024 to March 2025, reveals key trends in the niche market of 49 active listings.
Whether you're considering an Airbnb investment in Rue, optimizing your existing vacation rental, or exploring rental arbitrage opportunities, understanding the Rue Airbnb data is crucial. Leveraging the low regulation environment is key to maximizing your short term rental income potential. Let's dive into the specifics.
Key Rue Airbnb Performance Metrics Overview
Monthly Airbnb Revenue Variations & Income Potential in Rue (2025)
Understanding the monthly revenue variations for Airbnb listings in Rue is key to maximizing your short term rental income potential. Seasonality significantly impacts earnings. Our analysis, based on data from the past 12 months, shows that the peak revenue month for STRs in Rue is typically August, while February often presents the lowest earnings, highlighting opportunities for strategic pricing adjustments during shoulder and low seasons. Explore the typical Airbnb income in Rue across different performance tiers:
- Best-in-class properties (Top 10%) achieve $4,007+ monthly, often utilizing dynamic pricing and superior guest experiences.
- Strong performing properties (Top 25%) earn $2,213 or more, indicating effective management and desirable locations/amenities.
- Typical properties (Median) generate around $1,248 per month, representing the average market performance.
- Entry-level properties (Bottom 25%) see earnings around $611, often with potential for optimization.
Average Monthly Airbnb Earnings Trend in Rue
Rue Airbnb Occupancy Rate Trends (2025)
Maximize your bookings by understanding the Rue STR occupancy trends. Seasonal demand shifts significantly influence how often properties are booked. Typically, Augustsees the highest demand (peak season occupancy), while January experiences the lowest (low season). Effective strategies, like adjusting minimum stays or offering promotions, can boost occupancy during slower periods. Here's how different property tiers perform in Rue:
- Best-in-class properties (Top 10%) achieve 53%+ occupancy, indicating high desirability and potentially optimized availability.
- Strong performing properties (Top 25%) maintain 42% or higher occupancy, suggesting good market fit and guest satisfaction.
- Typical properties (Median) have an occupancy rate around 26%.
- Entry-level properties (Bottom 25%) average 14% occupancy, potentially facing higher vacancy.
Average Monthly Occupancy Rate Trend in Rue
Average Daily Rate (ADR) Airbnb Trends in Rue (2025)
Effective short term rental pricing strategy in Rue involves understanding monthly ADR fluctuations. The Average Daily Rate (ADR) for Airbnb in Rue typically peaks in July and dips lowest during March. Leveraging Airbnb dynamic pricing tools or strategies based on this seasonality can significantly boost revenue. Here's a look at the typical nightly rates achieved:
- Best-in-class properties (Top 10%) command rates of $405+ per night, often due to premium features or locations.
- Strong performing properties (Top 25%) achieve nightly rates of $208 or more.
- Typical properties (Median) charge around $120 per night.
- Entry-level properties (Bottom 25%) earn around $89 per night.
Average Daily Rate (ADR) Trend by Month in Rue
Get Live Rue Market Intelligence 👇

Explore Real-time Analytics
Airbnb Seasonality Analysis & Trends in Rue (2025)
Peak Season (August, July, May)
- Revenue averages $2,719 per month
- Occupancy rates average 46.2%
- Daily rates average $185
Shoulder Season
- Revenue averages $1,707 per month
- Occupancy maintains around 25.8%
- Daily rates hold near $178
Low Season (February, March, November)
- Revenue drops to average $902 per month
- Occupancy decreases to average 20.0%
- Daily rates adjust to average $171
Seasonality Insights for Rue
- The Airbnb seasonality in Rue shows highly seasonal trends requiring careful strategy. While the sections above show seasonal averages, it's also insightful to look at the extremes:
- During the high season, the absolute peak month showcases Rue's highest earning potential, with monthly revenues capable of climbing to $2,985, occupancy reaching a high of 54.1%, and ADRs peaking at $187.
- Conversely, the slowest single month of the year, typically falling within the low season, marks the market's lowest point. In this month, revenue might dip to $696, occupancy could drop to 18.0%, and ADRs may adjust down to $167.
- Understanding both the seasonal averages and these monthly peaks and troughs in revenue, occupancy, and ADR is crucial for maximizing your Airbnb profit potential in Rue.
Seasonal Strategies for Maximizing Profit
- Peak Season: Maximize revenue through premium pricing and potentially longer minimum stays. Ensure high availability.
- Low Season: Offer competitive pricing, special promotions (e.g., extended stay discounts), and flexible cancellation policies. Target off-season travelers like remote workers or budget-conscious guests.
- Shoulder Seasons: Implement dynamic pricing that balances peak and low rates. Target weekend travelers or specific events. Offer slightly more flexible terms than peak season.
- Regularly analyze your own performance against these Rue seasonality benchmarks and adjust your pricing and availability strategy accordingly.
Best Areas for Airbnb Investment in Rue (2025)
Exploring the top neighborhoods for short-term rentals in Rue? This section highlights key areas, outlining why they are attractive for hosts and guests, along with notable local attractions. Consider these locations based on your target guest profile and investment strategy.
| Neighborhood / Area | Why Host Here? (Target Guests & Appeal) | Key Attractions & Landmarks |
|---|---|---|
| Lille | The capital of the Hauts-de-France region, Lille is a vibrant city known for its rich history and cultural diversity. It attracts both tourists and business travelers, thanks to its excellent transport connections and a thriving arts scene. | Old Lille, Palais des Beaux-Arts, Lille Citadel, Grand Place, La Piscine Museum, Wazemmes Market |
| Arras | Famous for its beautiful squares and rich history, Arras is a popular destination for history buffs and those interested in World War I heritage. Its charming architecture and vibrant cafés make it a great spot for visitors. | Place des Héros, Arras Citadel, Carrière Wellington, Belfry of Arras, Musee des Beaux-Arts, Église Saint-Jean |
| Amiens | Known for its stunning cathedral and floating gardens, Amiens offers a mix of history, culture, and natural beauty. It's a UNESCO World Heritage site that attracts visitors for its unique features. | Amiens Cathedral, Saint-Leu district, Les Hortillonnages, Maison de Jules Verne, Parc Saint-Pierre, Musee de Picardie |
| Douai | With a rich industrial past and beautiful architecture, Douai is a great location for short-term rentals. Its proximity to Lille makes it accessible for tourists looking for quieter surroundings. | Douai Town Hall, The Belfry of Douai, Musee de la Chartreuse, Place Charles de Gaulle, Jardin des Floralies |
| Saint-Quentin | A charming town known for its Art Deco architecture and beautiful parks, Saint-Quentin attracts visitors who appreciate history and outdoor activities. It’s ideal for families and tourists. | Saint-Quentin Basilica, Parc d'Isle, Museum of the Avery, Belfry of Saint-Quentin, Jardin public |
| Calais | Renowned for its ferry connections to the UK, Calais is a bustling port city that draws visitors for short stays. The rich maritime history and nearby beaches make it an attractive destination. | Calais Lighthouse, Cité Europe, Les Six Bourgeois, Calais Beach, Musée des Beaux-Arts |
| Compiègne | Rich in history and nature, Compiègne is known for its palace and stunning gardens. It’s a serene destination for tourists looking for a blend of culture and nature. | Palace of Compiègne, Compiègne State Forest, Musée des Beaux-Arts, Parc du Palais, Hôtel de Ville |
| Beauvais | Famous for its Cathedral and historical sites, Beauvais is an attractive destination for those interested in French culture and architecture. Its close proximity to Paris is an added bonus. | Beauvais Cathedral, Château de Troissereux, Musée de l'Oise, Parc Marcel Dassault, Saint-Étienne Church |
Understanding Airbnb License Requirements & STR Laws in Rue (2025)
While Rue, Hauts-de-France, France currently shows low STR regulations, specific Airbnb license requirements might still exist or change. Always verify the latest short term rental regulations and Airbnb license requirements directly with local government authorities for Rue to ensure full compliance before hosting.
(Source: AirROI data, 2025, based on 6% licensed listings)
Top Performing Airbnb Properties in Rue (2025)
Benchmark your potential! Explore examples of top-performing Airbnb properties in Ruebased on Trailing Twelve Month (TTM) revenue. Analyze their characteristics, revenue, occupancy rate, and ADR to understand what drives success in this market.
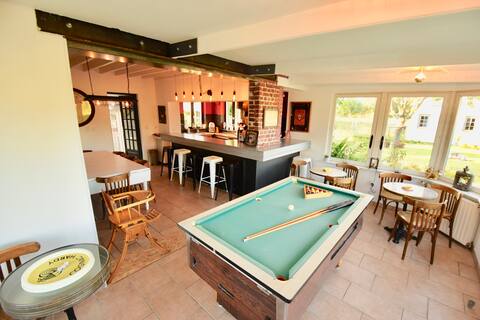
Parenthèse en Baie de Somme
Entire Place • 5 bedrooms

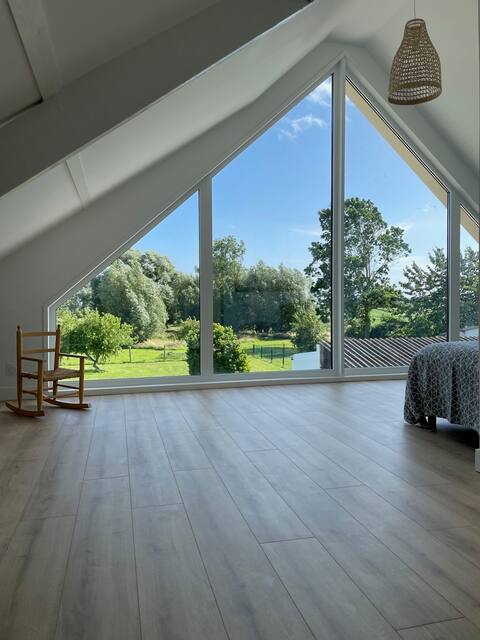
Holiday house in Baie de Somme sleeps 12
Entire Place • 5 bedrooms
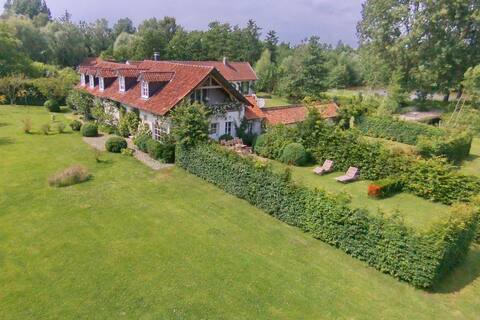
family home in a green setting
Entire Place • 5 bedrooms
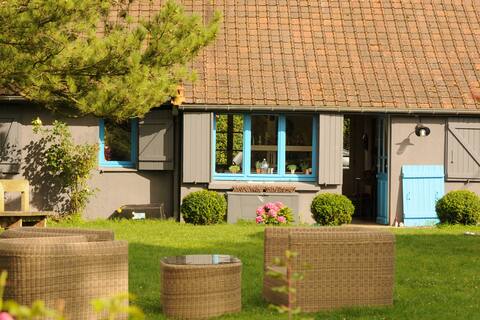
Nice farmhouse in the Bay of Somme 8 km from the beach
Entire Place • 5 bedrooms

Large family cottage in Baie de Somme
Entire Place • 6 bedrooms
Charming villa between two bays
Entire Place • 5 bedrooms
Note: Performance varies based on location, size, amenities, seasonality, and management quality. Data reflects the past 12 months.
Top Performing Airbnb Hosts in Rue (2025)
Learn from the best! This table showcases top-performing Airbnb hosts in Rue based on the number of properties managed and estimated total revenue over the past year. Analyze their scale and performance metrics.
| Host Name | Properties | Grossing Revenue | Stay Reviews | Avg Rating |
|---|---|---|---|---|
| Sophie | 3 | $97,127 | 62 | 4.92/5.0 |
| Melodie | 1 | $58,256 | 56 | 4.95/5.0 |
| Baptiste | 1 | $54,737 | 32 | 4.88/5.0 |
| Nicolas | 1 | $52,542 | 103 | 4.97/5.0 |
| Laurent | 2 | $43,210 | 228 | 4.76/5.0 |
| Francis | 5 | $39,023 | 25 | 3.74/5.0 |
| Pascal | 7 | $37,180 | 6 | 0.64/5.0 |
| Vulfran | 1 | $34,822 | 23 | 4.91/5.0 |
| Anne Claire | 2 | $34,581 | 61 | 4.58/5.0 |
| Jeanne | 1 | $24,717 | 38 | 4.82/5.0 |
Analyzing the strategies of top hosts, such as their property selection, pricing, and guest communication, can offer valuable lessons for optimizing your own Airbnb operations in Rue.
Dive Deeper: Advanced Rue STR Market Data (2025)
Ready to unlock more insights? AirROI provides access to advanced metrics and comprehensive Airbnb data for Rue. Explore detailed analytics beyond this report to refine your investment strategy, optimize pricing, and maximize your vacation rental profits.
Explore Advanced MetricsRue Short-Term Rental Market Composition (2025): Property & Room Types
Room Type Distribution
Property Type Distribution
Market Composition Insights for Rue
- The Rue Airbnb market composition is heavily skewed towards Entire Home/Apt listings, which make up 79.6% of the 49 active rentals. This indicates strong guest preference for privacy and space.
- Looking at the property type distribution in Rue, House properties are the most common (73.5%), reflecting the local real estate landscape.
- Houses represent a significant 73.5% portion, catering likely to families or larger groups.
- The presence of 18.4% Hotel/Boutique listings indicates integration with traditional hospitality.
- Smaller segments like others (combined 2.0%) offer potential for unique stay experiences.
Rue Airbnb Room Capacity Analysis (2025): Bedroom Distribution
Distribution of Listings by Number of Bedrooms
Room Capacity Insights for Rue
- The dominant room capacity in Rue is 1 bedroom listings, making up 22.4% of the market. This suggests a strong demand for properties suitable for couples or solo travelers.
- Together, 1 bedroom and 2 bedrooms properties represent 42.8% of the active Airbnb listings in Rue, indicating a high concentration in these sizes.
- A significant 42.9% of listings offer 3+ bedrooms, catering to larger groups and families seeking more space in Rue.
Rue Vacation Rental Guest Capacity Trends (2025)
Distribution of Listings by Guest Capacity
Guest Capacity Insights for Rue
- The most common guest capacity trend in Rue vacation rentals is listings accommodating 8+ guests (30.6%). This suggests the primary traveler segment is likely larger groups.
- Properties designed for 8+ guests and 4 guests dominate the Rue STR market, accounting for 49.0% of listings.
- 46.9% of properties accommodate 6+ guests, serving the market segment for larger families or group travel in Rue.
- On average, properties in Rue are equipped to host 4.8 guests.
Rue Airbnb Booking Patterns (2025): Available vs. Booked Days
Available Days Distribution
Booked Days Distribution
Booking Pattern Insights for Rue
- The most common availability pattern in Rue falls within the 271-366 days range, representing 71.4% of listings. This suggests many properties have significant open periods on their calendars.
- Approximately 100.0% of listings show high availability (181+ days open annually), indicating potential for increased bookings or specific owner usage patterns.
- For booked days, the 31-90 days range is most frequent in Rue (55.1%), reflecting common guest stay durations or potential owner blocking patterns.
Rue Airbnb Minimum Stay Requirements Analysis
Distribution of Listings by Minimum Night Requirement
1 Night
9 listings
18.4% of total
2 Nights
26 listings
53.1% of total
4-6 Nights
1 listings
2% of total
7-29 Nights
1 listings
2% of total
30+ Nights
12 listings
24.5% of total
Key Insights
- The most prevalent minimum stay requirement in Rue is 2 Nights, adopted by 53.1% of listings. This highlights the market's preference for shorter, flexible bookings.
- A strong majority (71.5%) of the Rue Airbnb data shows acceptance of very short stays (1-2 nights), indicating a dynamic, high-turnover market.
- A significant segment (24.5%) caters to monthly stays (30+ nights) in Rue, pointing to opportunities in the extended-stay market.
Recommendations
- Align with the market by considering a 2 Nights minimum stay, as 53.1% of Rue hosts use this setting.
- If feasible, allowing 1-night stays, especially midweek or during low season, could capture last-minute bookings, as only 18.4% currently do.
- A 2-night minimum appears standard (53.1%). Consider this for weekends or peak periods.
- Explore offering discounts for stays of 30+ nights to attract the 24.5% of the market seeking extended stays.
- Adjust minimum nights based on seasonality – potentially shorter during low season and longer during peak demand periods in Rue.
Rue Airbnb Cancellation Policy Trends Analysis (2025)
Flexible
9 listings
21.4% of total
Moderate
11 listings
26.2% of total
Firm
10 listings
23.8% of total
Strict
12 listings
28.6% of total
Cancellation Policy Insights for Rue
- The prevailing Airbnb cancellation policy trend in Rue is Strict, used by 28.6% of listings.
- A majority (52.4%) of hosts in Rue utilize Firm or Strict policies, indicating a market where hosts prioritize booking security.
Recommendations for Hosts
- Consider adopting a Strict policy to align with the 28.6% market standard in Rue.
- Regularly review your cancellation policy against competitors and market demand shifts in Rue.
Rue STR Booking Lead Time Analysis (2025)
Average Booking Lead Time by Month
Booking Lead Time Insights for Rue
- The overall average booking lead time for vacation rentals in Rue is 50 days.
- Guests book furthest in advance for stays during May (average 100 days), likely coinciding with peak travel demand or local events.
- The shortest booking windows occur for stays in March (average 28 days), indicating more last-minute travel plans during this time.
- Seasonally, Summer (73 days avg.) sees the longest lead times, while Winter (40 days avg.) has the shortest, reflecting typical travel planning cycles.
Recommendations for Hosts
- Use the overall average lead time (50 days) as a baseline for your pricing and availability strategy in Rue.
- For May stays, consider implementing length-of-stay discounts or slightly higher rates for bookings made less than 100 days out to capitalize on advance planning.
- Target marketing efforts for the Summer season well in advance (at least 73 days) to capture early planners.
- Monitor your own booking lead times against these Rue averages to identify opportunities for dynamic pricing adjustments.
Popular & Essential Airbnb Amenities in Rue (2025)
Amenity Prevalence
Amenity Insights for Rue
- Popular amenities like Hot water, Heating, TV are common but not universal. Offering these can provide a competitive edge.
- Warning: Wifi is not universally provided but is considered essential globally. Ensure reliable Wifi is offered.
Recommendations for Hosts
- Consider adding popular differentiators like Hot water or Heating to increase appeal.
- Highlight unique or less common amenities you offer (e.g., hot tub, dedicated workspace, EV charger) in your listing description and photos.
- Regularly check competitor amenities in Rue to stay competitive.
Rue Airbnb Guest Demographics & Profile Analysis (2025)
Guest Profile Summary for Rue
- The typical guest profile for Airbnb in Rue consists of primarily domestic travelers (84%), often arriving from nearby Paris, typically belonging to the Post-2000s (Gen Z/Alpha) group (50%), primarily speaking French or English.
- Domestic travelers account for 84.4% of guests.
- Key international markets include France (84.4%) and Belgium (9.3%).
- Top languages spoken are French (48.8%) followed by English (35.1%).
- A significant demographic segment is the Post-2000s (Gen Z/Alpha) group, representing 50% of guests.
Recommendations for Hosts
- Target domestic marketing efforts towards travelers from Paris and Lille.
- Tailor amenities and listing descriptions to appeal to the dominant Post-2000s (Gen Z/Alpha) demographic (e.g., highlight fast WiFi, smart home features, local guides).
- Highlight unique local experiences or amenities relevant to the primary guest profile.
- Consider seasonal promotions aligned with peak travel times for key origin markets.
Nearby Short-Term Rental Market Comparison
How does the Rue Airbnb market stack up against its neighbors? Compare key performance metrics like average monthly revenue, ADR, and occupancy rates in surrounding areas to understand the broader regional STR landscape.
| Market | Active Properties | Monthly Revenue | Daily Rate | Avg. Occupancy |
|---|---|---|---|---|
| Lo-Reninge | 12 | $6,193 | $432.10 | 49% |
| Morienval | 10 | $5,794 | $400.84 | 32% |
| La Poterie-Cap-d'Antifer | 11 | $5,076 | $293.95 | 55% |
| Bonneville-sur-Touques | 16 | $3,903 | $367.00 | 40% |
| Luneray | 12 | $3,745 | $526.24 | 42% |
| Rosoy-en-Multien | 15 | $3,558 | $367.61 | 51% |
| Saint-Étienne-la-Thillaye | 24 | $3,459 | $325.89 | 42% |
| Cricquebœuf | 10 | $3,417 | $268.29 | 46% |
| Caumont | 11 | $3,350 | $286.17 | 49% |
| Sevenoaks | 168 | $3,040 | $271.64 | 44% |