Rang-du-Fliers Airbnb Market Analysis 2025: Short Term Rental Data & Vacation Rental Statistics in Hauts-de-France, France
Is Airbnb profitable in Rang-du-Fliers in 2025? Explore comprehensive Airbnb analytics for Rang-du-Fliers, Hauts-de-France, France to uncover income potential. This 2025 STR market report for Rang-du-Fliers, based on AirROI data from April 2024 to March 2025, reveals key trends in the niche market of 25 active listings.
Whether you're considering an Airbnb investment in Rang-du-Fliers, optimizing your existing vacation rental, or exploring rental arbitrage opportunities, understanding the Rang-du-Fliers Airbnb data is crucial. Leveraging the low regulation environment is key to maximizing your short term rental income potential. Let's dive into the specifics.
Key Rang-du-Fliers Airbnb Performance Metrics Overview
Monthly Airbnb Revenue Variations & Income Potential in Rang-du-Fliers (2025)
Understanding the monthly revenue variations for Airbnb listings in Rang-du-Fliers is key to maximizing your short term rental income potential. Seasonality significantly impacts earnings. Our analysis, based on data from the past 12 months, shows that the peak revenue month for STRs in Rang-du-Fliers is typically August, while January often presents the lowest earnings, highlighting opportunities for strategic pricing adjustments during shoulder and low seasons. Explore the typical Airbnb income in Rang-du-Fliers across different performance tiers:
- Best-in-class properties (Top 10%) achieve $4,023+ monthly, often utilizing dynamic pricing and superior guest experiences.
- Strong performing properties (Top 25%) earn $2,594 or more, indicating effective management and desirable locations/amenities.
- Typical properties (Median) generate around $1,701 per month, representing the average market performance.
- Entry-level properties (Bottom 25%) see earnings around $1,146, often with potential for optimization.
Average Monthly Airbnb Earnings Trend in Rang-du-Fliers
Rang-du-Fliers Airbnb Occupancy Rate Trends (2025)
Maximize your bookings by understanding the Rang-du-Fliers STR occupancy trends. Seasonal demand shifts significantly influence how often properties are booked. Typically, Julysees the highest demand (peak season occupancy), while January experiences the lowest (low season). Effective strategies, like adjusting minimum stays or offering promotions, can boost occupancy during slower periods. Here's how different property tiers perform in Rang-du-Fliers:
- Best-in-class properties (Top 10%) achieve 79%+ occupancy, indicating high desirability and potentially optimized availability.
- Strong performing properties (Top 25%) maintain 71% or higher occupancy, suggesting good market fit and guest satisfaction.
- Typical properties (Median) have an occupancy rate around 57%.
- Entry-level properties (Bottom 25%) average 37% occupancy, potentially facing higher vacancy.
Average Monthly Occupancy Rate Trend in Rang-du-Fliers
Average Daily Rate (ADR) Airbnb Trends in Rang-du-Fliers (2025)
Effective short term rental pricing strategy in Rang-du-Fliers involves understanding monthly ADR fluctuations. The Average Daily Rate (ADR) for Airbnb in Rang-du-Fliers typically peaks in July and dips lowest during March. Leveraging Airbnb dynamic pricing tools or strategies based on this seasonality can significantly boost revenue. Here's a look at the typical nightly rates achieved:
- Best-in-class properties (Top 10%) command rates of $204+ per night, often due to premium features or locations.
- Strong performing properties (Top 25%) achieve nightly rates of $120 or more.
- Typical properties (Median) charge around $88 per night.
- Entry-level properties (Bottom 25%) earn around $75 per night.
Average Daily Rate (ADR) Trend by Month in Rang-du-Fliers
Get Live Rang-du-Fliers Market Intelligence 👇

Explore Real-time Analytics
Airbnb Seasonality Analysis & Trends in Rang-du-Fliers (2025)
Peak Season (August, June, May)
- Revenue averages $2,771 per month
- Occupancy rates average 62.3%
- Daily rates average $127
Shoulder Season
- Revenue averages $2,104 per month
- Occupancy maintains around 56.0%
- Daily rates hold near $121
Low Season (January, March, November)
- Revenue drops to average $1,222 per month
- Occupancy decreases to average 34.9%
- Daily rates adjust to average $109
Seasonality Insights for Rang-du-Fliers
- The Airbnb seasonality in Rang-du-Fliers shows highly seasonal trends requiring careful strategy. While the sections above show seasonal averages, it's also insightful to look at the extremes:
- During the high season, the absolute peak month showcases Rang-du-Fliers's highest earning potential, with monthly revenues capable of climbing to $2,862, occupancy reaching a high of 70.1%, and ADRs peaking at $129.
- Conversely, the slowest single month of the year, typically falling within the low season, marks the market's lowest point. In this month, revenue might dip to $1,177, occupancy could drop to 28.2%, and ADRs may adjust down to $108.
- Understanding both the seasonal averages and these monthly peaks and troughs in revenue, occupancy, and ADR is crucial for maximizing your Airbnb profit potential in Rang-du-Fliers.
Seasonal Strategies for Maximizing Profit
- Peak Season: Maximize revenue through premium pricing and potentially longer minimum stays. Ensure high availability.
- Low Season: Offer competitive pricing, special promotions (e.g., extended stay discounts), and flexible cancellation policies. Target off-season travelers like remote workers or budget-conscious guests.
- Shoulder Seasons: Implement dynamic pricing that balances peak and low rates. Target weekend travelers or specific events. Offer slightly more flexible terms than peak season.
- Regularly analyze your own performance against these Rang-du-Fliers seasonality benchmarks and adjust your pricing and availability strategy accordingly.
Best Areas for Airbnb Investment in Rang-du-Fliers (2025)
Exploring the top neighborhoods for short-term rentals in Rang-du-Fliers? This section highlights key areas, outlining why they are attractive for hosts and guests, along with notable local attractions. Consider these locations based on your target guest profile and investment strategy.
| Neighborhood / Area | Why Host Here? (Target Guests & Appeal) | Key Attractions & Landmarks |
|---|---|---|
| Rang-du-Fliers Beach | Popular for its sandy shores and proximity to the sea, making it a favorite for families and tourists. Offers beach access and various water activities. | Rang-du-Fliers Beach, La Baie de Rang-du-Fliers, Water sports facilities, Beachfront restaurants, Local markets |
| Le Touquet | A short drive from Rang-du-Fliers, known for its upscale atmosphere, charming town center, and beach activities. It's a premium spot for tourists desiring luxury and leisure. | Le Touquet Beach, Rue Saint-Jean, Golf courses, Casino de Le Touquet, Aquarium |
| Berck-sur-Mer | A neighboring seaside resort that attracts visitors with its vast beach and family-friendly activities. Great for rental properties geared towards families and beach lovers. | Berck-sur-Mer Beach, Berck Kite Festival, Aquaclub, Nature parks, Promenade |
| Montreuil-sur-Mer | A historic town offering a glimpse of medieval architecture and local culture. Popular among tourists interested in history and quaint town experiences. | Montreuil Citadel, Belfry of Montreuil, Local markets, Art galleries, St. Saulve Church |
| Le Crotoy | A picturesque fishing village known for its scenic coastline and access to Somme Bay. Attracts nature lovers and those looking for a peaceful getaway. | Le Crotoy Beach, Bay of Somme, Nature reserves, Local seafood restaurants, Birdwatching |
| Fort-Mahon-Plage | Known for its large sandy beach and family-friendly attractions. A great spot for renting during the vacation season, especially in summer. | Fort-Mahon Beach, Family amusement parks, Sand dunes, Kayaking, Cycling paths |
| Cayeux-sur-Mer | A charming coastal town with a unique pebble beach and a laid-back atmosphere, appealing to those seeking a relaxing seaside vacation. | Cayeux-sur-Mer Beach, Cliffs of Cayeux, Promenade, Local seafood cuisine, Nature walks |
| Quend-Plage | A lovely coastal resort famous for its long, clean beaches, attractive to families and beachgoers, with many amenities for tourists. | Quend-Plage Beach, Dune parks, Water sports, Beach bars, Walking trails |
Understanding Airbnb License Requirements & STR Laws in Rang-du-Fliers (2025)
While Rang-du-Fliers, Hauts-de-France, France currently shows low STR regulations, specific Airbnb license requirements might still exist or change. Always verify the latest short term rental regulations and Airbnb license requirements directly with local government authorities for Rang-du-Fliers to ensure full compliance before hosting.
(Source: AirROI data, 2025, finding no licensed listings among those analyzed)
Top Performing Airbnb Properties in Rang-du-Fliers (2025)
Benchmark your potential! Explore examples of top-performing Airbnb properties in Rang-du-Fliersbased on Trailing Twelve Month (TTM) revenue. Analyze their characteristics, revenue, occupancy rate, and ADR to understand what drives success in this market.
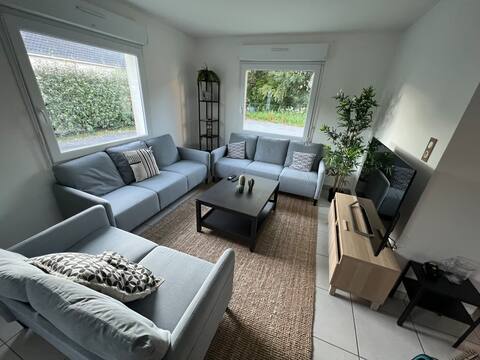
House tt conf, 10 pers, 4 bedrooms, 7 beds, 2 bathrooms, 2 toilets
Entire Place • 4 bedrooms
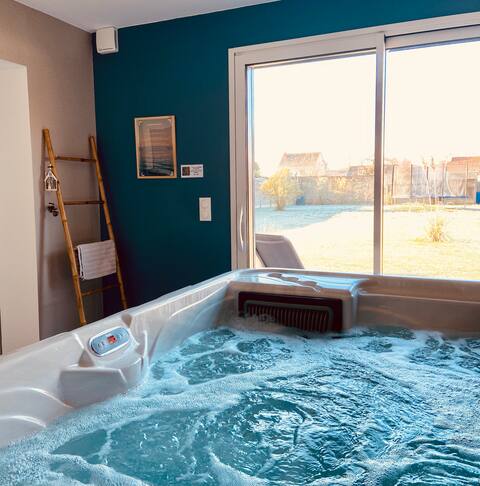
4* modern & warm house, spa and garden
Entire Place • 2 bedrooms
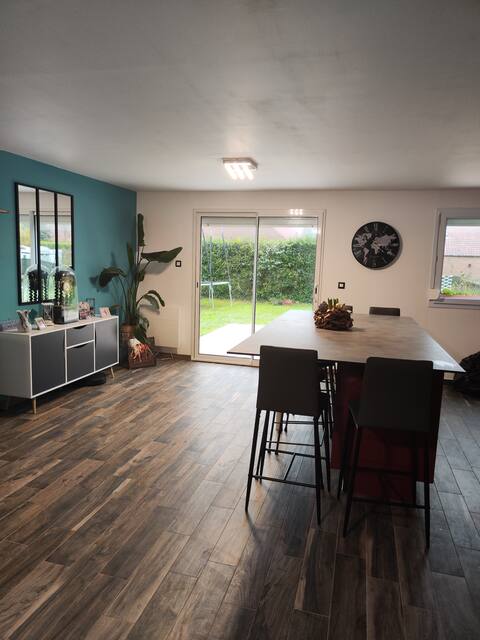
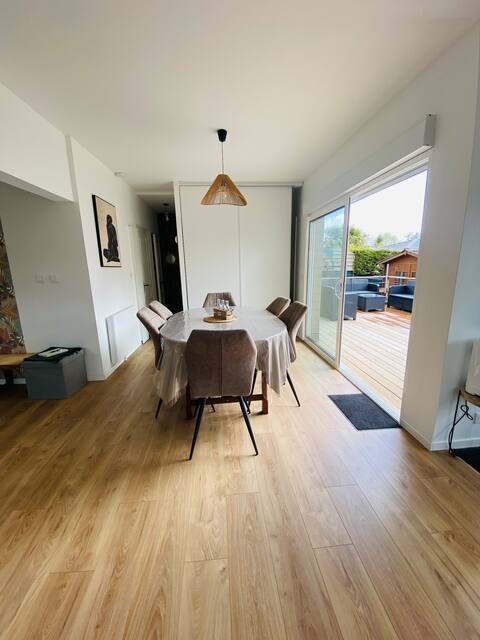
Maison moderne à deux pas de Berck et du Touquet
Entire Place • 4 bedrooms
70m2 welcoming cottage with free parking
Entire Place • 2 bedrooms
Joli Chalet cosy, tout confort
Entire Place • N/A
Le gîte du jardin du Fliers
Entire Place • 2 bedrooms
Note: Performance varies based on location, size, amenities, seasonality, and management quality. Data reflects the past 12 months.
Top Performing Airbnb Hosts in Rang-du-Fliers (2025)
Learn from the best! This table showcases top-performing Airbnb hosts in Rang-du-Fliers based on the number of properties managed and estimated total revenue over the past year. Analyze their scale and performance metrics.
| Host Name | Properties | Grossing Revenue | Stay Reviews | Avg Rating |
|---|---|---|---|---|
| Hubert-Olivier | 1 | $56,982 | 40 | 4.95/5.0 |
| Sandra | 3 | $56,431 | 516 | 4.93/5.0 |
| Sweet Opalia | 1 | $43,755 | 74 | 4.96/5.0 |
| Host #249638605 | 1 | $40,514 | 6 | 4.83/5.0 |
| Hanna | 1 | $29,374 | 26 | 4.88/5.0 |
| Kaira | 1 | $24,937 | 137 | 4.99/5.0 |
| Noemie | 1 | $23,591 | 46 | 4.98/5.0 |
| Host #389049946 | 1 | $22,981 | 5 | 5.00/5.0 |
| Host #495543463 | 1 | $18,689 | 7 | 4.86/5.0 |
| Didier | 1 | $18,071 | 184 | 4.95/5.0 |
Analyzing the strategies of top hosts, such as their property selection, pricing, and guest communication, can offer valuable lessons for optimizing your own Airbnb operations in Rang-du-Fliers.
Dive Deeper: Advanced Rang-du-Fliers STR Market Data (2025)
Ready to unlock more insights? AirROI provides access to advanced metrics and comprehensive Airbnb data for Rang-du-Fliers. Explore detailed analytics beyond this report to refine your investment strategy, optimize pricing, and maximize your vacation rental profits.
Explore Advanced MetricsRang-du-Fliers Short-Term Rental Market Composition (2025): Property & Room Types
Room Type Distribution
Property Type Distribution
Market Composition Insights for Rang-du-Fliers
- The Rang-du-Fliers Airbnb market composition is heavily skewed towards Entire Home/Apt listings, which make up 96% of the 25 active rentals. This indicates strong guest preference for privacy and space.
- Looking at the property type distribution in Rang-du-Fliers, House properties are the most common (80%), reflecting the local real estate landscape.
- Houses represent a significant 80% portion, catering likely to families or larger groups.
- Smaller segments like hotel/boutique, others, outdoor/unique (combined 12.0%) offer potential for unique stay experiences.
Rang-du-Fliers Airbnb Room Capacity Analysis (2025): Bedroom Distribution
Distribution of Listings by Number of Bedrooms
Room Capacity Insights for Rang-du-Fliers
- The dominant room capacity in Rang-du-Fliers is 2 bedrooms listings, making up 40% of the market. This suggests a strong demand for properties suitable for couples or solo travelers.
- Together, 2 bedrooms and 3 bedrooms properties represent 64.0% of the active Airbnb listings in Rang-du-Fliers, indicating a high concentration in these sizes.
- A significant 36.0% of listings offer 3+ bedrooms, catering to larger groups and families seeking more space in Rang-du-Fliers.
Rang-du-Fliers Vacation Rental Guest Capacity Trends (2025)
Distribution of Listings by Guest Capacity
Guest Capacity Insights for Rang-du-Fliers
- The most common guest capacity trend in Rang-du-Fliers vacation rentals is listings accommodating 4 guests (36%). This suggests the primary traveler segment is likely small families or groups.
- Properties designed for 4 guests and 6 guests dominate the Rang-du-Fliers STR market, accounting for 52.0% of listings.
- 32.0% of properties accommodate 6+ guests, serving the market segment for larger families or group travel in Rang-du-Fliers.
- On average, properties in Rang-du-Fliers are equipped to host 4.7 guests.
Rang-du-Fliers Airbnb Booking Patterns (2025): Available vs. Booked Days
Available Days Distribution
Booked Days Distribution
Booking Pattern Insights for Rang-du-Fliers
- The most common availability pattern in Rang-du-Fliers falls within the 91-180 days range, representing 44% of listings. This suggests many properties have significant open periods on their calendars.
- Approximately 48.0% of listings show high availability (181+ days open annually), indicating potential for increased bookings or specific owner usage patterns.
- For booked days, the 181-270 days range is most frequent in Rang-du-Fliers (44%), reflecting common guest stay durations or potential owner blocking patterns.
- A notable 52.0% of properties secure long booking periods (181+ days booked per year), highlighting successful long-term rental strategies or significant owner usage.
Rang-du-Fliers Airbnb Minimum Stay Requirements Analysis
Distribution of Listings by Minimum Night Requirement
1 Night
8 listings
36.4% of total
2 Nights
7 listings
31.8% of total
4-6 Nights
1 listings
4.5% of total
7-29 Nights
3 listings
13.6% of total
30+ Nights
3 listings
13.6% of total
Key Insights
- The most prevalent minimum stay requirement in Rang-du-Fliers is 1 Night, adopted by 36.4% of listings. This highlights the market's preference for shorter, flexible bookings.
- A strong majority (68.2%) of the Rang-du-Fliers Airbnb data shows acceptance of very short stays (1-2 nights), indicating a dynamic, high-turnover market.
- A significant segment (13.6%) caters to monthly stays (30+ nights) in Rang-du-Fliers, pointing to opportunities in the extended-stay market.
Recommendations
- Align with the market by considering a 1 Night minimum stay, as 36.4% of Rang-du-Fliers hosts use this setting.
- Explore offering discounts for stays of 30+ nights to attract the 13.6% of the market seeking extended stays.
- Adjust minimum nights based on seasonality – potentially shorter during low season and longer during peak demand periods in Rang-du-Fliers.
Rang-du-Fliers Airbnb Cancellation Policy Trends Analysis (2025)
Flexible
6 listings
31.6% of total
Moderate
4 listings
21.1% of total
Firm
7 listings
36.8% of total
Strict
2 listings
10.5% of total
Cancellation Policy Insights for Rang-du-Fliers
- The prevailing Airbnb cancellation policy trend in Rang-du-Fliers is Firm, used by 36.8% of listings.
- There's a relatively balanced mix between guest-friendly (52.7%) and stricter (47.3%) policies, offering choices for different guest needs.
Recommendations for Hosts
- Consider adopting a Firm policy to align with the 36.8% market standard in Rang-du-Fliers.
- Using a Strict policy might deter some guests, as only 10.5% of listings use it. Evaluate if potential revenue protection outweighs possible lower booking rates.
- Regularly review your cancellation policy against competitors and market demand shifts in Rang-du-Fliers.
Rang-du-Fliers STR Booking Lead Time Analysis (2025)
Average Booking Lead Time by Month
Booking Lead Time Insights for Rang-du-Fliers
- The overall average booking lead time for vacation rentals in Rang-du-Fliers is 44 days.
- Guests book furthest in advance for stays during June (average 95 days), likely coinciding with peak travel demand or local events.
- The shortest booking windows occur for stays in November (average 19 days), indicating more last-minute travel plans during this time.
- Seasonally, Spring (69 days avg.) sees the longest lead times, while Fall (36 days avg.) has the shortest, reflecting typical travel planning cycles.
Recommendations for Hosts
- Use the overall average lead time (44 days) as a baseline for your pricing and availability strategy in Rang-du-Fliers.
- For June stays, consider implementing length-of-stay discounts or slightly higher rates for bookings made less than 95 days out to capitalize on advance planning.
- Target marketing efforts for the Spring season well in advance (at least 69 days) to capture early planners.
- Monitor your own booking lead times against these Rang-du-Fliers averages to identify opportunities for dynamic pricing adjustments.
Popular & Essential Airbnb Amenities in Rang-du-Fliers (2025)
Amenity Prevalence
Amenity Insights for Rang-du-Fliers
- Essential amenities in Rang-du-Fliers that guests expect include: Free parking on premises, Hot water, Kitchen. Lacking these (any) could significantly impact bookings.
- Popular amenities like TV, Heating, Smoke alarm are common but not universal. Offering these can provide a competitive edge.
Recommendations for Hosts
- Ensure your listing includes all essential amenities for Rang-du-Fliers: Free parking on premises, Hot water, Kitchen.
- Prioritize adding missing essentials: Hot water, Kitchen.
- Consider adding popular differentiators like TV or Heating to increase appeal.
- Highlight unique or less common amenities you offer (e.g., hot tub, dedicated workspace, EV charger) in your listing description and photos.
- Regularly check competitor amenities in Rang-du-Fliers to stay competitive.
Rang-du-Fliers Airbnb Guest Demographics & Profile Analysis (2025)
Guest Profile Summary for Rang-du-Fliers
- The typical guest profile for Airbnb in Rang-du-Fliers consists of primarily domestic travelers (83%), often arriving from nearby Lille, typically belonging to the Post-2000s (Gen Z/Alpha) group (50%), primarily speaking French or English.
- Domestic travelers account for 83.4% of guests.
- Key international markets include France (83.4%) and Belgium (7.6%).
- Top languages spoken are French (47.4%) followed by English (30.3%).
- A significant demographic segment is the Post-2000s (Gen Z/Alpha) group, representing 50% of guests.
Recommendations for Hosts
- Target domestic marketing efforts towards travelers from Lille and Paris.
- Tailor amenities and listing descriptions to appeal to the dominant Post-2000s (Gen Z/Alpha) demographic (e.g., highlight fast WiFi, smart home features, local guides).
- Highlight unique local experiences or amenities relevant to the primary guest profile.
- Consider seasonal promotions aligned with peak travel times for key origin markets.
Nearby Short-Term Rental Market Comparison
How does the Rang-du-Fliers Airbnb market stack up against its neighbors? Compare key performance metrics like average monthly revenue, ADR, and occupancy rates in surrounding areas to understand the broader regional STR landscape.
| Market | Active Properties | Monthly Revenue | Daily Rate | Avg. Occupancy |
|---|---|---|---|---|
| Lo-Reninge | 12 | $6,193 | $432.10 | 49% |
| Morienval | 10 | $5,794 | $400.84 | 32% |
| La Poterie-Cap-d'Antifer | 11 | $5,076 | $293.95 | 55% |
| Bonneville-sur-Touques | 16 | $3,903 | $367.00 | 40% |
| Luneray | 12 | $3,745 | $526.24 | 42% |
| Rosoy-en-Multien | 15 | $3,558 | $367.61 | 51% |
| Saint-Étienne-la-Thillaye | 24 | $3,459 | $325.89 | 42% |
| Cricquebœuf | 10 | $3,417 | $268.29 | 46% |
| Caumont | 11 | $3,350 | $286.17 | 49% |
| Sevenoaks | 168 | $3,040 | $271.64 | 44% |