Merlimont Airbnb Market Analysis 2025: Short Term Rental Data & Vacation Rental Statistics in Hauts-de-France, France
Is Airbnb profitable in Merlimont in 2025? Explore comprehensive Airbnb analytics for Merlimont, Hauts-de-France, France to uncover income potential. This 2025 STR market report for Merlimont, based on AirROI data from April 2024 to March 2025, reveals key trends in the niche market of 151 active listings.
Whether you're considering an Airbnb investment in Merlimont, optimizing your existing vacation rental, or exploring rental arbitrage opportunities, understanding the Merlimont Airbnb data is crucial. Leveraging the low regulation environment is key to maximizing your short term rental income potential. Let's dive into the specifics.
Key Merlimont Airbnb Performance Metrics Overview
Monthly Airbnb Revenue Variations & Income Potential in Merlimont (2025)
Understanding the monthly revenue variations for Airbnb listings in Merlimont is key to maximizing your short term rental income potential. Seasonality significantly impacts earnings. Our analysis, based on data from the past 12 months, shows that the peak revenue month for STRs in Merlimont is typically August, while January often presents the lowest earnings, highlighting opportunities for strategic pricing adjustments during shoulder and low seasons. Explore the typical Airbnb income in Merlimont across different performance tiers:
- Best-in-class properties (Top 10%) achieve $3,104+ monthly, often utilizing dynamic pricing and superior guest experiences.
- Strong performing properties (Top 25%) earn $2,254 or more, indicating effective management and desirable locations/amenities.
- Typical properties (Median) generate around $1,435 per month, representing the average market performance.
- Entry-level properties (Bottom 25%) see earnings around $830, often with potential for optimization.
Average Monthly Airbnb Earnings Trend in Merlimont
Merlimont Airbnb Occupancy Rate Trends (2025)
Maximize your bookings by understanding the Merlimont STR occupancy trends. Seasonal demand shifts significantly influence how often properties are booked. Typically, Augustsees the highest demand (peak season occupancy), while January experiences the lowest (low season). Effective strategies, like adjusting minimum stays or offering promotions, can boost occupancy during slower periods. Here's how different property tiers perform in Merlimont:
- Best-in-class properties (Top 10%) achieve 73%+ occupancy, indicating high desirability and potentially optimized availability.
- Strong performing properties (Top 25%) maintain 56% or higher occupancy, suggesting good market fit and guest satisfaction.
- Typical properties (Median) have an occupancy rate around 37%.
- Entry-level properties (Bottom 25%) average 22% occupancy, potentially facing higher vacancy.
Average Monthly Occupancy Rate Trend in Merlimont
Average Daily Rate (ADR) Airbnb Trends in Merlimont (2025)
Effective short term rental pricing strategy in Merlimont involves understanding monthly ADR fluctuations. The Average Daily Rate (ADR) for Airbnb in Merlimont typically peaks in August and dips lowest during March. Leveraging Airbnb dynamic pricing tools or strategies based on this seasonality can significantly boost revenue. Here's a look at the typical nightly rates achieved:
- Best-in-class properties (Top 10%) command rates of $199+ per night, often due to premium features or locations.
- Strong performing properties (Top 25%) achieve nightly rates of $135 or more.
- Typical properties (Median) charge around $105 per night.
- Entry-level properties (Bottom 25%) earn around $85 per night.
Average Daily Rate (ADR) Trend by Month in Merlimont
Get Live Merlimont Market Intelligence 👇

Explore Real-time Analytics
Airbnb Seasonality Analysis & Trends in Merlimont (2025)
Peak Season (August, July, May)
- Revenue averages $2,749 per month
- Occupancy rates average 61.5%
- Daily rates average $128
Shoulder Season
- Revenue averages $1,553 per month
- Occupancy maintains around 36.1%
- Daily rates hold near $122
Low Season (January, February, March)
- Revenue drops to average $903 per month
- Occupancy decreases to average 26.2%
- Daily rates adjust to average $119
Seasonality Insights for Merlimont
- The Airbnb seasonality in Merlimont shows highly seasonal trends requiring careful strategy. While the sections above show seasonal averages, it's also insightful to look at the extremes:
- During the high season, the absolute peak month showcases Merlimont's highest earning potential, with monthly revenues capable of climbing to $3,171, occupancy reaching a high of 72.7%, and ADRs peaking at $131.
- Conversely, the slowest single month of the year, typically falling within the low season, marks the market's lowest point. In this month, revenue might dip to $867, occupancy could drop to 22.7%, and ADRs may adjust down to $117.
- Understanding both the seasonal averages and these monthly peaks and troughs in revenue, occupancy, and ADR is crucial for maximizing your Airbnb profit potential in Merlimont.
Seasonal Strategies for Maximizing Profit
- Peak Season: Maximize revenue through premium pricing and potentially longer minimum stays. Ensure high availability.
- Low Season: Offer competitive pricing, special promotions (e.g., extended stay discounts), and flexible cancellation policies. Target off-season travelers like remote workers or budget-conscious guests.
- Shoulder Seasons: Implement dynamic pricing that balances peak and low rates. Target weekend travelers or specific events. Offer slightly more flexible terms than peak season.
- Regularly analyze your own performance against these Merlimont seasonality benchmarks and adjust your pricing and availability strategy accordingly.
Best Areas for Airbnb Investment in Merlimont (2025)
Exploring the top neighborhoods for short-term rentals in Merlimont? This section highlights key areas, outlining why they are attractive for hosts and guests, along with notable local attractions. Consider these locations based on your target guest profile and investment strategy.
| Neighborhood / Area | Why Host Here? (Target Guests & Appeal) | Key Attractions & Landmarks |
|---|---|---|
| Merlimont Plage | A charming coastal area known for its sandy beaches and family-friendly atmosphere. Ideal for beachgoers and families looking for a relaxing vacation by the sea. | Merlimont Beach, Les Jardins de la Mer, Dune Walks, Local seafood restaurants, Water sports activities, Cycle paths along the coastline |
| Le Touquet-Paris-Plage | Nearby glamorous beach town famous for its elegant architecture and upscale shopping. Draws tourists for its lively beach and array of cultural events throughout the year. | Le Touquet Beach, Le Touquet Golf Club, Shopping on Rue Saint-Jean, Water sports and activities, Local market, Art and cultural festivals |
| Berck-sur-Mer | Another coastal gem known for its vast sandy beaches and vibrant beachfront. Suitable for families and adventure seekers looking for outdoor activities and unique experiences. | Berck Beach, Parc Bagatelle, Berck Kite Festival, Seafront promenade, Boat rentals, Local eateries |
| Montreuil-sur-Mer | A historic town with well-preserved ramparts and a medieval feel. Attracts history buffs and those seeking a more cultured holiday with easy access to natural beauty. | Montreuil Fortifications, St. Saulve Church, Art galleries, Local restaurants, Nature walks, French markets |
| Côte d'Opale | The Opal Coast region offers breathtaking natural landscapes, dunes, and cliffs, perfect for nature lovers and outdoor enthusiasts seeking scenic getaways. | Cap Griz Nez, Cap Blanc Nez, Hiking trails, Nature reserves, Biking paths, Views of the English Channel |
| Loon-Plage | A less crowded option near the coast, suitable for travelers looking for a peaceful retreat with access to both nature and local culture. | Local parks, Seaside paths, Biking trails, Cozy cafes, Cultural sites, Fishing spots |
| Stella-Plage | A seaside resort with a relaxed atmosphere, perfect for those wanting to enjoy the tranquility of the beach and local festivals. | Stella Beach, Boardwalks, Lively summer events, Family friendly attractions, Beachfront cafes, Nature activities |
| Arras | Though slightly inland, Arras is known for its rich history and stunning architecture. Ideal for travelers interested in exploring northern France's history and culture. | Arras Main Square, Belfry of Arras, Beaux-Arts Museum, Historic battlefields, Local festivals, French cuisine experiences |
Understanding Airbnb License Requirements & STR Laws in Merlimont (2025)
While Merlimont, Hauts-de-France, France currently shows low STR regulations, specific Airbnb license requirements might still exist or change. Always verify the latest short term rental regulations and Airbnb license requirements directly with local government authorities for Merlimont to ensure full compliance before hosting.
(Source: AirROI data, 2025, based on 7% licensed listings)
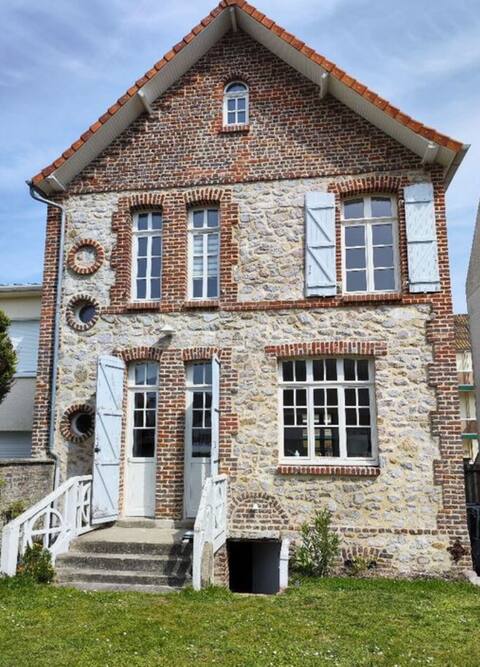
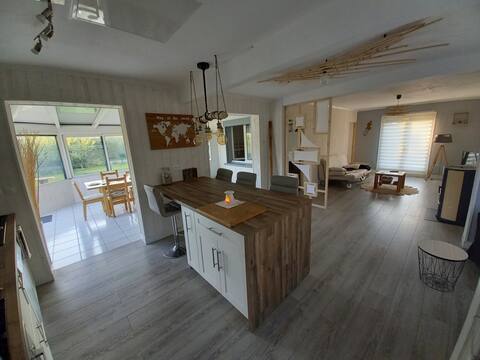
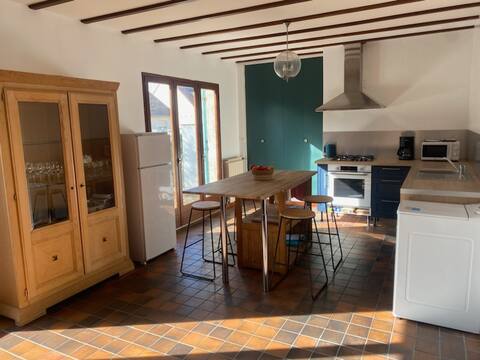
Top Performing Airbnb Properties in Merlimont (2025)
Benchmark your potential! Explore examples of top-performing Airbnb properties in Merlimontbased on Trailing Twelve Month (TTM) revenue. Analyze their characteristics, revenue, occupancy rate, and ADR to understand what drives success in this market.

"TIKI" beachfront house Ranked 4 Stars
Entire Place • 4 bedrooms
Charming family home
Entire Place • 3 bedrooms
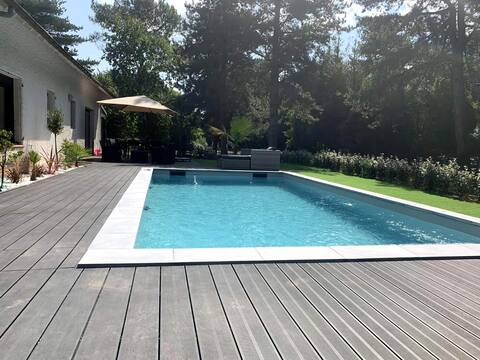
villa with swimming pool
Entire Place • 5 bedrooms
5 bedroom villa between beach and forest
Entire Place • 5 bedrooms
Merlimont house rental 6 people
Entire Place • 2 bedrooms
Merlimont House 120m2 - 10 pers
Entire Place • 5 bedrooms
Note: Performance varies based on location, size, amenities, seasonality, and management quality. Data reflects the past 12 months.
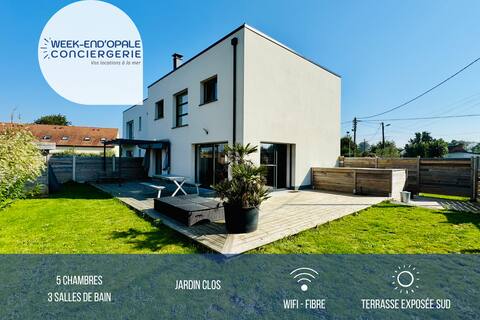
Top Performing Airbnb Hosts in Merlimont (2025)
Learn from the best! This table showcases top-performing Airbnb hosts in Merlimont based on the number of properties managed and estimated total revenue over the past year. Analyze their scale and performance metrics.
| Host Name | Properties | Grossing Revenue | Stay Reviews | Avg Rating |
|---|---|---|---|---|
| Week-End'Opale | 10 | $214,537 | 242 | 4.15/5.0 |
| Virginie | 4 | $112,627 | 297 | 4.58/5.0 |
| Olivier | 1 | $79,607 | 196 | 4.89/5.0 |
| Fabien | 4 | $65,150 | 322 | 4.86/5.0 |
| Julie | 1 | $62,706 | 11 | 4.91/5.0 |
| Virginie | 2 | $49,768 | 205 | 4.83/5.0 |
| Florent | 1 | $49,711 | 42 | 4.64/5.0 |
| Isabelle | 4 | $47,077 | 238 | 4.66/5.0 |
| Clemence | 2 | $41,730 | 51 | 4.99/5.0 |
| Lherbier | 2 | $41,424 | 96 | 4.80/5.0 |
Analyzing the strategies of top hosts, such as their property selection, pricing, and guest communication, can offer valuable lessons for optimizing your own Airbnb operations in Merlimont.
Dive Deeper: Advanced Merlimont STR Market Data (2025)
Ready to unlock more insights? AirROI provides access to advanced metrics and comprehensive Airbnb data for Merlimont. Explore detailed analytics beyond this report to refine your investment strategy, optimize pricing, and maximize your vacation rental profits.
Explore Advanced MetricsMerlimont Short-Term Rental Market Composition (2025): Property & Room Types
Room Type Distribution
Property Type Distribution
Market Composition Insights for Merlimont
- The Merlimont Airbnb market composition is heavily skewed towards Entire Home/Apt listings, which make up 92.1% of the 151 active rentals. This indicates strong guest preference for privacy and space.
- Looking at the property type distribution in Merlimont, House properties are the most common (45.7%), reflecting the local real estate landscape.
- Houses represent a significant 45.7% portion, catering likely to families or larger groups.
- The presence of 7.9% Hotel/Boutique listings indicates integration with traditional hospitality.
- Smaller segments like others, outdoor/unique (combined 1.4%) offer potential for unique stay experiences.
Merlimont Airbnb Room Capacity Analysis (2025): Bedroom Distribution
Distribution of Listings by Number of Bedrooms
Room Capacity Insights for Merlimont
- The dominant room capacity in Merlimont is 2 bedrooms listings, making up 36.4% of the market. This suggests a strong demand for properties suitable for couples or solo travelers.
- Together, 2 bedrooms and 1 bedroom properties represent 65.5% of the active Airbnb listings in Merlimont, indicating a high concentration in these sizes.
- A significant 25.2% of listings offer 3+ bedrooms, catering to larger groups and families seeking more space in Merlimont.
Merlimont Vacation Rental Guest Capacity Trends (2025)
Distribution of Listings by Guest Capacity
Guest Capacity Insights for Merlimont
- The most common guest capacity trend in Merlimont vacation rentals is listings accommodating 4 guests (39.7%). This suggests the primary traveler segment is likely small families or groups.
- Properties designed for 4 guests and 6 guests dominate the Merlimont STR market, accounting for 54.9% of listings.
- 30.4% of properties accommodate 6+ guests, serving the market segment for larger families or group travel in Merlimont.
- On average, properties in Merlimont are equipped to host 4.4 guests.
Merlimont Airbnb Booking Patterns (2025): Available vs. Booked Days
Available Days Distribution
Booked Days Distribution
Booking Pattern Insights for Merlimont
- The most common availability pattern in Merlimont falls within the 181-270 days range, representing 39.1% of listings. This suggests many properties have significant open periods on their calendars.
- Approximately 74.2% of listings show high availability (181+ days open annually), indicating potential for increased bookings or specific owner usage patterns.
- For booked days, the 91-180 days range is most frequent in Merlimont (41.1%), reflecting common guest stay durations or potential owner blocking patterns.
- A notable 25.8% of properties secure long booking periods (181+ days booked per year), highlighting successful long-term rental strategies or significant owner usage.
Merlimont Airbnb Minimum Stay Requirements Analysis
Distribution of Listings by Minimum Night Requirement
1 Night
27 listings
18.1% of total
2 Nights
78 listings
52.3% of total
3 Nights
17 listings
11.4% of total
4-6 Nights
10 listings
6.7% of total
7-29 Nights
5 listings
3.4% of total
30+ Nights
12 listings
8.1% of total
Key Insights
- The most prevalent minimum stay requirement in Merlimont is 2 Nights, adopted by 52.3% of listings. This highlights the market's preference for shorter, flexible bookings.
- A strong majority (70.4%) of the Merlimont Airbnb data shows acceptance of very short stays (1-2 nights), indicating a dynamic, high-turnover market.
Recommendations
- Align with the market by considering a 2 Nights minimum stay, as 52.3% of Merlimont hosts use this setting.
- If feasible, allowing 1-night stays, especially midweek or during low season, could capture last-minute bookings, as only 18.1% currently do.
- A 2-night minimum appears standard (52.3%). Consider this for weekends or peak periods.
- Explore offering discounts for stays of 30+ nights to attract the 8.1% of the market seeking extended stays.
- Adjust minimum nights based on seasonality – potentially shorter during low season and longer during peak demand periods in Merlimont.
Merlimont Airbnb Cancellation Policy Trends Analysis (2025)
Flexible
26 listings
18.8% of total
Moderate
45 listings
32.6% of total
Firm
40 listings
29% of total
Strict
27 listings
19.6% of total
Cancellation Policy Insights for Merlimont
- The prevailing Airbnb cancellation policy trend in Merlimont is Moderate, used by 32.6% of listings.
- There's a relatively balanced mix between guest-friendly (51.4%) and stricter (48.6%) policies, offering choices for different guest needs.
Recommendations for Hosts
- Consider adopting a Moderate policy to align with the 32.6% market standard in Merlimont.
- Regularly review your cancellation policy against competitors and market demand shifts in Merlimont.
Merlimont STR Booking Lead Time Analysis (2025)
Average Booking Lead Time by Month
Booking Lead Time Insights for Merlimont
- The overall average booking lead time for vacation rentals in Merlimont is 46 days.
- Guests book furthest in advance for stays during July (average 80 days), likely coinciding with peak travel demand or local events.
- The shortest booking windows occur for stays in October (average 26 days), indicating more last-minute travel plans during this time.
- Seasonally, Summer (71 days avg.) sees the longest lead times, while Fall (33 days avg.) has the shortest, reflecting typical travel planning cycles.
Recommendations for Hosts
- Use the overall average lead time (46 days) as a baseline for your pricing and availability strategy in Merlimont.
- For July stays, consider implementing length-of-stay discounts or slightly higher rates for bookings made less than 80 days out to capitalize on advance planning.
- Target marketing efforts for the Summer season well in advance (at least 71 days) to capture early planners.
- Monitor your own booking lead times against these Merlimont averages to identify opportunities for dynamic pricing adjustments.
Popular & Essential Airbnb Amenities in Merlimont (2025)
Amenity Prevalence
Amenity Insights for Merlimont
- Essential amenities in Merlimont that guests expect include: Heating, Hot water. Lacking these (any) could significantly impact bookings.
- Popular amenities like TV, Kitchen, Coffee maker are common but not universal. Offering these can provide a competitive edge.
Recommendations for Hosts
- Ensure your listing includes all essential amenities for Merlimont: Heating, Hot water.
- Prioritize adding missing essentials: Heating, Hot water.
- Consider adding popular differentiators like TV or Kitchen to increase appeal.
- Highlight unique or less common amenities you offer (e.g., hot tub, dedicated workspace, EV charger) in your listing description and photos.
- Regularly check competitor amenities in Merlimont to stay competitive.
Merlimont Airbnb Guest Demographics & Profile Analysis (2025)
Guest Profile Summary for Merlimont
- The typical guest profile for Airbnb in Merlimont consists of primarily domestic travelers (78%), often arriving from nearby Paris, typically belonging to the Post-2000s (Gen Z/Alpha) group (50%), primarily speaking French or English.
- Domestic travelers account for 77.7% of guests.
- Key international markets include France (77.7%) and Belgium (9.5%).
- Top languages spoken are French (48.1%) followed by English (29.9%).
- A significant demographic segment is the Post-2000s (Gen Z/Alpha) group, representing 50% of guests.
Recommendations for Hosts
- Target domestic marketing efforts towards travelers from Paris and Lille.
- Tailor amenities and listing descriptions to appeal to the dominant Post-2000s (Gen Z/Alpha) demographic (e.g., highlight fast WiFi, smart home features, local guides).
- Highlight unique local experiences or amenities relevant to the primary guest profile.
- Consider seasonal promotions aligned with peak travel times for key origin markets.
Nearby Short-Term Rental Market Comparison
How does the Merlimont Airbnb market stack up against its neighbors? Compare key performance metrics like average monthly revenue, ADR, and occupancy rates in surrounding areas to understand the broader regional STR landscape.
| Market | Active Properties | Monthly Revenue | Daily Rate | Avg. Occupancy |
|---|---|---|---|---|
| Lo-Reninge | 12 | $6,193 | $432.10 | 49% |
| Morienval | 10 | $5,794 | $400.84 | 32% |
| La Poterie-Cap-d'Antifer | 11 | $5,076 | $293.95 | 55% |
| Bonneville-sur-Touques | 16 | $3,903 | $367.00 | 40% |
| Luneray | 12 | $3,745 | $526.24 | 42% |
| Rosoy-en-Multien | 15 | $3,558 | $367.61 | 51% |
| Saint-Étienne-la-Thillaye | 24 | $3,459 | $325.89 | 42% |
| Cricquebœuf | 10 | $3,417 | $268.29 | 46% |
| Caumont | 11 | $3,350 | $286.17 | 49% |
| Sevenoaks | 168 | $3,040 | $271.64 | 44% |