Hazebrouck Airbnb Market Analysis 2025: Short Term Rental Data & Vacation Rental Statistics in Hauts-de-France, France
Is Airbnb profitable in Hazebrouck in 2025? Explore comprehensive Airbnb analytics for Hazebrouck, Hauts-de-France, France to uncover income potential. This 2025 STR market report for Hazebrouck, based on AirROI data from April 2024 to March 2025, reveals key trends in the niche market of 19 active listings.
Whether you're considering an Airbnb investment in Hazebrouck, optimizing your existing vacation rental, or exploring rental arbitrage opportunities, understanding the Hazebrouck Airbnb data is crucial. Leveraging the low regulation environment is key to maximizing your short term rental income potential. Let's dive into the specifics.
Key Hazebrouck Airbnb Performance Metrics Overview
Monthly Airbnb Revenue Variations & Income Potential in Hazebrouck (2025)
Understanding the monthly revenue variations for Airbnb listings in Hazebrouck is key to maximizing your short term rental income potential. Seasonality significantly impacts earnings. Our analysis, based on data from the past 12 months, shows that the peak revenue month for STRs in Hazebrouck is typically May, while November often presents the lowest earnings, highlighting opportunities for strategic pricing adjustments during shoulder and low seasons. Explore the typical Airbnb income in Hazebrouck across different performance tiers:
- Best-in-class properties (Top 10%) achieve $2,519+ monthly, often utilizing dynamic pricing and superior guest experiences.
- Strong performing properties (Top 25%) earn $1,539 or more, indicating effective management and desirable locations/amenities.
- Typical properties (Median) generate around $716 per month, representing the average market performance.
- Entry-level properties (Bottom 25%) see earnings around $436, often with potential for optimization.
Average Monthly Airbnb Earnings Trend in Hazebrouck
Hazebrouck Airbnb Occupancy Rate Trends (2025)
Maximize your bookings by understanding the Hazebrouck STR occupancy trends. Seasonal demand shifts significantly influence how often properties are booked. Typically, Augustsees the highest demand (peak season occupancy), while July experiences the lowest (low season). Effective strategies, like adjusting minimum stays or offering promotions, can boost occupancy during slower periods. Here's how different property tiers perform in Hazebrouck:
- Best-in-class properties (Top 10%) achieve 64%+ occupancy, indicating high desirability and potentially optimized availability.
- Strong performing properties (Top 25%) maintain 46% or higher occupancy, suggesting good market fit and guest satisfaction.
- Typical properties (Median) have an occupancy rate around 30%.
- Entry-level properties (Bottom 25%) average 17% occupancy, potentially facing higher vacancy.
Average Monthly Occupancy Rate Trend in Hazebrouck
Average Daily Rate (ADR) Airbnb Trends in Hazebrouck (2025)
Effective short term rental pricing strategy in Hazebrouck involves understanding monthly ADR fluctuations. The Average Daily Rate (ADR) for Airbnb in Hazebrouck typically peaks in December and dips lowest during April. Leveraging Airbnb dynamic pricing tools or strategies based on this seasonality can significantly boost revenue. Here's a look at the typical nightly rates achieved:
- Best-in-class properties (Top 10%) command rates of $164+ per night, often due to premium features or locations.
- Strong performing properties (Top 25%) achieve nightly rates of $108 or more.
- Typical properties (Median) charge around $67 per night.
- Entry-level properties (Bottom 25%) earn around $46 per night.
Average Daily Rate (ADR) Trend by Month in Hazebrouck
Get Live Hazebrouck Market Intelligence 👇

Explore Real-time Analytics
Airbnb Seasonality Analysis & Trends in Hazebrouck (2025)
Peak Season (May, December, August)
- Revenue averages $1,504 per month
- Occupancy rates average 42.5%
- Daily rates average $87
Shoulder Season
- Revenue averages $1,160 per month
- Occupancy maintains around 32.8%
- Daily rates hold near $90
Low Season (July, September, November)
- Revenue drops to average $799 per month
- Occupancy decreases to average 29.6%
- Daily rates adjust to average $82
Seasonality Insights for Hazebrouck
- The Airbnb seasonality in Hazebrouck shows highly seasonal trends requiring careful strategy. While the sections above show seasonal averages, it's also insightful to look at the extremes:
- During the high season, the absolute peak month showcases Hazebrouck's highest earning potential, with monthly revenues capable of climbing to $1,611, occupancy reaching a high of 47.9%, and ADRs peaking at $106.
- Conversely, the slowest single month of the year, typically falling within the low season, marks the market's lowest point. In this month, revenue might dip to $699, occupancy could drop to 23.3%, and ADRs may adjust down to $76.
- Understanding both the seasonal averages and these monthly peaks and troughs in revenue, occupancy, and ADR is crucial for maximizing your Airbnb profit potential in Hazebrouck.
Seasonal Strategies for Maximizing Profit
- Peak Season: Maximize revenue through premium pricing and potentially longer minimum stays. Ensure high availability.
- Low Season: Offer competitive pricing, special promotions (e.g., extended stay discounts), and flexible cancellation policies. Target off-season travelers like remote workers or budget-conscious guests.
- Shoulder Seasons: Implement dynamic pricing that balances peak and low rates. Target weekend travelers or specific events. Offer slightly more flexible terms than peak season.
- Regularly analyze your own performance against these Hazebrouck seasonality benchmarks and adjust your pricing and availability strategy accordingly.
Best Areas for Airbnb Investment in Hazebrouck (2025)
Exploring the top neighborhoods for short-term rentals in Hazebrouck? This section highlights key areas, outlining why they are attractive for hosts and guests, along with notable local attractions. Consider these locations based on your target guest profile and investment strategy.
| Neighborhood / Area | Why Host Here? (Target Guests & Appeal) | Key Attractions & Landmarks |
|---|---|---|
| Centre-ville de Hazebrouck | The heart of Hazebrouck with charming streets, historical buildings, and local shops. Ideal for visitors wanting a real taste of French culture and easy access to amenities. | Place Charles de Gaulle, Eglise Saint-Eloi, Musee de la Vie Rurale, Local Markets, Theatre de la Flandre |
| Parc de l'ombre | A lovely park area perfect for outdoor activities and family gatherings. Attracts nature lovers and families looking for a peaceful stay close to the city center. | Parc de l'ombre, Playgrounds, Walking Trails, Picnic Areas |
| Saint-Sylvestre-Cappel | A quaint village just outside Hazebrouck with beautiful countryside views. Great for guests wanting a rural escape while still being near the town. | Church of Saint-Sylvestre, Countryside Walks, Local Farms |
| Hazebrouck Railway Station | A central transport hub making it easy for travelers to explore Hauts-de-France. Attractive for business people and travelers looking for convenience. | Train Connections, Nearby Cafes, Local Shops |
| Côte d'Opale | A short drive from Hazebrouck, this coastal area offers stunning beaches and seaside attractions. Perfect for beach lovers and summer vacationers. | Beaches of Wimereux, Cap Blanc-Nez, Local Seafood Restaurants, Water Sports |
| Abeele | A charming nearby village known for its scenic landscapes and local history, attracting tourists looking for a peaceful rural experience. | Memorial of the Battle of the Somme, Traditional Local Cuisine, Biking Trails |
| Wormhout | A nearby town that offers historical excursions and is close to the Belgian border, providing guests with a mix of culture and history. | Museum of Wormhout, Historic Town Center, Cultural Events |
| Lille | A vibrant city known for its rich history and cultural activities, just a short train ride from Hazebrouck. It attracts a lot of tourists and business travelers. | Lille Grand Palais, Old Lille, Palais des Beaux-Arts, La Vieille Bourse |
Understanding Airbnb License Requirements & STR Laws in Hazebrouck (2025)
While Hazebrouck, Hauts-de-France, France currently shows low STR regulations, specific Airbnb license requirements might still exist or change. Always verify the latest short term rental regulations and Airbnb license requirements directly with local government authorities for Hazebrouck to ensure full compliance before hosting.
(Source: AirROI data, 2025, finding no licensed listings among those analyzed)
Top Performing Airbnb Properties in Hazebrouck (2025)
Benchmark your potential! Explore examples of top-performing Airbnb properties in Hazebrouckbased on Trailing Twelve Month (TTM) revenue. Analyze their characteristics, revenue, occupancy rate, and ADR to understand what drives success in this market.
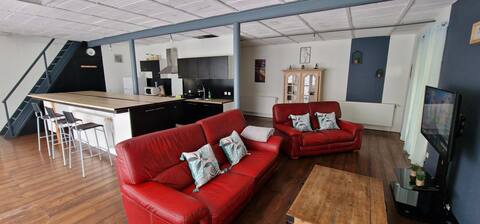
Fully-equipped loft 7 people
Entire Place • 4 bedrooms
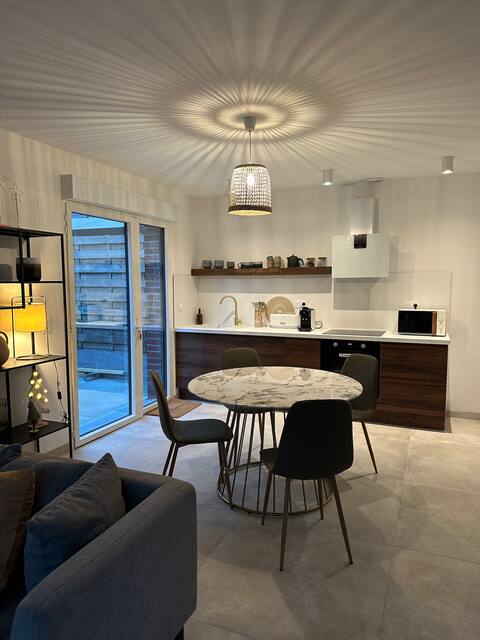
New apartment in the city center
Entire Place • 2 bedrooms
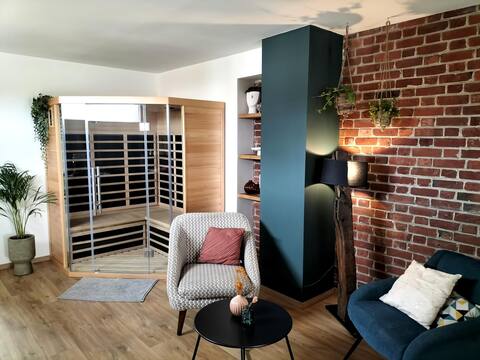
L 'écrin du Rocher★spa private★sauna self★ entry
Entire Place • 1 bedroom

Maison cocooning
Entire Place • 3 bedrooms
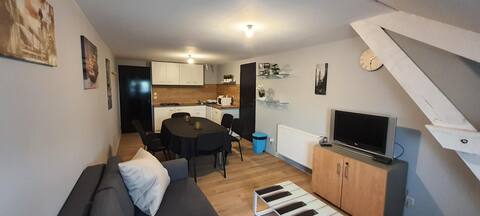
Very nice apartment 5 minutes from the city center
Entire Place • 1 bedroom

Private Hot Tub & Downtown Terrace
Entire Place • N/A
Note: Performance varies based on location, size, amenities, seasonality, and management quality. Data reflects the past 12 months.
Top Performing Airbnb Hosts in Hazebrouck (2025)
Learn from the best! This table showcases top-performing Airbnb hosts in Hazebrouck based on the number of properties managed and estimated total revenue over the past year. Analyze their scale and performance metrics.
| Host Name | Properties | Grossing Revenue | Stay Reviews | Avg Rating |
|---|---|---|---|---|
| Christophe | 5 | $66,345 | 124 | 4.57/5.0 |
| Marie | 2 | $41,270 | 285 | 4.97/5.0 |
| Juliette | 4 | $33,398 | 207 | 4.85/5.0 |
| Sandrine | 1 | $14,391 | 118 | 4.84/5.0 |
| Marie | 1 | $12,904 | 336 | 4.85/5.0 |
| Host #156787230 | 1 | $3,177 | 28 | 4.93/5.0 |
| Host #71349834 | 1 | $1,483 | 0 | 0.00/5.0 |
| Thomas | 1 | $1,458 | 13 | 4.92/5.0 |
| Gregory | 1 | $1,456 | 7 | 5.00/5.0 |
| Sylvie | 1 | $692 | 315 | 4.84/5.0 |
Analyzing the strategies of top hosts, such as their property selection, pricing, and guest communication, can offer valuable lessons for optimizing your own Airbnb operations in Hazebrouck.
Dive Deeper: Advanced Hazebrouck STR Market Data (2025)
Ready to unlock more insights? AirROI provides access to advanced metrics and comprehensive Airbnb data for Hazebrouck. Explore detailed analytics beyond this report to refine your investment strategy, optimize pricing, and maximize your vacation rental profits.
Explore Advanced MetricsHazebrouck Short-Term Rental Market Composition (2025): Property & Room Types
Room Type Distribution
Property Type Distribution
Market Composition Insights for Hazebrouck
- The Hazebrouck Airbnb market composition is heavily skewed towards Entire Home/Apt listings, which make up 73.7% of the 19 active rentals. This indicates strong guest preference for privacy and space.
- Looking at the property type distribution in Hazebrouck, Apartment/Condo properties are the most common (57.9%), reflecting the local real estate landscape.
- Houses represent a significant 36.8% portion, catering likely to families or larger groups.
Hazebrouck Airbnb Room Capacity Analysis (2025): Bedroom Distribution
Distribution of Listings by Number of Bedrooms
Room Capacity Insights for Hazebrouck
- The dominant room capacity in Hazebrouck is 1 bedroom listings, making up 42.1% of the market. This suggests a strong demand for properties suitable for couples or solo travelers.
- Together, 1 bedroom and 3 bedrooms properties represent 52.6% of the active Airbnb listings in Hazebrouck, indicating a high concentration in these sizes.
- A significant 21.0% of listings offer 3+ bedrooms, catering to larger groups and families seeking more space in Hazebrouck.
Hazebrouck Vacation Rental Guest Capacity Trends (2025)
Distribution of Listings by Guest Capacity
Guest Capacity Insights for Hazebrouck
- The most common guest capacity trend in Hazebrouck vacation rentals is listings accommodating 2 guests (42.1%). This suggests the primary traveler segment is likely couples or solo travelers.
- Properties designed for 2 guests and 6 guests dominate the Hazebrouck STR market, accounting for 63.2% of listings.
- A significant 42.1% of listings cater specifically to 1-2 guests, highlighting strong demand from couples and solo travelers in Hazebrouck.
- 31.7% of properties accommodate 6+ guests, serving the market segment for larger families or group travel in Hazebrouck.
- On average, properties in Hazebrouck are equipped to host 3.1 guests.
Hazebrouck Airbnb Booking Patterns (2025): Available vs. Booked Days
Available Days Distribution
Booked Days Distribution
Booking Pattern Insights for Hazebrouck
- The most common availability pattern in Hazebrouck falls within the 181-270 days range, representing 52.6% of listings. This suggests many properties have significant open periods on their calendars.
- Approximately 94.7% of listings show high availability (181+ days open annually), indicating potential for increased bookings or specific owner usage patterns.
- For booked days, the 91-180 days range is most frequent in Hazebrouck (52.6%), reflecting common guest stay durations or potential owner blocking patterns.
- A notable 5.3% of properties secure long booking periods (181+ days booked per year), highlighting successful long-term rental strategies or significant owner usage.
Hazebrouck Airbnb Minimum Stay Requirements Analysis
Distribution of Listings by Minimum Night Requirement
1 Night
10 listings
55.6% of total
2 Nights
6 listings
33.3% of total
3 Nights
1 listings
5.6% of total
7-29 Nights
1 listings
5.6% of total
Key Insights
- The most prevalent minimum stay requirement in Hazebrouck is 1 Night, adopted by 55.6% of listings. This highlights the market's preference for shorter, flexible bookings.
- A strong majority (88.9%) of the Hazebrouck Airbnb data shows acceptance of very short stays (1-2 nights), indicating a dynamic, high-turnover market.
Recommendations
- Align with the market by considering a 1 Night minimum stay, as 55.6% of Hazebrouck hosts use this setting.
- Adjust minimum nights based on seasonality – potentially shorter during low season and longer during peak demand periods in Hazebrouck.
Hazebrouck Airbnb Cancellation Policy Trends Analysis (2025)
Flexible
9 listings
52.9% of total
Moderate
6 listings
35.3% of total
Firm
2 listings
11.8% of total
Cancellation Policy Insights for Hazebrouck
- The prevailing Airbnb cancellation policy trend in Hazebrouck is Flexible, used by 52.9% of listings.
- The market strongly favors guest-friendly terms, with 88.2% of listings offering Flexible or Moderate policies. This suggests guests in Hazebrouck may expect booking flexibility.
Recommendations for Hosts
- Consider adopting a Flexible policy to align with the 52.9% market standard in Hazebrouck.
- Given the high prevalence of Flexible policies (52.9%), offering this can enhance booking appeal, especially during shoulder seasons.
- Regularly review your cancellation policy against competitors and market demand shifts in Hazebrouck.
Hazebrouck STR Booking Lead Time Analysis (2025)
Average Booking Lead Time by Month
Booking Lead Time Insights for Hazebrouck
- The overall average booking lead time for vacation rentals in Hazebrouck is 37 days.
- Guests book furthest in advance for stays during November (average 68 days), likely coinciding with peak travel demand or local events.
- The shortest booking windows occur for stays in December (average 21 days), indicating more last-minute travel plans during this time.
- Seasonally, Fall (47 days avg.) sees the longest lead times, while Winter (22 days avg.) has the shortest, reflecting typical travel planning cycles.
Recommendations for Hosts
- Use the overall average lead time (37 days) as a baseline for your pricing and availability strategy in Hazebrouck.
- For November stays, consider implementing length-of-stay discounts or slightly higher rates for bookings made less than 68 days out to capitalize on advance planning.
- Target marketing efforts for the Fall season well in advance (at least 47 days) to capture early planners.
- Monitor your own booking lead times against these Hazebrouck averages to identify opportunities for dynamic pricing adjustments.
Popular & Essential Airbnb Amenities in Hazebrouck (2025)
Amenity Prevalence
Amenity Insights for Hazebrouck
- Essential amenities in Hazebrouck that guests expect include: Heating, Kitchen. Lacking these (any) could significantly impact bookings.
- Popular amenities like Hair dryer, Wifi, Hot water are common but not universal. Offering these can provide a competitive edge.
- Warning: Wifi is not universally provided but is considered essential globally. Ensure reliable Wifi is offered.
Recommendations for Hosts
- Ensure your listing includes all essential amenities for Hazebrouck: Heating, Kitchen.
- Consider adding popular differentiators like Hair dryer or Wifi to increase appeal.
- Highlight unique or less common amenities you offer (e.g., hot tub, dedicated workspace, EV charger) in your listing description and photos.
- Regularly check competitor amenities in Hazebrouck to stay competitive.
Hazebrouck Airbnb Guest Demographics & Profile Analysis (2025)
Guest Profile Summary for Hazebrouck
- The typical guest profile for Airbnb in Hazebrouck consists of primarily domestic travelers (82%), often arriving from nearby Lille, typically belonging to the Post-2000s (Gen Z/Alpha) group (50%), primarily speaking French or English.
- Domestic travelers account for 81.5% of guests.
- Key international markets include France (81.5%) and Belgium (5.6%).
- Top languages spoken are French (46.9%) followed by English (32.1%).
- A significant demographic segment is the Post-2000s (Gen Z/Alpha) group, representing 50% of guests.
Recommendations for Hosts
- Target domestic marketing efforts towards travelers from Lille and Paris.
- Tailor amenities and listing descriptions to appeal to the dominant Post-2000s (Gen Z/Alpha) demographic (e.g., highlight fast WiFi, smart home features, local guides).
- Highlight unique local experiences or amenities relevant to the primary guest profile.
- Consider seasonal promotions aligned with peak travel times for key origin markets.
Nearby Short-Term Rental Market Comparison
How does the Hazebrouck Airbnb market stack up against its neighbors? Compare key performance metrics like average monthly revenue, ADR, and occupancy rates in surrounding areas to understand the broader regional STR landscape.
| Market | Active Properties | Monthly Revenue | Daily Rate | Avg. Occupancy |
|---|---|---|---|---|
| Lo-Reninge | 12 | $6,193 | $432.10 | 49% |
| Morienval | 10 | $5,794 | $400.84 | 32% |
| Mont-de-l'Enclus | 10 | $5,508 | $360.62 | 39% |
| Trigny | 10 | $3,775 | $248.19 | 46% |
| Kluisbergen | 17 | $3,584 | $401.50 | 44% |
| Rosoy-en-Multien | 15 | $3,558 | $367.61 | 51% |
| Ellezelles | 13 | $3,492 | $292.68 | 45% |
| Ronse - Renaix | 27 | $3,182 | $335.41 | 34% |
| Tardinghen | 12 | $3,021 | $261.55 | 40% |
| Muids | 14 | $2,846 | $352.42 | 39% |