Escalles Airbnb Market Analysis 2025: Short Term Rental Data & Vacation Rental Statistics in Hauts-de-France, France
Is Airbnb profitable in Escalles in 2025? Explore comprehensive Airbnb analytics for Escalles, Hauts-de-France, France to uncover income potential. This 2025 STR market report for Escalles, based on AirROI data from April 2024 to March 2025, reveals key trends in the niche market of 28 active listings.
Whether you're considering an Airbnb investment in Escalles, optimizing your existing vacation rental, or exploring rental arbitrage opportunities, understanding the Escalles Airbnb data is crucial. Understanding the local regulations is key to maximizing your short term rental income potential. Let's dive into the specifics.
Key Escalles Airbnb Performance Metrics Overview
Monthly Airbnb Revenue Variations & Income Potential in Escalles (2025)
Understanding the monthly revenue variations for Airbnb listings in Escalles is key to maximizing your short term rental income potential. Seasonality significantly impacts earnings. Our analysis, based on data from the past 12 months, shows that the peak revenue month for STRs in Escalles is typically August, while January often presents the lowest earnings, highlighting opportunities for strategic pricing adjustments during shoulder and low seasons. Explore the typical Airbnb income in Escalles across different performance tiers:
- Best-in-class properties (Top 10%) achieve $6,054+ monthly, often utilizing dynamic pricing and superior guest experiences.
- Strong performing properties (Top 25%) earn $2,943 or more, indicating effective management and desirable locations/amenities.
- Typical properties (Median) generate around $1,503 per month, representing the average market performance.
- Entry-level properties (Bottom 25%) see earnings around $965, often with potential for optimization.
Average Monthly Airbnb Earnings Trend in Escalles
Escalles Airbnb Occupancy Rate Trends (2025)
Maximize your bookings by understanding the Escalles STR occupancy trends. Seasonal demand shifts significantly influence how often properties are booked. Typically, Augustsees the highest demand (peak season occupancy), while March experiences the lowest (low season). Effective strategies, like adjusting minimum stays or offering promotions, can boost occupancy during slower periods. Here's how different property tiers perform in Escalles:
- Best-in-class properties (Top 10%) achieve 67%+ occupancy, indicating high desirability and potentially optimized availability.
- Strong performing properties (Top 25%) maintain 52% or higher occupancy, suggesting good market fit and guest satisfaction.
- Typical properties (Median) have an occupancy rate around 35%.
- Entry-level properties (Bottom 25%) average 21% occupancy, potentially facing higher vacancy.
Average Monthly Occupancy Rate Trend in Escalles
Average Daily Rate (ADR) Airbnb Trends in Escalles (2025)
Effective short term rental pricing strategy in Escalles involves understanding monthly ADR fluctuations. The Average Daily Rate (ADR) for Airbnb in Escalles typically peaks in May and dips lowest during February. Leveraging Airbnb dynamic pricing tools or strategies based on this seasonality can significantly boost revenue. Here's a look at the typical nightly rates achieved:
- Best-in-class properties (Top 10%) command rates of $437+ per night, often due to premium features or locations.
- Strong performing properties (Top 25%) achieve nightly rates of $273 or more.
- Typical properties (Median) charge around $141 per night.
- Entry-level properties (Bottom 25%) earn around $96 per night.
Average Daily Rate (ADR) Trend by Month in Escalles
Get Live Escalles Market Intelligence 👇

Explore Real-time Analytics
Airbnb Seasonality Analysis & Trends in Escalles (2025)
Peak Season (August, July, May)
- Revenue averages $3,861 per month
- Occupancy rates average 53.4%
- Daily rates average $217
Shoulder Season
- Revenue averages $2,208 per month
- Occupancy maintains around 35.0%
- Daily rates hold near $210
Low Season (January, February, March)
- Revenue drops to average $1,847 per month
- Occupancy decreases to average 27.7%
- Daily rates adjust to average $190
Seasonality Insights for Escalles
- The Airbnb seasonality in Escalles shows highly seasonal trends requiring careful strategy. While the sections above show seasonal averages, it's also insightful to look at the extremes:
- During the high season, the absolute peak month showcases Escalles's highest earning potential, with monthly revenues capable of climbing to $4,803, occupancy reaching a high of 64.5%, and ADRs peaking at $222.
- Conversely, the slowest single month of the year, typically falling within the low season, marks the market's lowest point. In this month, revenue might dip to $1,806, occupancy could drop to 24.5%, and ADRs may adjust down to $187.
- Understanding both the seasonal averages and these monthly peaks and troughs in revenue, occupancy, and ADR is crucial for maximizing your Airbnb profit potential in Escalles.
Seasonal Strategies for Maximizing Profit
- Peak Season: Maximize revenue through premium pricing and potentially longer minimum stays. Ensure high availability.
- Low Season: Offer competitive pricing, special promotions (e.g., extended stay discounts), and flexible cancellation policies. Target off-season travelers like remote workers or budget-conscious guests.
- Shoulder Seasons: Implement dynamic pricing that balances peak and low rates. Target weekend travelers or specific events. Offer slightly more flexible terms than peak season.
- Regularly analyze your own performance against these Escalles seasonality benchmarks and adjust your pricing and availability strategy accordingly.
Best Areas for Airbnb Investment in Escalles (2025)
Exploring the top neighborhoods for short-term rentals in Escalles? This section highlights key areas, outlining why they are attractive for hosts and guests, along with notable local attractions. Consider these locations based on your target guest profile and investment strategy.
| Neighborhood / Area | Why Host Here? (Target Guests & Appeal) | Key Attractions & Landmarks |
|---|---|---|
| Escalles Beach | Beautiful coastal area known for its breathtaking white cliffs and vibrant beach atmosphere. Perfect for tourists looking to relax by the sea and enjoy outdoor activities. | Cap Blanc-Nez, Cap des Deux Groute, Escalles Beach, Wissant Beach, hiking trails in the cliffs |
| Wissant | Charming village known for its sandy beaches and windsurfing opportunities. A favorite among families and water sports enthusiasts. | Wissant Beach, Côte d'Opale, Lighthouse of Wissant, local seafood restaurants, nature reserves |
| Calais | Nearby city offering rich history and great transportation links. An ideal choice for guests looking for urban experiences while being close to the coast. | Calais Lace Museum, The Burghers of Calais, Calais Beach, Les Fontinettes, City of Lace and Fashion |
| Boulogne-sur-Mer | Major coastal city known for its aquariums and rich maritime history. Great for families and aquatic activities. | Nausicaá National Sea Centre, Boulogne Old Town, Boulogne Beach, Château de Boulogne, weekly markets |
| Nausicaá | One of the biggest aquariums in Europe, a major attraction that draws tourists interested in marine life and conservation. | Nausicaá National Sea Centre, aquatic exhibits, educational workshops, gift shop, nearby waterfront cafes |
| Berk planning area | Strategically located between major attractions, perfect for a quieter stay while still enjoying easy access to nearby sights. | Stella Plage, local bakeries, small markets, bike paths, nature walks |
| Saint-Omer | A bit further inland, a historical town known for its rich culture and history. Appeals to history buffs and those seeking a quieter escape. | Saint-Omer Cathedral, Canal des 2 Mers, local art galleries, town squares, weekly farmers market |
| Hautes-de-France region | Covers a wide area with multiple attractions including parks, historical sites, and beautiful villages. Ideal for guest experiences across diverse environments. | Parc Naturel Régional des Caps et Marais d'Opale, French gardens, historical landmarks, biking trails, local festivals |
Understanding Airbnb License Requirements & STR Laws in Escalles (2025)
With 25% of listings showing registration in 2025, understanding potential Airbnb license requirements is crucial in Escalles. Always verify the latest short term rental regulations and Airbnb license requirements directly with local government authorities for Escalles to ensure full compliance before hosting.
(Source: AirROI data, 2025, based on 25% licensed listings)
Top Performing Airbnb Properties in Escalles (2025)
Benchmark your potential! Explore examples of top-performing Airbnb properties in Escallesbased on Trailing Twelve Month (TTM) revenue. Analyze their characteristics, revenue, occupancy rate, and ADR to understand what drives success in this market.
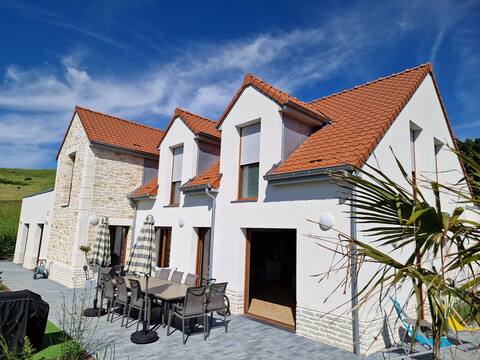
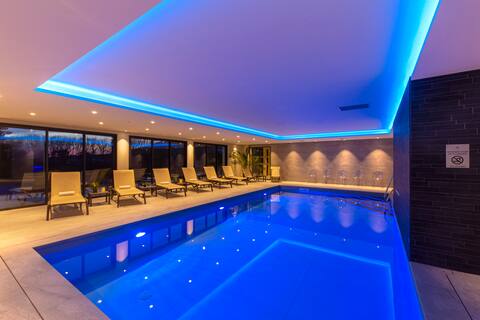
L'Estivale poolside
Entire Place • 5 bedrooms

Villa "L'écume des jours" between see and fields
Entire Place • 5 bedrooms

"Blankenesse": holiday home on the Opal Coast
Entire Place • 4 bedrooms
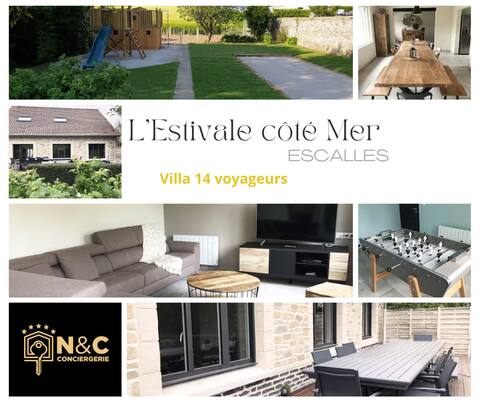
L'Estivale on the sea
Entire Place • 5 bedrooms
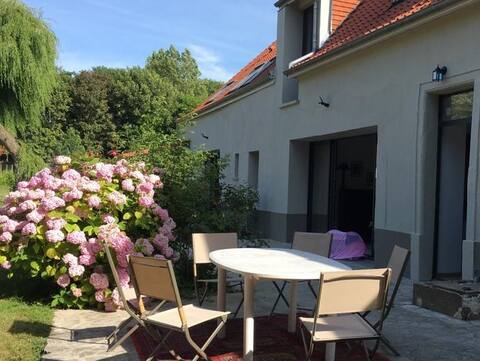
Escalles - Jeanne's House
Entire Place • 4 bedrooms
"Le Vigneau" - Cap Blanc Nez
Entire Place • 3 bedrooms
Note: Performance varies based on location, size, amenities, seasonality, and management quality. Data reflects the past 12 months.
Top Performing Airbnb Hosts in Escalles (2025)
Learn from the best! This table showcases top-performing Airbnb hosts in Escalles based on the number of properties managed and estimated total revenue over the past year. Analyze their scale and performance metrics.
| Host Name | Properties | Grossing Revenue | Stay Reviews | Avg Rating |
|---|---|---|---|---|
| Severine | 2 | $197,043 | 158 | 4.91/5.0 |
| Emmanuelle | 1 | $77,173 | 107 | 4.93/5.0 |
| Catherine Et Éric | 6 | $74,305 | 402 | 4.75/5.0 |
| Katelijne | 1 | $62,788 | 20 | 5.00/5.0 |
| Jean-François | 3 | $61,953 | 368 | 4.82/5.0 |
| David | 3 | $55,660 | 543 | 4.80/5.0 |
| Christine | 1 | $39,824 | 91 | 4.77/5.0 |
| Anne | 2 | $26,836 | 49 | 4.94/5.0 |
| Victor | 1 | $22,557 | 21 | 4.76/5.0 |
| Frederic | 1 | $17,641 | 18 | 4.94/5.0 |
Analyzing the strategies of top hosts, such as their property selection, pricing, and guest communication, can offer valuable lessons for optimizing your own Airbnb operations in Escalles.
Dive Deeper: Advanced Escalles STR Market Data (2025)
Ready to unlock more insights? AirROI provides access to advanced metrics and comprehensive Airbnb data for Escalles. Explore detailed analytics beyond this report to refine your investment strategy, optimize pricing, and maximize your vacation rental profits.
Explore Advanced MetricsEscalles Short-Term Rental Market Composition (2025): Property & Room Types
Room Type Distribution
Property Type Distribution
Market Composition Insights for Escalles
- The Escalles Airbnb market composition is heavily skewed towards Entire Home/Apt listings, which make up 82.1% of the 28 active rentals. This indicates strong guest preference for privacy and space.
- Looking at the property type distribution in Escalles, House properties are the most common (64.3%), reflecting the local real estate landscape.
- Houses represent a significant 64.3% portion, catering likely to families or larger groups.
- The presence of 17.9% Hotel/Boutique listings indicates integration with traditional hospitality.
Escalles Airbnb Room Capacity Analysis (2025): Bedroom Distribution
Distribution of Listings by Number of Bedrooms
Room Capacity Insights for Escalles
- The dominant room capacity in Escalles is 1 bedroom listings, making up 21.4% of the market. This suggests a strong demand for properties suitable for couples or solo travelers.
- Together, 1 bedroom and 2 bedrooms properties represent 42.8% of the active Airbnb listings in Escalles, indicating a high concentration in these sizes.
- A significant 42.9% of listings offer 3+ bedrooms, catering to larger groups and families seeking more space in Escalles.
Escalles Vacation Rental Guest Capacity Trends (2025)
Distribution of Listings by Guest Capacity
Guest Capacity Insights for Escalles
- The most common guest capacity trend in Escalles vacation rentals is listings accommodating 8+ guests (35.7%). This suggests the primary traveler segment is likely larger groups.
- Properties designed for 8+ guests and 2 guests dominate the Escalles STR market, accounting for 53.6% of listings.
- 50.0% of properties accommodate 6+ guests, serving the market segment for larger families or group travel in Escalles.
- On average, properties in Escalles are equipped to host 5.0 guests.
Escalles Airbnb Booking Patterns (2025): Available vs. Booked Days
Available Days Distribution
Booked Days Distribution
Booking Pattern Insights for Escalles
- The most common availability pattern in Escalles falls within the 181-270 days range, representing 42.9% of listings. This suggests many properties have significant open periods on their calendars.
- Approximately 82.2% of listings show high availability (181+ days open annually), indicating potential for increased bookings or specific owner usage patterns.
- For booked days, the 91-180 days range is most frequent in Escalles (39.3%), reflecting common guest stay durations or potential owner blocking patterns.
- A notable 25.0% of properties secure long booking periods (181+ days booked per year), highlighting successful long-term rental strategies or significant owner usage.
Escalles Airbnb Minimum Stay Requirements Analysis
Distribution of Listings by Minimum Night Requirement
1 Night
1 listings
3.7% of total
2 Nights
23 listings
85.2% of total
30+ Nights
3 listings
11.1% of total
Key Insights
- The most prevalent minimum stay requirement in Escalles is 2 Nights, adopted by 85.2% of listings. This highlights the market's preference for shorter, flexible bookings.
- A strong majority (88.9%) of the Escalles Airbnb data shows acceptance of very short stays (1-2 nights), indicating a dynamic, high-turnover market.
- A significant segment (11.1%) caters to monthly stays (30+ nights) in Escalles, pointing to opportunities in the extended-stay market.
Recommendations
- Align with the market by considering a 2 Nights minimum stay, as 85.2% of Escalles hosts use this setting.
- If feasible, allowing 1-night stays, especially midweek or during low season, could capture last-minute bookings, as only 3.7% currently do.
- A 2-night minimum appears standard (85.2%). Consider this for weekends or peak periods.
- Explore offering discounts for stays of 30+ nights to attract the 11.1% of the market seeking extended stays.
- Adjust minimum nights based on seasonality – potentially shorter during low season and longer during peak demand periods in Escalles.
Escalles Airbnb Cancellation Policy Trends Analysis (2025)
Flexible
4 listings
14.3% of total
Moderate
11 listings
39.3% of total
Firm
2 listings
7.1% of total
Strict
11 listings
39.3% of total
Cancellation Policy Insights for Escalles
- The prevailing Airbnb cancellation policy trend in Escalles is Moderate, used by 39.3% of listings.
- There's a relatively balanced mix between guest-friendly (53.6%) and stricter (46.4%) policies, offering choices for different guest needs.
Recommendations for Hosts
- Consider adopting a Moderate policy to align with the 39.3% market standard in Escalles.
- With 39.3% using Strict terms, this is a viable option in Escalles, particularly for high-value properties or during peak demand periods.
- Regularly review your cancellation policy against competitors and market demand shifts in Escalles.
Escalles STR Booking Lead Time Analysis (2025)
Average Booking Lead Time by Month
Booking Lead Time Insights for Escalles
- The overall average booking lead time for vacation rentals in Escalles is 80 days.
- Guests book furthest in advance for stays during July (average 119 days), likely coinciding with peak travel demand or local events.
- The shortest booking windows occur for stays in March (average 43 days), indicating more last-minute travel plans during this time.
- Seasonally, Summer (102 days avg.) sees the longest lead times, while Spring (72 days avg.) has the shortest, reflecting typical travel planning cycles.
Recommendations for Hosts
- Use the overall average lead time (80 days) as a baseline for your pricing and availability strategy in Escalles.
- For July stays, consider implementing length-of-stay discounts or slightly higher rates for bookings made less than 119 days out to capitalize on advance planning.
- Target marketing efforts for the Summer season well in advance (at least 102 days) to capture early planners.
- Monitor your own booking lead times against these Escalles averages to identify opportunities for dynamic pricing adjustments.
Popular & Essential Airbnb Amenities in Escalles (2025)
Amenity Prevalence
Amenity Insights for Escalles
- Essential amenities in Escalles that guests expect include: Heating, Kitchen. Lacking these (any) could significantly impact bookings.
- Popular amenities like Coffee maker, Dishes and silverware, Wifi are common but not universal. Offering these can provide a competitive edge.
- Warning: Wifi is not universally provided but is considered essential globally. Ensure reliable Wifi is offered.
Recommendations for Hosts
- Ensure your listing includes all essential amenities for Escalles: Heating, Kitchen.
- Prioritize adding missing essentials: Kitchen.
- Consider adding popular differentiators like Coffee maker or Dishes and silverware to increase appeal.
- Highlight unique or less common amenities you offer (e.g., hot tub, dedicated workspace, EV charger) in your listing description and photos.
- Regularly check competitor amenities in Escalles to stay competitive.
Escalles Airbnb Guest Demographics & Profile Analysis (2025)
Guest Profile Summary for Escalles
- The typical guest profile for Airbnb in Escalles consists of a mix of domestic (40%) and international guests, with top international origins including Belgium, typically belonging to the Post-2000s (Gen Z/Alpha) group (50%), primarily speaking English or French.
- Domestic travelers account for 40.4% of guests.
- Key international markets include France (40.4%) and Belgium (35.6%).
- Top languages spoken are English (34.8%) followed by French (33.1%).
- A significant demographic segment is the Post-2000s (Gen Z/Alpha) group, representing 50% of guests.
Recommendations for Hosts
- Balance marketing efforts between domestic and international channels based on the guest mix.
- Tailor amenities and listing descriptions to appeal to the dominant Post-2000s (Gen Z/Alpha) demographic (e.g., highlight fast WiFi, smart home features, local guides).
- Highlight unique local experiences or amenities relevant to the primary guest profile.
- Consider seasonal promotions aligned with peak travel times for key origin markets.
Nearby Short-Term Rental Market Comparison
How does the Escalles Airbnb market stack up against its neighbors? Compare key performance metrics like average monthly revenue, ADR, and occupancy rates in surrounding areas to understand the broader regional STR landscape.
| Market | Active Properties | Monthly Revenue | Daily Rate | Avg. Occupancy |
|---|---|---|---|---|
| Lo-Reninge | 12 | $6,193 | $432.10 | 49% |
| Morienval | 10 | $5,794 | $400.84 | 32% |
| La Poterie-Cap-d'Antifer | 11 | $5,076 | $293.95 | 55% |
| Bonneville-sur-Touques | 16 | $3,903 | $367.00 | 40% |
| Luneray | 12 | $3,745 | $526.24 | 42% |
| Rosoy-en-Multien | 15 | $3,558 | $367.61 | 51% |
| Saint-Étienne-la-Thillaye | 24 | $3,459 | $325.89 | 42% |
| Cricquebœuf | 10 | $3,417 | $268.29 | 46% |
| Caumont | 11 | $3,350 | $286.17 | 49% |
| Sevenoaks | 168 | $3,040 | $271.64 | 44% |