Cambrai Airbnb Market Analysis 2025: Short Term Rental Data & Vacation Rental Statistics in Hauts-de-France, France
Is Airbnb profitable in Cambrai in 2025? Explore comprehensive Airbnb analytics for Cambrai, Hauts-de-France, France to uncover income potential. This 2025 STR market report for Cambrai, based on AirROI data from April 2024 to March 2025, reveals key trends in the niche market of 129 active listings.
Whether you're considering an Airbnb investment in Cambrai, optimizing your existing vacation rental, or exploring rental arbitrage opportunities, understanding the Cambrai Airbnb data is crucial. Leveraging the low regulation environment is key to maximizing your short term rental income potential. Let's dive into the specifics.
Key Cambrai Airbnb Performance Metrics Overview
Monthly Airbnb Revenue Variations & Income Potential in Cambrai (2025)
Understanding the monthly revenue variations for Airbnb listings in Cambrai is key to maximizing your short term rental income potential. Seasonality significantly impacts earnings. Our analysis, based on data from the past 12 months, shows that the peak revenue month for STRs in Cambrai is typically May, while March often presents the lowest earnings, highlighting opportunities for strategic pricing adjustments during shoulder and low seasons. Explore the typical Airbnb income in Cambrai across different performance tiers:
- Best-in-class properties (Top 10%) achieve $2,099+ monthly, often utilizing dynamic pricing and superior guest experiences.
- Strong performing properties (Top 25%) earn $1,351 or more, indicating effective management and desirable locations/amenities.
- Typical properties (Median) generate around $851 per month, representing the average market performance.
- Entry-level properties (Bottom 25%) see earnings around $447, often with potential for optimization.
Average Monthly Airbnb Earnings Trend in Cambrai
Cambrai Airbnb Occupancy Rate Trends (2025)
Maximize your bookings by understanding the Cambrai STR occupancy trends. Seasonal demand shifts significantly influence how often properties are booked. Typically, Julysees the highest demand (peak season occupancy), while March experiences the lowest (low season). Effective strategies, like adjusting minimum stays or offering promotions, can boost occupancy during slower periods. Here's how different property tiers perform in Cambrai:
- Best-in-class properties (Top 10%) achieve 80%+ occupancy, indicating high desirability and potentially optimized availability.
- Strong performing properties (Top 25%) maintain 62% or higher occupancy, suggesting good market fit and guest satisfaction.
- Typical properties (Median) have an occupancy rate around 41%.
- Entry-level properties (Bottom 25%) average 21% occupancy, potentially facing higher vacancy.
Average Monthly Occupancy Rate Trend in Cambrai
Average Daily Rate (ADR) Airbnb Trends in Cambrai (2025)
Effective short term rental pricing strategy in Cambrai involves understanding monthly ADR fluctuations. The Average Daily Rate (ADR) for Airbnb in Cambrai typically peaks in July and dips lowest during March. Leveraging Airbnb dynamic pricing tools or strategies based on this seasonality can significantly boost revenue. Here's a look at the typical nightly rates achieved:
- Best-in-class properties (Top 10%) command rates of $111+ per night, often due to premium features or locations.
- Strong performing properties (Top 25%) achieve nightly rates of $84 or more.
- Typical properties (Median) charge around $58 per night.
- Entry-level properties (Bottom 25%) earn around $44 per night.
Average Daily Rate (ADR) Trend by Month in Cambrai
Get Live Cambrai Market Intelligence 👇

Explore Real-time Analytics
Airbnb Seasonality Analysis & Trends in Cambrai (2025)
Peak Season (May, April, June)
- Revenue averages $1,518 per month
- Occupancy rates average 45.3%
- Daily rates average $73
Shoulder Season
- Revenue averages $976 per month
- Occupancy maintains around 45.7%
- Daily rates hold near $73
Low Season (January, February, March)
- Revenue drops to average $668 per month
- Occupancy decreases to average 33.7%
- Daily rates adjust to average $70
Seasonality Insights for Cambrai
- The Airbnb seasonality in Cambrai shows highly seasonal trends requiring careful strategy. While the sections above show seasonal averages, it's also insightful to look at the extremes:
- During the high season, the absolute peak month showcases Cambrai's highest earning potential, with monthly revenues capable of climbing to $1,555, occupancy reaching a high of 52.8%, and ADRs peaking at $75.
- Conversely, the slowest single month of the year, typically falling within the low season, marks the market's lowest point. In this month, revenue might dip to $623, occupancy could drop to 32.9%, and ADRs may adjust down to $69.
- Understanding both the seasonal averages and these monthly peaks and troughs in revenue, occupancy, and ADR is crucial for maximizing your Airbnb profit potential in Cambrai.
Seasonal Strategies for Maximizing Profit
- Peak Season: Maximize revenue through premium pricing and potentially longer minimum stays. Ensure high availability.
- Low Season: Offer competitive pricing, special promotions (e.g., extended stay discounts), and flexible cancellation policies. Target off-season travelers like remote workers or budget-conscious guests.
- Shoulder Seasons: Implement dynamic pricing that balances peak and low rates. Target weekend travelers or specific events. Offer slightly more flexible terms than peak season.
- Regularly analyze your own performance against these Cambrai seasonality benchmarks and adjust your pricing and availability strategy accordingly.
Best Areas for Airbnb Investment in Cambrai (2025)
Exploring the top neighborhoods for short-term rentals in Cambrai? This section highlights key areas, outlining why they are attractive for hosts and guests, along with notable local attractions. Consider these locations based on your target guest profile and investment strategy.
| Neighborhood / Area | Why Host Here? (Target Guests & Appeal) | Key Attractions & Landmarks |
|---|---|---|
| Place Aristide Briand | Central square in Cambrai known for its historical significance and proximity to shops and restaurants. A vibrant hub for both tourists and locals offering cultural events. | Cambrai Cathedral, The Museum of Cambrai, Shopping district, Local cafes and restaurants, City park areas |
| Canal de l'Escaut | Scenic canal area perfect for leisurely walks and cycling. Attracts nature lovers and those interested in outdoor activities, as well as cultural experiences along the water. | Canal-side promenades, Bicycle paths, Historic locks and bridges, Waterfront dining options |
| Historic Center | The heart of Cambrai with medieval architecture and charming streets. Ideal location for tourists wanting to explore the rich history and enjoy local cuisine. | Saint-Géry Church, Ancien Monastère des Prémontrés, Place de la République, Local markets, Artisan shops |
| Parc de la Sablonnière | Large green park area offering recreational activities and events. Great for families and individuals looking for outdoor leisure and relaxation. | Walking trails, Playgrounds, Picnic areas, Seasonal events, Natural beauty |
| Cimetière Militaire Britannique | A significant historical site dedicated to World War I soldiers, attracting tourists interested in history and remembrance. A peaceful and respectful environment. | Memorial site, Guided tours offered, Historical information panels, Cultural reflection areas |
| Rue de la République | Popular shopping district with a variety of stores and restaurants. A bustling area that appeals to tourists looking for shopping and dining experiences. | Boutiques, Local eateries, Cafes, Street performances, Cultural activities |
| Bourgogne District | A quieter residential area that offers a glimpse into local life. Attractive for guests seeking a more authentic and peaceful experience away from the main tourist spots. | Family-run restaurants, Local markets, Community events, Parks and green spaces |
| Musée de Cambrai | An essential stop for art and history lovers, showcasing the region's heritage and artistic achievements. Attracts visitors interested in culture and education. | Art exhibitions, Historical artifacts, Educational programs, Museum café |
Understanding Airbnb License Requirements & STR Laws in Cambrai (2025)
While Cambrai, Hauts-de-France, France currently shows low STR regulations, specific Airbnb license requirements might still exist or change. Always verify the latest short term rental regulations and Airbnb license requirements directly with local government authorities for Cambrai to ensure full compliance before hosting.
(Source: AirROI data, 2025, based on 2% licensed listings)
Top Performing Airbnb Properties in Cambrai (2025)
Benchmark your potential! Explore examples of top-performing Airbnb properties in Cambraibased on Trailing Twelve Month (TTM) revenue. Analyze their characteristics, revenue, occupancy rate, and ADR to understand what drives success in this market.

*LeRelaisdOdile * House * HyperCentre*
Entire Place • 3 bedrooms

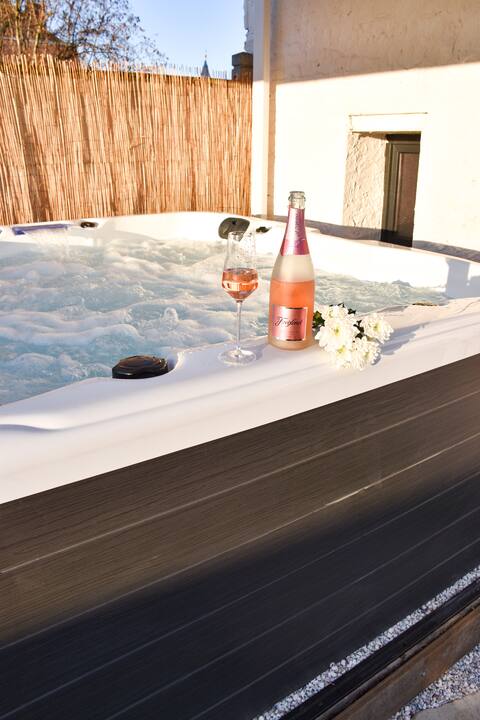
Charming property with private hot tub
Entire Place • 1 bedroom
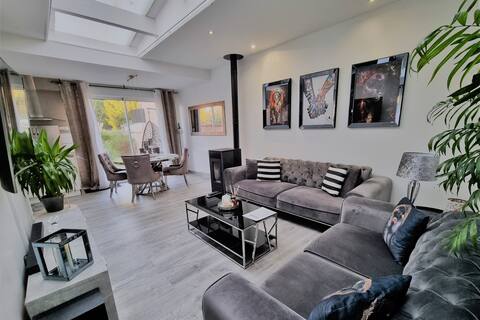
Quiet house with private hot tub
Entire Place • 1 bedroom
Oasis Citadine~Terrace / garden in the center 70m2
Entire Place • 2 bedrooms

the charming 1930
Entire Place • 4 bedrooms
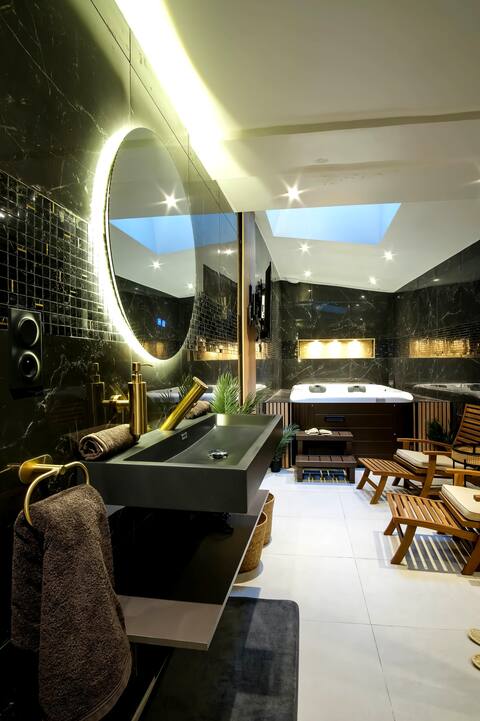
The Golden Suite
Entire Place • 1 bedroom
Note: Performance varies based on location, size, amenities, seasonality, and management quality. Data reflects the past 12 months.
Top Performing Airbnb Hosts in Cambrai (2025)
Learn from the best! This table showcases top-performing Airbnb hosts in Cambrai based on the number of properties managed and estimated total revenue over the past year. Analyze their scale and performance metrics.
| Host Name | Properties | Grossing Revenue | Stay Reviews | Avg Rating |
|---|---|---|---|---|
| LeRelaisdOdile | 10 | $94,788 | 188 | 2.88/5.0 |
| Frédéric | 7 | $56,520 | 67 | 4.46/5.0 |
| Miguel | 5 | $55,180 | 330 | 4.71/5.0 |
| Isabelle | 8 | $45,165 | 254 | 4.82/5.0 |
| Alexandre | 3 | $44,466 | 74 | 3.15/5.0 |
| Aïcha | 4 | $42,718 | 174 | 4.76/5.0 |
| Hichem | 2 | $41,521 | 112 | 4.82/5.0 |
| Caroline | 2 | $38,339 | 207 | 4.89/5.0 |
| Youri | 3 | $33,954 | 214 | 4.94/5.0 |
| Anais | 4 | $32,703 | 93 | 4.55/5.0 |
Analyzing the strategies of top hosts, such as their property selection, pricing, and guest communication, can offer valuable lessons for optimizing your own Airbnb operations in Cambrai.
Dive Deeper: Advanced Cambrai STR Market Data (2025)
Ready to unlock more insights? AirROI provides access to advanced metrics and comprehensive Airbnb data for Cambrai. Explore detailed analytics beyond this report to refine your investment strategy, optimize pricing, and maximize your vacation rental profits.
Explore Advanced MetricsCambrai Short-Term Rental Market Composition (2025): Property & Room Types
Room Type Distribution
Property Type Distribution
Market Composition Insights for Cambrai
- The Cambrai Airbnb market composition is heavily skewed towards Entire Home/Apt listings, which make up 89.9% of the 129 active rentals. This indicates strong guest preference for privacy and space.
- Looking at the property type distribution in Cambrai, Apartment/Condo properties are the most common (79.8%), reflecting the local real estate landscape.
- Houses represent a significant 15.5% portion, catering likely to families or larger groups.
- Smaller segments like hotel/boutique, others (combined 4.7%) offer potential for unique stay experiences.
Cambrai Airbnb Room Capacity Analysis (2025): Bedroom Distribution
Distribution of Listings by Number of Bedrooms
Room Capacity Insights for Cambrai
- The dominant room capacity in Cambrai is 1 bedroom listings, making up 54.3% of the market. This suggests a strong demand for properties suitable for couples or solo travelers.
- Together, 1 bedroom and 2 bedrooms properties represent 69.8% of the active Airbnb listings in Cambrai, indicating a high concentration in these sizes.
- With over half the market (54.3%) consisting of studios or 1-bedroom units, Cambrai is particularly well-suited for individuals or couples.
- Listings with 3+ bedrooms (5.5%) represent a smaller niche, potentially indicating an underserved market for larger group accommodations in Cambrai.
Cambrai Vacation Rental Guest Capacity Trends (2025)
Distribution of Listings by Guest Capacity
Guest Capacity Insights for Cambrai
- The most common guest capacity trend in Cambrai vacation rentals is listings accommodating 2 guests (51.9%). This suggests the primary traveler segment is likely couples or solo travelers.
- Properties designed for 2 guests and 4 guests dominate the Cambrai STR market, accounting for 72.8% of listings.
- A significant 53.5% of listings cater specifically to 1-2 guests, highlighting strong demand from couples and solo travelers in Cambrai.
- 12.5% of properties accommodate 6+ guests, serving the market segment for larger families or group travel in Cambrai.
- On average, properties in Cambrai are equipped to host 3.0 guests.
Cambrai Airbnb Booking Patterns (2025): Available vs. Booked Days
Available Days Distribution
Booked Days Distribution
Booking Pattern Insights for Cambrai
- The most common availability pattern in Cambrai falls within the 181-270 days range, representing 34.9% of listings. This suggests many properties have significant open periods on their calendars.
- Approximately 67.5% of listings show high availability (181+ days open annually), indicating potential for increased bookings or specific owner usage patterns.
- For booked days, the 181-270 days range is most frequent in Cambrai (34.1%), reflecting common guest stay durations or potential owner blocking patterns.
- A notable 38.0% of properties secure long booking periods (181+ days booked per year), highlighting successful long-term rental strategies or significant owner usage.
Cambrai Airbnb Minimum Stay Requirements Analysis
Distribution of Listings by Minimum Night Requirement
1 Night
73 listings
60.3% of total
2 Nights
27 listings
22.3% of total
3 Nights
9 listings
7.4% of total
30+ Nights
12 listings
9.9% of total
Key Insights
- The most prevalent minimum stay requirement in Cambrai is 1 Night, adopted by 60.3% of listings. This highlights the market's preference for shorter, flexible bookings.
- A strong majority (82.6%) of the Cambrai Airbnb data shows acceptance of very short stays (1-2 nights), indicating a dynamic, high-turnover market.
Recommendations
- Align with the market by considering a 1 Night minimum stay, as 60.3% of Cambrai hosts use this setting.
- Explore offering discounts for stays of 30+ nights to attract the 9.9% of the market seeking extended stays.
- Adjust minimum nights based on seasonality – potentially shorter during low season and longer during peak demand periods in Cambrai.
Cambrai Airbnb Cancellation Policy Trends Analysis (2025)
Super Strict 30 Days
4 listings
3.5% of total
Flexible
41 listings
36% of total
Moderate
40 listings
35.1% of total
Firm
7 listings
6.1% of total
Strict
22 listings
19.3% of total
Cancellation Policy Insights for Cambrai
- The prevailing Airbnb cancellation policy trend in Cambrai is Flexible, used by 36% of listings.
- The market strongly favors guest-friendly terms, with 71.1% of listings offering Flexible or Moderate policies. This suggests guests in Cambrai may expect booking flexibility.
Recommendations for Hosts
- Consider adopting a Flexible policy to align with the 36% market standard in Cambrai.
- Regularly review your cancellation policy against competitors and market demand shifts in Cambrai.
Cambrai STR Booking Lead Time Analysis (2025)
Average Booking Lead Time by Month
Booking Lead Time Insights for Cambrai
- The overall average booking lead time for vacation rentals in Cambrai is 28 days.
- Guests book furthest in advance for stays during August (average 38 days), likely coinciding with peak travel demand or local events.
- The shortest booking windows occur for stays in January (average 20 days), indicating more last-minute travel plans during this time.
- Seasonally, Summer (36 days avg.) sees the longest lead times, while Winter (22 days avg.) has the shortest, reflecting typical travel planning cycles.
Recommendations for Hosts
- Use the overall average lead time (28 days) as a baseline for your pricing and availability strategy in Cambrai.
- Target marketing efforts for the Summer season well in advance (at least 36 days) to capture early planners.
- Monitor your own booking lead times against these Cambrai averages to identify opportunities for dynamic pricing adjustments.
Popular & Essential Airbnb Amenities in Cambrai (2025)
Amenity Prevalence
Amenity Insights for Cambrai
- Essential amenities in Cambrai that guests expect include: Wifi, Heating, TV. Lacking these (any) could significantly impact bookings.
- Popular amenities like Kitchen, Smoke alarm, Dishes and silverware are common but not universal. Offering these can provide a competitive edge.
Recommendations for Hosts
- Ensure your listing includes all essential amenities for Cambrai: Wifi, Heating, TV.
- Prioritize adding missing essentials: Wifi, Heating, TV.
- Consider adding popular differentiators like Kitchen or Smoke alarm to increase appeal.
- Highlight unique or less common amenities you offer (e.g., hot tub, dedicated workspace, EV charger) in your listing description and photos.
- Regularly check competitor amenities in Cambrai to stay competitive.
Cambrai Airbnb Guest Demographics & Profile Analysis (2025)
Guest Profile Summary for Cambrai
- The typical guest profile for Airbnb in Cambrai consists of primarily domestic travelers (78%), often arriving from nearby Paris, typically belonging to the Post-2000s (Gen Z/Alpha) group (50%), primarily speaking French or English.
- Domestic travelers account for 77.6% of guests.
- Key international markets include France (77.6%) and Germany (5.3%).
- Top languages spoken are French (46.2%) followed by English (29%).
- A significant demographic segment is the Post-2000s (Gen Z/Alpha) group, representing 50% of guests.
Recommendations for Hosts
- Target domestic marketing efforts towards travelers from Paris and Cambrai.
- Tailor amenities and listing descriptions to appeal to the dominant Post-2000s (Gen Z/Alpha) demographic (e.g., highlight fast WiFi, smart home features, local guides).
- Highlight unique local experiences or amenities relevant to the primary guest profile.
- Consider seasonal promotions aligned with peak travel times for key origin markets.
Nearby Short-Term Rental Market Comparison
How does the Cambrai Airbnb market stack up against its neighbors? Compare key performance metrics like average monthly revenue, ADR, and occupancy rates in surrounding areas to understand the broader regional STR landscape.
| Market | Active Properties | Monthly Revenue | Daily Rate | Avg. Occupancy |
|---|---|---|---|---|
| Lo-Reninge | 12 | $6,193 | $432.10 | 49% |
| Morienval | 10 | $5,794 | $400.84 | 32% |
| Mont-de-l'Enclus | 10 | $5,508 | $360.62 | 39% |
| Dion | 13 | $4,589 | $265.41 | 58% |
| Incourt | 11 | $4,281 | $293.31 | 43% |
| Merksplas | 10 | $3,885 | $256.59 | 44% |
| Trigny | 10 | $3,775 | $248.19 | 46% |
| Kluisbergen | 17 | $3,584 | $401.50 | 44% |
| Rosoy-en-Multien | 15 | $3,558 | $367.61 | 51% |
| Brecht | 10 | $3,531 | $251.70 | 54% |