Berck Airbnb Market Analysis 2025: Short Term Rental Data & Vacation Rental Statistics in Hauts-de-France, France
Is Airbnb profitable in Berck in 2025? Explore comprehensive Airbnb analytics for Berck, Hauts-de-France, France to uncover income potential. This 2025 STR market report for Berck, based on AirROI data from April 2024 to March 2025, reveals key trends in the market of 602 active listings.
Whether you're considering an Airbnb investment in Berck, optimizing your existing vacation rental, or exploring rental arbitrage opportunities, understanding the Berck Airbnb data is crucial. Leveraging the low regulation environment is key to maximizing your short term rental income potential. Let's dive into the specifics.
Key Berck Airbnb Performance Metrics Overview
Monthly Airbnb Revenue Variations & Income Potential in Berck (2025)
Understanding the monthly revenue variations for Airbnb listings in Berck is key to maximizing your short term rental income potential. Seasonality significantly impacts earnings. Our analysis, based on data from the past 12 months, shows that the peak revenue month for STRs in Berck is typically August, while January often presents the lowest earnings, highlighting opportunities for strategic pricing adjustments during shoulder and low seasons. Explore the typical Airbnb income in Berck across different performance tiers:
- Best-in-class properties (Top 10%) achieve $2,854+ monthly, often utilizing dynamic pricing and superior guest experiences.
- Strong performing properties (Top 25%) earn $1,962 or more, indicating effective management and desirable locations/amenities.
- Typical properties (Median) generate around $1,215 per month, representing the average market performance.
- Entry-level properties (Bottom 25%) see earnings around $637, often with potential for optimization.
Average Monthly Airbnb Earnings Trend in Berck
Berck Airbnb Occupancy Rate Trends (2025)
Maximize your bookings by understanding the Berck STR occupancy trends. Seasonal demand shifts significantly influence how often properties are booked. Typically, Augustsees the highest demand (peak season occupancy), while January experiences the lowest (low season). Effective strategies, like adjusting minimum stays or offering promotions, can boost occupancy during slower periods. Here's how different property tiers perform in Berck:
- Best-in-class properties (Top 10%) achieve 73%+ occupancy, indicating high desirability and potentially optimized availability.
- Strong performing properties (Top 25%) maintain 56% or higher occupancy, suggesting good market fit and guest satisfaction.
- Typical properties (Median) have an occupancy rate around 37%.
- Entry-level properties (Bottom 25%) average 20% occupancy, potentially facing higher vacancy.
Average Monthly Occupancy Rate Trend in Berck
Average Daily Rate (ADR) Airbnb Trends in Berck (2025)
Effective short term rental pricing strategy in Berck involves understanding monthly ADR fluctuations. The Average Daily Rate (ADR) for Airbnb in Berck typically peaks in July and dips lowest during March. Leveraging Airbnb dynamic pricing tools or strategies based on this seasonality can significantly boost revenue. Here's a look at the typical nightly rates achieved:
- Best-in-class properties (Top 10%) command rates of $161+ per night, often due to premium features or locations.
- Strong performing properties (Top 25%) achieve nightly rates of $119 or more.
- Typical properties (Median) charge around $90 per night.
- Entry-level properties (Bottom 25%) earn around $71 per night.
Average Daily Rate (ADR) Trend by Month in Berck
Get Live Berck Market Intelligence 👇

Explore Real-time Analytics
Airbnb Seasonality Analysis & Trends in Berck (2025)
Peak Season (August, July, May)
- Revenue averages $2,274 per month
- Occupancy rates average 57.4%
- Daily rates average $108
Shoulder Season
- Revenue averages $1,393 per month
- Occupancy maintains around 36.4%
- Daily rates hold near $105
Low Season (January, February, March)
- Revenue drops to average $822 per month
- Occupancy decreases to average 27.5%
- Daily rates adjust to average $102
Seasonality Insights for Berck
- The Airbnb seasonality in Berck shows highly seasonal trends requiring careful strategy. While the sections above show seasonal averages, it's also insightful to look at the extremes:
- During the high season, the absolute peak month showcases Berck's highest earning potential, with monthly revenues capable of climbing to $2,656, occupancy reaching a high of 72.2%, and ADRs peaking at $110.
- Conversely, the slowest single month of the year, typically falling within the low season, marks the market's lowest point. In this month, revenue might dip to $729, occupancy could drop to 21.4%, and ADRs may adjust down to $101.
- Understanding both the seasonal averages and these monthly peaks and troughs in revenue, occupancy, and ADR is crucial for maximizing your Airbnb profit potential in Berck.
Seasonal Strategies for Maximizing Profit
- Peak Season: Maximize revenue through premium pricing and potentially longer minimum stays. Ensure high availability.
- Low Season: Offer competitive pricing, special promotions (e.g., extended stay discounts), and flexible cancellation policies. Target off-season travelers like remote workers or budget-conscious guests.
- Shoulder Seasons: Implement dynamic pricing that balances peak and low rates. Target weekend travelers or specific events. Offer slightly more flexible terms than peak season.
- Regularly analyze your own performance against these Berck seasonality benchmarks and adjust your pricing and availability strategy accordingly.
Best Areas for Airbnb Investment in Berck (2025)
Exploring the top neighborhoods for short-term rentals in Berck? This section highlights key areas, outlining why they are attractive for hosts and guests, along with notable local attractions. Consider these locations based on your target guest profile and investment strategy.
| Neighborhood / Area | Why Host Here? (Target Guests & Appeal) | Key Attractions & Landmarks |
|---|---|---|
| Plage de Berck | Renowned for its stunning beaches and family-friendly atmosphere, Plage de Berck attracts visitors looking for seaside relaxation and a variety of water sports activities. | Berck-sur-Mer Beach, Berck Kite Festival, Les Phoques de Berck, Promenade de la Plage, Plage des Cayeux |
| Parc Naturel Marquenterre | A unique nature reserve that offers beautiful landscapes and diverse wildlife, appealing to nature lovers and those seeking tranquility away from city life. | Birdwatching, Walking trails, Guided tours, Natural landscapes, Flora and fauna |
| Centre Ville | The city center of Berck has charming streets and local shops, making it a convenient spot for guests who enjoy exploring the local culture and dining options. | Local markets, Restaurants and cafes, Cultural events, Berck Town Hall, Historic buildings |
| Casino de Berck | Popular with visitors for entertainment and nightlife, the Casino area provides fun activities and is a favored spot for tourists and locals alike. | Berck Casino, Live music events, Restaurants, Bars, Gaming rooms |
| Rue de l’Impératrice | Known for its historic architecture and proximity to the beach, this area is ideal for visitors wanting to experience both culture and coastal relaxation. | Historical architecture, Art galleries, Local boutiques, Coastal views, Beach access |
| Les Sables d'Olonne | Although a bit further away, this area is known for its beautiful sands and vibrant atmosphere, attracting holidaymakers looking for beach activities. | Villas by the beach, Water sports, Boardwalk promenade, Local eateries, Historical sites |
| Kitesurfing centers | Berck is famous for its kitesurfing opportunities, attracting adventure seekers and sports enthusiasts looking for an active vacation. | Kitesurfing lessons, Kite festivals, Wind conditions, Water sports shops, Adventure activities |
| Côte d'Opale | A stunning stretch of coastline known for its natural beauty, it draws visitors who appreciate scenic views and outdoor activities like hiking and cycling. | Hiking trails, Cycling paths, Scenic views, Coastline beauty, Historical landmarks |
Understanding Airbnb License Requirements & STR Laws in Berck (2025)
While Berck, Hauts-de-France, France currently shows low STR regulations, specific Airbnb license requirements might still exist or change. Always verify the latest short term rental regulations and Airbnb license requirements directly with local government authorities for Berck to ensure full compliance before hosting.
(Source: AirROI data, 2025, based on 4% licensed listings)
Top Performing Airbnb Properties in Berck (2025)
Benchmark your potential! Explore examples of top-performing Airbnb properties in Berckbased on Trailing Twelve Month (TTM) revenue. Analyze their characteristics, revenue, occupancy rate, and ADR to understand what drives success in this market.

Romantic Suite Face Mer
Entire Place • N/A

Location Berck Plage Large 7-bedroom house
Entire Place • 7 bedrooms
House - BERCK SUR MER
Entire Place • 4 bedrooms
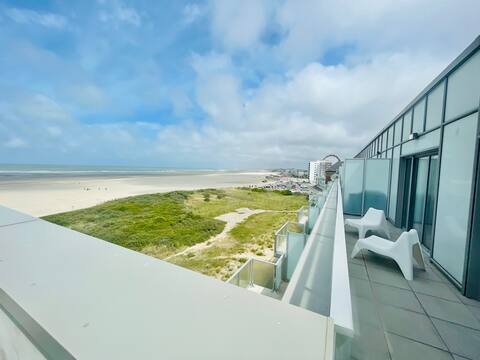
SEA VIEW - 3Br - 2 Parking - 8 people
Entire Place • 3 bedrooms

bubbles of paradise love room
Entire Place • 1 bedroom
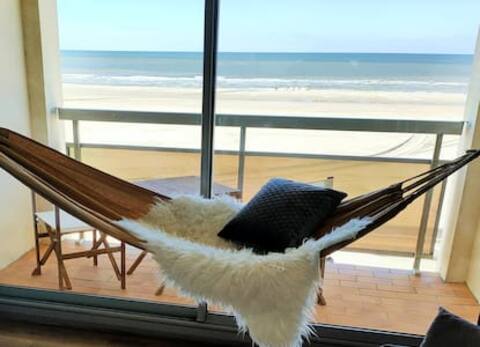
Hammock on THE SEA
Entire Place • 1 bedroom
Note: Performance varies based on location, size, amenities, seasonality, and management quality. Data reflects the past 12 months.
Top Performing Airbnb Hosts in Berck (2025)
Learn from the best! This table showcases top-performing Airbnb hosts in Berck based on the number of properties managed and estimated total revenue over the past year. Analyze their scale and performance metrics.
| Host Name | Properties | Grossing Revenue | Stay Reviews | Avg Rating |
|---|---|---|---|---|
| Claudine | 12 | $427,925 | 957 | 4.84/5.0 |
| Marie | 19 | $423,307 | 1902 | 4.55/5.0 |
| Jérémie BOURGOIS | 11 | $139,354 | 717 | 4.39/5.0 |
| Priscilla | 17 | $131,755 | 169 | 4.70/5.0 |
| Juliette | 7 | $125,807 | 613 | 4.71/5.0 |
| Dormio | 10 | $112,875 | 330 | 4.56/5.0 |
| Ludovic | 3 | $103,911 | 247 | 4.89/5.0 |
| Virginie Et Thomas | 3 | $90,926 | 66 | 4.78/5.0 |
| Arnaud | 2 | $89,630 | 64 | 4.84/5.0 |
| Nathalie | 4 | $86,881 | 115 | 4.83/5.0 |
Analyzing the strategies of top hosts, such as their property selection, pricing, and guest communication, can offer valuable lessons for optimizing your own Airbnb operations in Berck.
Dive Deeper: Advanced Berck STR Market Data (2025)
Ready to unlock more insights? AirROI provides access to advanced metrics and comprehensive Airbnb data for Berck. Explore detailed analytics beyond this report to refine your investment strategy, optimize pricing, and maximize your vacation rental profits.
Explore Advanced MetricsBerck Short-Term Rental Market Composition (2025): Property & Room Types
Room Type Distribution
Property Type Distribution
Market Composition Insights for Berck
- The Berck Airbnb market composition is heavily skewed towards Entire Home/Apt listings, which make up 98.2% of the 602 active rentals. This indicates strong guest preference for privacy and space.
- Looking at the property type distribution in Berck, Apartment/Condo properties are the most common (76.7%), reflecting the local real estate landscape.
- Houses represent a significant 21.3% portion, catering likely to families or larger groups.
- Smaller segments like hotel/boutique, outdoor/unique, others (combined 1.9%) offer potential for unique stay experiences.
Berck Airbnb Room Capacity Analysis (2025): Bedroom Distribution
Distribution of Listings by Number of Bedrooms
Room Capacity Insights for Berck
- The dominant room capacity in Berck is 1 bedroom listings, making up 43% of the market. This suggests a strong demand for properties suitable for couples or solo travelers.
- Together, 1 bedroom and 2 bedrooms properties represent 66.6% of the active Airbnb listings in Berck, indicating a high concentration in these sizes.
Berck Vacation Rental Guest Capacity Trends (2025)
Distribution of Listings by Guest Capacity
Guest Capacity Insights for Berck
- The most common guest capacity trend in Berck vacation rentals is listings accommodating 4 guests (40.5%). This suggests the primary traveler segment is likely small families or groups.
- Properties designed for 4 guests and 2 guests dominate the Berck STR market, accounting for 59.9% of listings.
- 24.8% of properties accommodate 6+ guests, serving the market segment for larger families or group travel in Berck.
- On average, properties in Berck are equipped to host 4.2 guests.
Berck Airbnb Booking Patterns (2025): Available vs. Booked Days
Available Days Distribution
Booked Days Distribution
Booking Pattern Insights for Berck
- The most common availability pattern in Berck falls within the 181-270 days range, representing 41.2% of listings. This suggests many properties have significant open periods on their calendars.
- Approximately 80.1% of listings show high availability (181+ days open annually), indicating potential for increased bookings or specific owner usage patterns.
- For booked days, the 91-180 days range is most frequent in Berck (43%), reflecting common guest stay durations or potential owner blocking patterns.
- A notable 20.4% of properties secure long booking periods (181+ days booked per year), highlighting successful long-term rental strategies or significant owner usage.
Berck Airbnb Minimum Stay Requirements Analysis
Distribution of Listings by Minimum Night Requirement
1 Night
96 listings
16.9% of total
2 Nights
217 listings
38.3% of total
3 Nights
85 listings
15% of total
4-6 Nights
32 listings
5.6% of total
7-29 Nights
40 listings
7.1% of total
30+ Nights
97 listings
17.1% of total
Key Insights
- The most prevalent minimum stay requirement in Berck is 2 Nights, adopted by 38.3% of listings. This highlights the market's preference for shorter, flexible bookings.
- A significant segment (17.1%) caters to monthly stays (30+ nights) in Berck, pointing to opportunities in the extended-stay market.
Recommendations
- Align with the market by considering a 2 Nights minimum stay, as 38.3% of Berck hosts use this setting.
- If feasible, allowing 1-night stays, especially midweek or during low season, could capture last-minute bookings, as only 16.9% currently do.
- A 2-night minimum appears standard (38.3%). Consider this for weekends or peak periods.
- Explore offering discounts for stays of 30+ nights to attract the 17.1% of the market seeking extended stays.
- Adjust minimum nights based on seasonality – potentially shorter during low season and longer during peak demand periods in Berck.
Berck Airbnb Cancellation Policy Trends Analysis (2025)
Refundable
2 listings
0.4% of total
Super Strict 30 Days
1 listings
0.2% of total
Non-refundable
2 listings
0.4% of total
Super Strict 60 Days
7 listings
1.3% of total
Flexible
72 listings
13% of total
Moderate
194 listings
35.1% of total
Firm
103 listings
18.6% of total
Strict
172 listings
31.1% of total
Cancellation Policy Insights for Berck
- The prevailing Airbnb cancellation policy trend in Berck is Moderate, used by 35.1% of listings.
- There's a relatively balanced mix between guest-friendly (48.1%) and stricter (49.7%) policies, offering choices for different guest needs.
Recommendations for Hosts
- Consider adopting a Moderate policy to align with the 35.1% market standard in Berck.
- With 31.1% using Strict terms, this is a viable option in Berck, particularly for high-value properties or during peak demand periods.
- Regularly review your cancellation policy against competitors and market demand shifts in Berck.
Berck STR Booking Lead Time Analysis (2025)
Average Booking Lead Time by Month
Booking Lead Time Insights for Berck
- The overall average booking lead time for vacation rentals in Berck is 52 days.
- Guests book furthest in advance for stays during April (average 88 days), likely coinciding with peak travel demand or local events.
- The shortest booking windows occur for stays in November (average 27 days), indicating more last-minute travel plans during this time.
- Seasonally, Summer (71 days avg.) sees the longest lead times, while Winter (38 days avg.) has the shortest, reflecting typical travel planning cycles.
Recommendations for Hosts
- Use the overall average lead time (52 days) as a baseline for your pricing and availability strategy in Berck.
- For April stays, consider implementing length-of-stay discounts or slightly higher rates for bookings made less than 88 days out to capitalize on advance planning.
- Target marketing efforts for the Summer season well in advance (at least 71 days) to capture early planners.
- Monitor your own booking lead times against these Berck averages to identify opportunities for dynamic pricing adjustments.
Popular & Essential Airbnb Amenities in Berck (2025)
Amenity Prevalence
Amenity Insights for Berck
- Essential amenities in Berck that guests expect include: Kitchen, TV, Heating. Lacking these (any) could significantly impact bookings.
- Popular amenities like Hot water, Smoke alarm, Coffee maker are common but not universal. Offering these can provide a competitive edge.
Recommendations for Hosts
- Ensure your listing includes all essential amenities for Berck: Kitchen, TV, Heating.
- Prioritize adding missing essentials: Kitchen, TV, Heating.
- Consider adding popular differentiators like Hot water or Smoke alarm to increase appeal.
- Highlight unique or less common amenities you offer (e.g., hot tub, dedicated workspace, EV charger) in your listing description and photos.
- Regularly check competitor amenities in Berck to stay competitive.
Berck Airbnb Guest Demographics & Profile Analysis (2025)
Guest Profile Summary for Berck
- The typical guest profile for Airbnb in Berck consists of primarily domestic travelers (88%), often arriving from nearby Paris, typically belonging to the Post-2000s (Gen Z/Alpha) group (50%), primarily speaking French or English.
- Domestic travelers account for 88.4% of guests.
- Key international markets include France (88.4%) and Belgium (5.4%).
- Top languages spoken are French (54.6%) followed by English (27.5%).
- A significant demographic segment is the Post-2000s (Gen Z/Alpha) group, representing 50% of guests.
Recommendations for Hosts
- Target domestic marketing efforts towards travelers from Paris and Lille.
- Tailor amenities and listing descriptions to appeal to the dominant Post-2000s (Gen Z/Alpha) demographic (e.g., highlight fast WiFi, smart home features, local guides).
- Highlight unique local experiences or amenities relevant to the primary guest profile.
- Consider seasonal promotions aligned with peak travel times for key origin markets.
Nearby Short-Term Rental Market Comparison
How does the Berck Airbnb market stack up against its neighbors? Compare key performance metrics like average monthly revenue, ADR, and occupancy rates in surrounding areas to understand the broader regional STR landscape.
| Market | Active Properties | Monthly Revenue | Daily Rate | Avg. Occupancy |
|---|---|---|---|---|
| Lo-Reninge | 12 | $6,193 | $432.10 | 49% |
| Morienval | 10 | $5,794 | $400.84 | 32% |
| La Poterie-Cap-d'Antifer | 11 | $5,076 | $293.95 | 55% |
| Bonneville-sur-Touques | 16 | $3,903 | $367.00 | 40% |
| Luneray | 12 | $3,745 | $526.24 | 42% |
| Rosoy-en-Multien | 15 | $3,558 | $367.61 | 51% |
| Saint-Étienne-la-Thillaye | 24 | $3,459 | $325.89 | 42% |
| Cricquebœuf | 10 | $3,417 | $268.29 | 46% |
| Caumont | 11 | $3,350 | $286.17 | 49% |
| Sevenoaks | 168 | $3,040 | $271.64 | 44% |