Petit-Bourg Airbnb Market Analysis 2025: Short Term Rental Data & Vacation Rental Statistics in Guadeloupe, France
Is Airbnb profitable in Petit-Bourg in 2025? Explore comprehensive Airbnb analytics for Petit-Bourg, Guadeloupe, France to uncover income potential. This 2025 STR market report for Petit-Bourg, based on AirROI data from April 2024 to March 2025, reveals key trends in the market of 253 active listings.
Whether you're considering an Airbnb investment in Petit-Bourg, optimizing your existing vacation rental, or exploring rental arbitrage opportunities, understanding the Petit-Bourg Airbnb data is crucial. Leveraging the low regulation environment is key to maximizing your short term rental income potential. Let's dive into the specifics.
Key Petit-Bourg Airbnb Performance Metrics Overview
Monthly Airbnb Revenue Variations & Income Potential in Petit-Bourg (2025)
Understanding the monthly revenue variations for Airbnb listings in Petit-Bourg is key to maximizing your short term rental income potential. Seasonality significantly impacts earnings. Our analysis, based on data from the past 12 months, shows that the peak revenue month for STRs in Petit-Bourg is typically February, while October often presents the lowest earnings, highlighting opportunities for strategic pricing adjustments during shoulder and low seasons. Explore the typical Airbnb income in Petit-Bourg across different performance tiers:
- Best-in-class properties (Top 10%) achieve $3,239+ monthly, often utilizing dynamic pricing and superior guest experiences.
- Strong performing properties (Top 25%) earn $2,096 or more, indicating effective management and desirable locations/amenities.
- Typical properties (Median) generate around $1,174 per month, representing the average market performance.
- Entry-level properties (Bottom 25%) see earnings around $551, often with potential for optimization.
Average Monthly Airbnb Earnings Trend in Petit-Bourg
Petit-Bourg Airbnb Occupancy Rate Trends (2025)
Maximize your bookings by understanding the Petit-Bourg STR occupancy trends. Seasonal demand shifts significantly influence how often properties are booked. Typically, Februarysees the highest demand (peak season occupancy), while June experiences the lowest (low season). Effective strategies, like adjusting minimum stays or offering promotions, can boost occupancy during slower periods. Here's how different property tiers perform in Petit-Bourg:
- Best-in-class properties (Top 10%) achieve 82%+ occupancy, indicating high desirability and potentially optimized availability.
- Strong performing properties (Top 25%) maintain 65% or higher occupancy, suggesting good market fit and guest satisfaction.
- Typical properties (Median) have an occupancy rate around 37%.
- Entry-level properties (Bottom 25%) average 18% occupancy, potentially facing higher vacancy.
Average Monthly Occupancy Rate Trend in Petit-Bourg
Average Daily Rate (ADR) Airbnb Trends in Petit-Bourg (2025)
Effective short term rental pricing strategy in Petit-Bourg involves understanding monthly ADR fluctuations. The Average Daily Rate (ADR) for Airbnb in Petit-Bourg typically peaks in April and dips lowest during November. Leveraging Airbnb dynamic pricing tools or strategies based on this seasonality can significantly boost revenue. Here's a look at the typical nightly rates achieved:
- Best-in-class properties (Top 10%) command rates of $229+ per night, often due to premium features or locations.
- Strong performing properties (Top 25%) achieve nightly rates of $141 or more.
- Typical properties (Median) charge around $86 per night.
- Entry-level properties (Bottom 25%) earn around $63 per night.
Average Daily Rate (ADR) Trend by Month in Petit-Bourg
Get Live Petit-Bourg Market Intelligence 👇

Explore Real-time Analytics
Airbnb Seasonality Analysis & Trends in Petit-Bourg (2025)
Peak Season (February, January, April)
- Revenue averages $1,909 per month
- Occupancy rates average 53.1%
- Daily rates average $129
Shoulder Season
- Revenue averages $1,556 per month
- Occupancy maintains around 39.1%
- Daily rates hold near $128
Low Season (September, October, November)
- Revenue drops to average $1,199 per month
- Occupancy decreases to average 36.7%
- Daily rates adjust to average $127
Seasonality Insights for Petit-Bourg
- The Airbnb seasonality in Petit-Bourg shows moderate seasonality with distinct peak and low periods. While the sections above show seasonal averages, it's also insightful to look at the extremes:
- During the high season, the absolute peak month showcases Petit-Bourg's highest earning potential, with monthly revenues capable of climbing to $1,951, occupancy reaching a high of 59.1%, and ADRs peaking at $130.
- Conversely, the slowest single month of the year, typically falling within the low season, marks the market's lowest point. In this month, revenue might dip to $1,163, occupancy could drop to 28.0%, and ADRs may adjust down to $125.
- Understanding both the seasonal averages and these monthly peaks and troughs in revenue, occupancy, and ADR is crucial for maximizing your Airbnb profit potential in Petit-Bourg.
Seasonal Strategies for Maximizing Profit
- Peak Season: Maximize revenue through premium pricing and potentially longer minimum stays. Ensure high availability.
- Low Season: Offer competitive pricing, special promotions (e.g., extended stay discounts), and flexible cancellation policies. Target off-season travelers like remote workers or budget-conscious guests.
- Shoulder Seasons: Implement dynamic pricing that balances peak and low rates. Target weekend travelers or specific events. Offer slightly more flexible terms than peak season.
- Regularly analyze your own performance against these Petit-Bourg seasonality benchmarks and adjust your pricing and availability strategy accordingly.
Best Areas for Airbnb Investment in Petit-Bourg (2025)
Exploring the top neighborhoods for short-term rentals in Petit-Bourg? This section highlights key areas, outlining why they are attractive for hosts and guests, along with notable local attractions. Consider these locations based on your target guest profile and investment strategy.
| Neighborhood / Area | Why Host Here? (Target Guests & Appeal) | Key Attractions & Landmarks |
|---|---|---|
| Petit-Bourg Center | The heart of Petit-Bourg, offering convenient access to shops, restaurants, and local culture. It’s an excellent spot for visitors wanting to experience the local lifestyle while being close to natural attractions. | Local markets, Eglise Saint-Antoine, Maison de la Mangrove, Public parks, Cultural events |
| Jacquard | A residential area that provides a peaceful environment for tourists looking for tranquility. Close to lush nature and hiking trails, great for eco-tourists and nature lovers. | National Park of Guadeloupe, Hiking trails, Flora and fauna observation, Local art, Craft markets |
| Boyer | Known for its scenic views and proximity to natural parks. This area attracts visitors looking for outdoor adventures and relaxation in nature. | Les Chutes du Carbet, Hiking trails, Rivers for kayaking, Biodiversity attractions, Picnic areas |
| La Riviere | A quieter part of Petit-Bourg, offering a more rural Guadeloupean experience. Ideal for travelers seeking peace and natural beauty away from busy tourist spots. | Scenic river views, Local farm tours, Bird watching, Cycling routes, Authentic local dining |
| Les Abymes | Located nearby, this area has a vibrant community and is close to important local attractions, making it a good base for visitors exploring Guadeloupe. | Museums, Shopping centers, Food markets, Cultural festivals, Historical sites |
| Morne à l'Eau | This area is steeped in history and culture, attracting tourists interested in the heritage of Guadeloupe. Perfect for hosting guests interested in local traditions. | Historical monuments, Local craft workshops, Festivals, Old plantation houses, Community events |
| Lamentin | A suburban area that offers a family-friendly atmosphere with parks and recreational facilities. Great for families visiting Guadeloupe with children. | Family parks, Recreational activities, Pet-friendly locations, Children's attractions, Local folklore events |
| Terre de Haut | Part of the Les Saintes archipelago, known for its stunning beaches and snorkeling spots. This area is perfect for beach lovers and those seeking a tropical getaway. | Anse Rodrigue Beach, Fort Napoleon, Beautiful hiking paths, Snorkeling tours, Culinary experiences |
Understanding Airbnb License Requirements & STR Laws in Petit-Bourg (2025)
While Petit-Bourg, Guadeloupe, France currently shows low STR regulations, specific Airbnb license requirements might still exist or change. Always verify the latest short term rental regulations and Airbnb license requirements directly with local government authorities for Petit-Bourg to ensure full compliance before hosting.
(Source: AirROI data, 2025, based on 0% licensed listings)
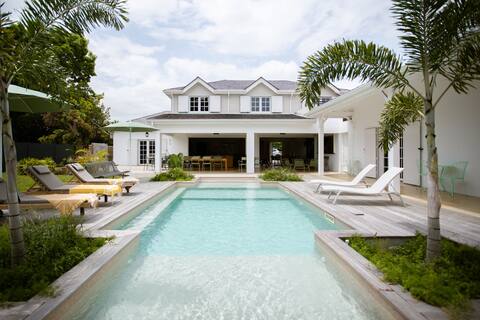
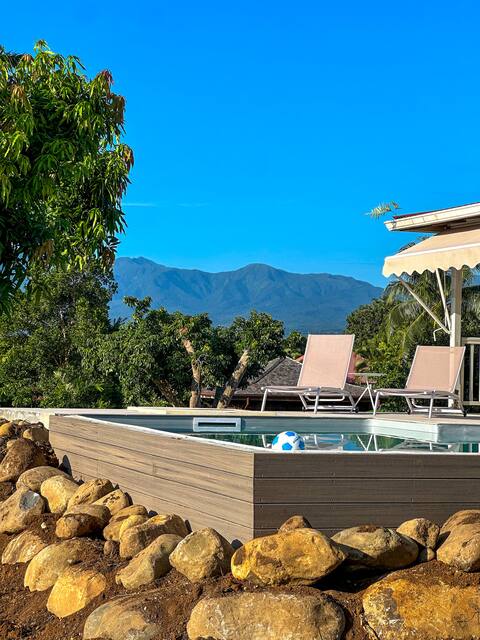
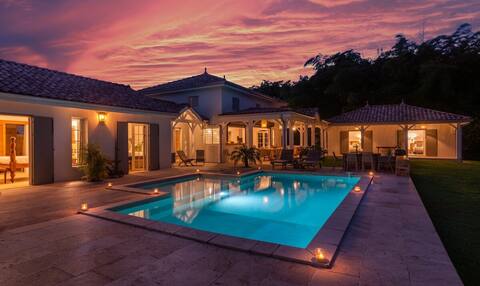
Top Performing Airbnb Properties in Petit-Bourg (2025)
Benchmark your potential! Explore examples of top-performing Airbnb properties in Petit-Bourgbased on Trailing Twelve Month (TTM) revenue. Analyze their characteristics, revenue, occupancy rate, and ADR to understand what drives success in this market.

Villa Kumquat mountains view and swimming pool !
Entire Place • 5 bedrooms

"Nouveau" VILLA SINOE - SUN AND OVER VIEW
Entire Place • 3 bedrooms
Villa Saint Vincent by Habitation Saint Charles
Entire Place • 6 bedrooms
Villa Creole chic in Petit Bourg - Case Thérèse
Entire Place • 3 bedrooms
Villa Saint Jean by Habitation Saint Charles
Entire Place • 5 bedrooms

Gîte Kolin's view
Entire Place • 1 bedroom
Note: Performance varies based on location, size, amenities, seasonality, and management quality. Data reflects the past 12 months.
Top Performing Airbnb Hosts in Petit-Bourg (2025)
Learn from the best! This table showcases top-performing Airbnb hosts in Petit-Bourg based on the number of properties managed and estimated total revenue over the past year. Analyze their scale and performance metrics.
| Host Name | Properties | Grossing Revenue | Stay Reviews | Avg Rating |
|---|---|---|---|---|
| Bertrand | 3 | $129,226 | 4 | 1.67/5.0 |
| Glwadys | 1 | $90,539 | 25 | 4.88/5.0 |
| Sinoe | 1 | $76,709 | 57 | 4.93/5.0 |
| Host #480878427 | 6 | $63,330 | 1 | 0.00/5.0 |
| Annick | 2 | $57,943 | 66 | 4.89/5.0 |
| Laurent | 1 | $57,860 | 6 | 4.83/5.0 |
| Fabienne Et Sébastien | 7 | $52,797 | 34 | 2.03/5.0 |
| Glwadys | 6 | $47,846 | 250 | 4.71/5.0 |
| Heinrick | 1 | $44,845 | 57 | 4.91/5.0 |
| Isabelle | 3 | $44,805 | 32 | 4.98/5.0 |
Analyzing the strategies of top hosts, such as their property selection, pricing, and guest communication, can offer valuable lessons for optimizing your own Airbnb operations in Petit-Bourg.
Dive Deeper: Advanced Petit-Bourg STR Market Data (2025)
Ready to unlock more insights? AirROI provides access to advanced metrics and comprehensive Airbnb data for Petit-Bourg. Explore detailed analytics beyond this report to refine your investment strategy, optimize pricing, and maximize your vacation rental profits.
Explore Advanced MetricsPetit-Bourg Short-Term Rental Market Composition (2025): Property & Room Types
Room Type Distribution
Property Type Distribution
Market Composition Insights for Petit-Bourg
- The Petit-Bourg Airbnb market composition is heavily skewed towards Entire Home/Apt listings, which make up 94.9% of the 253 active rentals. This indicates strong guest preference for privacy and space.
- Looking at the property type distribution in Petit-Bourg, House properties are the most common (67.2%), reflecting the local real estate landscape.
- Houses represent a significant 67.2% portion, catering likely to families or larger groups.
- Smaller segments like hotel/boutique, outdoor/unique, others (combined 8.7%) offer potential for unique stay experiences.
Petit-Bourg Airbnb Room Capacity Analysis (2025): Bedroom Distribution
Distribution of Listings by Number of Bedrooms
Room Capacity Insights for Petit-Bourg
- The dominant room capacity in Petit-Bourg is 1 bedroom listings, making up 46.2% of the market. This suggests a strong demand for properties suitable for couples or solo travelers.
- Together, 1 bedroom and 2 bedrooms properties represent 75.4% of the active Airbnb listings in Petit-Bourg, indicating a high concentration in these sizes.
- A significant 21.0% of listings offer 3+ bedrooms, catering to larger groups and families seeking more space in Petit-Bourg.
Petit-Bourg Vacation Rental Guest Capacity Trends (2025)
Distribution of Listings by Guest Capacity
Guest Capacity Insights for Petit-Bourg
- The most common guest capacity trend in Petit-Bourg vacation rentals is listings accommodating 2 guests (28.9%). This suggests the primary traveler segment is likely couples or solo travelers.
- Properties designed for 2 guests and 4 guests dominate the Petit-Bourg STR market, accounting for 55.4% of listings.
- 26.1% of properties accommodate 6+ guests, serving the market segment for larger families or group travel in Petit-Bourg.
- On average, properties in Petit-Bourg are equipped to host 4.0 guests.
Petit-Bourg Airbnb Booking Patterns (2025): Available vs. Booked Days
Available Days Distribution
Booked Days Distribution
Booking Pattern Insights for Petit-Bourg
- The most common availability pattern in Petit-Bourg falls within the 271-366 days range, representing 58.1% of listings. This suggests many properties have significant open periods on their calendars.
- Approximately 81.0% of listings show high availability (181+ days open annually), indicating potential for increased bookings or specific owner usage patterns.
- For booked days, the 31-90 days range is most frequent in Petit-Bourg (28.5%), reflecting common guest stay durations or potential owner blocking patterns.
- A notable 19.4% of properties secure long booking periods (181+ days booked per year), highlighting successful long-term rental strategies or significant owner usage.
Petit-Bourg Airbnb Minimum Stay Requirements Analysis
Distribution of Listings by Minimum Night Requirement
1 Night
12 listings
5% of total
2 Nights
49 listings
20.6% of total
3 Nights
43 listings
18.1% of total
4-6 Nights
85 listings
35.7% of total
7-29 Nights
21 listings
8.8% of total
30+ Nights
28 listings
11.8% of total
Key Insights
- The most prevalent minimum stay requirement in Petit-Bourg is 4-6 Nights, adopted by 35.7% of listings. This highlights the market's preference for longer commitments.
- A significant segment (11.8%) caters to monthly stays (30+ nights) in Petit-Bourg, pointing to opportunities in the extended-stay market.
Recommendations
- Align with the market by considering a 4-6 Nights minimum stay, as 35.7% of Petit-Bourg hosts use this setting.
- If feasible, allowing 1-night stays, especially midweek or during low season, could capture last-minute bookings, as only 5% currently do.
- Explore offering discounts for stays of 30+ nights to attract the 11.8% of the market seeking extended stays.
- Adjust minimum nights based on seasonality – potentially shorter during low season and longer during peak demand periods in Petit-Bourg.
Petit-Bourg Airbnb Cancellation Policy Trends Analysis (2025)
Non-refundable
1 listings
0.5% of total
Flexible
70 listings
35% of total
Moderate
61 listings
30.5% of total
Firm
39 listings
19.5% of total
Strict
29 listings
14.5% of total
Cancellation Policy Insights for Petit-Bourg
- The prevailing Airbnb cancellation policy trend in Petit-Bourg is Flexible, used by 35% of listings.
- There's a relatively balanced mix between guest-friendly (65.5%) and stricter (34.0%) policies, offering choices for different guest needs.
Recommendations for Hosts
- Consider adopting a Flexible policy to align with the 35% market standard in Petit-Bourg.
- Using a Strict policy might deter some guests, as only 14.5% of listings use it. Evaluate if potential revenue protection outweighs possible lower booking rates.
- Regularly review your cancellation policy against competitors and market demand shifts in Petit-Bourg.
Petit-Bourg STR Booking Lead Time Analysis (2025)
Average Booking Lead Time by Month
Booking Lead Time Insights for Petit-Bourg
- The overall average booking lead time for vacation rentals in Petit-Bourg is 60 days.
- Guests book furthest in advance for stays during April (average 84 days), likely coinciding with peak travel demand or local events.
- The shortest booking windows occur for stays in September (average 46 days), indicating more last-minute travel plans during this time.
- Seasonally, Spring (76 days avg.) sees the longest lead times, while Fall (56 days avg.) has the shortest, reflecting typical travel planning cycles.
Recommendations for Hosts
- Use the overall average lead time (60 days) as a baseline for your pricing and availability strategy in Petit-Bourg.
- For April stays, consider implementing length-of-stay discounts or slightly higher rates for bookings made less than 84 days out to capitalize on advance planning.
- Target marketing efforts for the Spring season well in advance (at least 76 days) to capture early planners.
- Monitor your own booking lead times against these Petit-Bourg averages to identify opportunities for dynamic pricing adjustments.
Popular & Essential Airbnb Amenities in Petit-Bourg (2025)
Amenity Prevalence
Amenity Insights for Petit-Bourg
- Essential amenities in Petit-Bourg that guests expect include: Wifi, Free parking on premises, Kitchen. Lacking these (any) could significantly impact bookings.
- Popular amenities like Air conditioning, Hot water, Essentials are common but not universal. Offering these can provide a competitive edge.
Recommendations for Hosts
- Ensure your listing includes all essential amenities for Petit-Bourg: Wifi, Free parking on premises, Kitchen.
- Prioritize adding missing essentials: Wifi, Free parking on premises, Kitchen.
- Consider adding popular differentiators like Air conditioning or Hot water to increase appeal.
- Highlight unique or less common amenities you offer (e.g., hot tub, dedicated workspace, EV charger) in your listing description and photos.
- Regularly check competitor amenities in Petit-Bourg to stay competitive.
Petit-Bourg Airbnb Guest Demographics & Profile Analysis (2025)
Guest Profile Summary for Petit-Bourg
- The typical guest profile for Airbnb in Petit-Bourg consists of primarily domestic travelers (69%), often arriving from nearby Paris, typically belonging to the Post-2000s (Gen Z/Alpha) group (50%), primarily speaking French or English.
- Domestic travelers account for 68.5% of guests.
- Key international markets include France (68.5%) and Guadeloupe (11.9%).
- Top languages spoken are French (46.9%) followed by English (32.9%).
- A significant demographic segment is the Post-2000s (Gen Z/Alpha) group, representing 50% of guests.
Recommendations for Hosts
- Target domestic marketing efforts towards travelers from Paris and Les Abymes.
- Tailor amenities and listing descriptions to appeal to the dominant Post-2000s (Gen Z/Alpha) demographic (e.g., highlight fast WiFi, smart home features, local guides).
- Highlight unique local experiences or amenities relevant to the primary guest profile.
- Consider seasonal promotions aligned with peak travel times for key origin markets.
Nearby Short-Term Rental Market Comparison
How does the Petit-Bourg Airbnb market stack up against its neighbors? Compare key performance metrics like average monthly revenue, ADR, and occupancy rates in surrounding areas to understand the broader regional STR landscape.
| Market | Active Properties | Monthly Revenue | Daily Rate | Avg. Occupancy |
|---|---|---|---|---|
| Saint Barthélemy | 769 | $5,753 | $1511.68 | 32% |
| Fleming Estate | 15 | $5,216 | $507.12 | 45% |
| Christian Hill | 10 | $3,909 | $474.96 | 33% |
| Bolans | 84 | $3,806 | $472.95 | 37% |
| The Valley | 34 | $3,614 | $655.08 | 35% |
| Crosbies | 20 | $2,938 | $511.77 | 34% |
| Blue Waters | 30 | $2,821 | $233.45 | 49% |
| Saint John | 11 | $2,813 | $226.80 | 48% |
| Jolly Harbour | 98 | $2,543 | $313.89 | 37% |
| Falmouth | 31 | $2,435 | $350.44 | 46% |