Le Moule Airbnb Market Analysis 2025: Short Term Rental Data & Vacation Rental Statistics in Guadeloupe, France
Is Airbnb profitable in Le Moule in 2025? Explore comprehensive Airbnb analytics for Le Moule, Guadeloupe, France to uncover income potential. This 2025 STR market report for Le Moule, based on AirROI data from April 2024 to March 2025, reveals key trends in the market of 324 active listings.
Whether you're considering an Airbnb investment in Le Moule, optimizing your existing vacation rental, or exploring rental arbitrage opportunities, understanding the Le Moule Airbnb data is crucial. Leveraging the low regulation environment is key to maximizing your short term rental income potential. Let's dive into the specifics.
Key Le Moule Airbnb Performance Metrics Overview
Monthly Airbnb Revenue Variations & Income Potential in Le Moule (2025)
Understanding the monthly revenue variations for Airbnb listings in Le Moule is key to maximizing your short term rental income potential. Seasonality significantly impacts earnings. Our analysis, based on data from the past 12 months, shows that the peak revenue month for STRs in Le Moule is typically January, while September often presents the lowest earnings, highlighting opportunities for strategic pricing adjustments during shoulder and low seasons. Explore the typical Airbnb income in Le Moule across different performance tiers:
- Best-in-class properties (Top 10%) achieve $3,737+ monthly, often utilizing dynamic pricing and superior guest experiences.
- Strong performing properties (Top 25%) earn $2,093 or more, indicating effective management and desirable locations/amenities.
- Typical properties (Median) generate around $1,077 per month, representing the average market performance.
- Entry-level properties (Bottom 25%) see earnings around $484, often with potential for optimization.
Average Monthly Airbnb Earnings Trend in Le Moule
Le Moule Airbnb Occupancy Rate Trends (2025)
Maximize your bookings by understanding the Le Moule STR occupancy trends. Seasonal demand shifts significantly influence how often properties are booked. Typically, Februarysees the highest demand (peak season occupancy), while June experiences the lowest (low season). Effective strategies, like adjusting minimum stays or offering promotions, can boost occupancy during slower periods. Here's how different property tiers perform in Le Moule:
- Best-in-class properties (Top 10%) achieve 81%+ occupancy, indicating high desirability and potentially optimized availability.
- Strong performing properties (Top 25%) maintain 62% or higher occupancy, suggesting good market fit and guest satisfaction.
- Typical properties (Median) have an occupancy rate around 37%.
- Entry-level properties (Bottom 25%) average 18% occupancy, potentially facing higher vacancy.
Average Monthly Occupancy Rate Trend in Le Moule
Average Daily Rate (ADR) Airbnb Trends in Le Moule (2025)
Effective short term rental pricing strategy in Le Moule involves understanding monthly ADR fluctuations. The Average Daily Rate (ADR) for Airbnb in Le Moule typically peaks in January and dips lowest during September. Leveraging Airbnb dynamic pricing tools or strategies based on this seasonality can significantly boost revenue. Here's a look at the typical nightly rates achieved:
- Best-in-class properties (Top 10%) command rates of $228+ per night, often due to premium features or locations.
- Strong performing properties (Top 25%) achieve nightly rates of $141 or more.
- Typical properties (Median) charge around $86 per night.
- Entry-level properties (Bottom 25%) earn around $62 per night.
Average Daily Rate (ADR) Trend by Month in Le Moule
Get Live Le Moule Market Intelligence 👇

Explore Real-time Analytics
Airbnb Seasonality Analysis & Trends in Le Moule (2025)
Peak Season (January, February, April)
- Revenue averages $2,097 per month
- Occupancy rates average 51.6%
- Daily rates average $124
Shoulder Season
- Revenue averages $1,558 per month
- Occupancy maintains around 40.4%
- Daily rates hold near $120
Low Season (June, September, October)
- Revenue drops to average $1,139 per month
- Occupancy decreases to average 30.2%
- Daily rates adjust to average $113
Seasonality Insights for Le Moule
- The Airbnb seasonality in Le Moule shows highly seasonal trends requiring careful strategy. While the sections above show seasonal averages, it's also insightful to look at the extremes:
- During the high season, the absolute peak month showcases Le Moule's highest earning potential, with monthly revenues capable of climbing to $2,238, occupancy reaching a high of 58.4%, and ADRs peaking at $129.
- Conversely, the slowest single month of the year, typically falling within the low season, marks the market's lowest point. In this month, revenue might dip to $970, occupancy could drop to 27.0%, and ADRs may adjust down to $113.
- Understanding both the seasonal averages and these monthly peaks and troughs in revenue, occupancy, and ADR is crucial for maximizing your Airbnb profit potential in Le Moule.
Seasonal Strategies for Maximizing Profit
- Peak Season: Maximize revenue through premium pricing and potentially longer minimum stays. Ensure high availability.
- Low Season: Offer competitive pricing, special promotions (e.g., extended stay discounts), and flexible cancellation policies. Target off-season travelers like remote workers or budget-conscious guests.
- Shoulder Seasons: Implement dynamic pricing that balances peak and low rates. Target weekend travelers or specific events. Offer slightly more flexible terms than peak season.
- Regularly analyze your own performance against these Le Moule seasonality benchmarks and adjust your pricing and availability strategy accordingly.
Best Areas for Airbnb Investment in Le Moule (2025)
Exploring the top neighborhoods for short-term rentals in Le Moule? This section highlights key areas, outlining why they are attractive for hosts and guests, along with notable local attractions. Consider these locations based on your target guest profile and investment strategy.
| Neighborhood / Area | Why Host Here? (Target Guests & Appeal) | Key Attractions & Landmarks |
|---|---|---|
| Plage de la Caravelle | A stunning beach known for its clear waters and golden sand. It's a perfect spot for tourists looking for relaxation and water sports. | Caravelle Beach, Surfing spots, Snorkeling excursions, Local beach bars, Scenic views of the Caribbean Sea |
| Le Moule Village | The charming village that captures the essence of local culture and tradition. Ideal for travelers wanting to experience authentic Caribbean life. | Local markets, Historic sites, Culinary experiences, Traditional festivals, Art galleries |
| Pointe des Châteaux | A picturesque point offering breathtaking views and a chance to explore natural landscapes. Great for nature lovers and photographers. | Stunning cliffs, Nature trails, Birdwatching, Scenic photo opportunities, Local flora and fauna |
| Anse à la Barque | A quiet beach area known for its tranquility and beauty, appealing to visitors seeking a peaceful getaway. | Secluded beaches, Walking paths, Sunset views, Picnic spots |
| La Pointe du Marigot | A popular spot for water sports activities such as kite surfing and windsurfing, attracting adventure seekers. | Kite surfing schools, Water sports rentals, Beautiful coastal views, Beach cafes |
| Le Moule Golf Course | An 18-hole golf course set in beautiful landscapes, attracting golf enthusiasts and those looking for leisure activities. | Challenging golf holes, Clubhouse amenities, Scenic greens, Golf tournaments, Relaxing atmosphere |
| Morne à l'Eau | Famous for its beautiful salt flats and rich history, this area offers unique cultural experiences for visitors. | Salt flats, Local heritage sites, Cultural events, Historical museums |
| Sainte-Marguerite | A serene area with lush vegetation and beautiful coastlines, ideal for eco-tourism and nature exploration. | Nature trails, Beach access, Birdwatching opportunities, Tropical flora |
Understanding Airbnb License Requirements & STR Laws in Le Moule (2025)
While Le Moule, Guadeloupe, France currently shows low STR regulations, specific Airbnb license requirements might still exist or change. Always verify the latest short term rental regulations and Airbnb license requirements directly with local government authorities for Le Moule to ensure full compliance before hosting.
(Source: AirROI data, 2025, finding no licensed listings among those analyzed)
Top Performing Airbnb Properties in Le Moule (2025)
Benchmark your potential! Explore examples of top-performing Airbnb properties in Le Moulebased on Trailing Twelve Month (TTM) revenue. Analyze their characteristics, revenue, occupancy rate, and ADR to understand what drives success in this market.

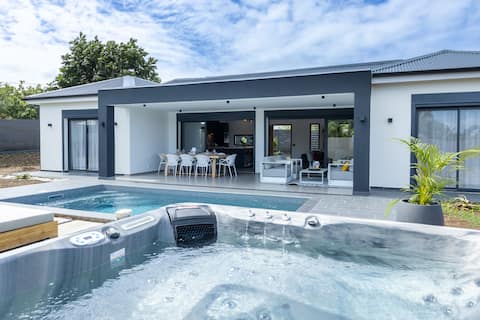
Villa Kalina amazing seaview and private pool
Entire Place • 4 bedrooms
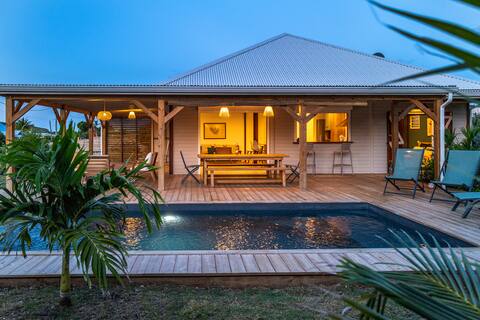
Villa Canelle FWI 4 stars pool/jacuzzi/beach/Surf
Entire Place • 3 bedrooms
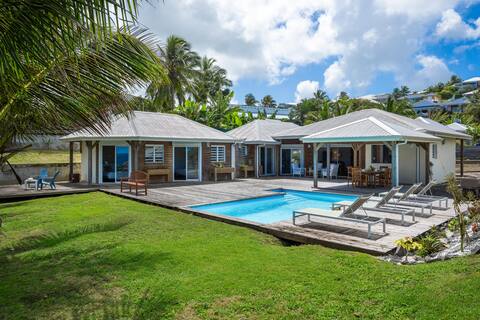
Beautiful creole villa at 150m from the ocean
Entire Place • 3 bedrooms

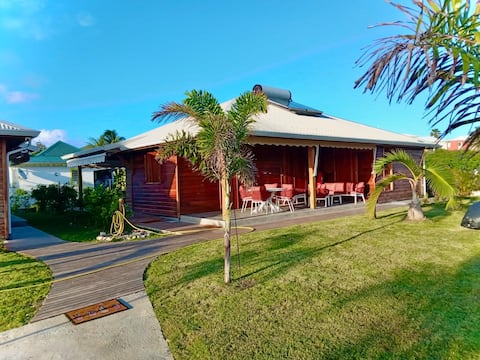
Villa Niaouli zen atmosphere and lush nature
Entire Place • 1 bedroom
Ti prince
Entire Place • 3 bedrooms
Résidence Antilles.B
Entire Place • 5 bedrooms
Note: Performance varies based on location, size, amenities, seasonality, and management quality. Data reflects the past 12 months.
Top Performing Airbnb Hosts in Le Moule (2025)
Learn from the best! This table showcases top-performing Airbnb hosts in Le Moule based on the number of properties managed and estimated total revenue over the past year. Analyze their scale and performance metrics.
| Host Name | Properties | Grossing Revenue | Stay Reviews | Avg Rating |
|---|---|---|---|---|
| ZeWelcome | 9 | $349,328 | 57 | 3.80/5.0 |
| Paola Et Mathieu | 5 | $128,137 | 46 | 3.94/5.0 |
| Livia & Christophe | 3 | $100,767 | 222 | 4.88/5.0 |
| Olivier | 2 | $90,447 | 134 | 4.96/5.0 |
| La Clef Des Iles | 2 | $85,885 | 8 | 4.83/5.0 |
| Thomas | 2 | $81,043 | 21 | 4.92/5.0 |
| Angele | 3 | $75,609 | 27 | 1.63/5.0 |
| Audrey | 1 | $63,455 | 7 | 5.00/5.0 |
| Ugo | 1 | $61,548 | 20 | 4.90/5.0 |
| Rodrigue | 2 | $54,498 | 34 | 4.93/5.0 |
Analyzing the strategies of top hosts, such as their property selection, pricing, and guest communication, can offer valuable lessons for optimizing your own Airbnb operations in Le Moule.
Dive Deeper: Advanced Le Moule STR Market Data (2025)
Ready to unlock more insights? AirROI provides access to advanced metrics and comprehensive Airbnb data for Le Moule. Explore detailed analytics beyond this report to refine your investment strategy, optimize pricing, and maximize your vacation rental profits.
Explore Advanced MetricsLe Moule Short-Term Rental Market Composition (2025): Property & Room Types
Room Type Distribution
Property Type Distribution
Market Composition Insights for Le Moule
- The Le Moule Airbnb market composition is heavily skewed towards Entire Home/Apt listings, which make up 96.9% of the 324 active rentals. This indicates strong guest preference for privacy and space.
- Looking at the property type distribution in Le Moule, House properties are the most common (63.3%), reflecting the local real estate landscape.
- Houses represent a significant 63.3% portion, catering likely to families or larger groups.
- Smaller segments like hotel/boutique, others, unique stays, outdoor/unique (combined 5.5%) offer potential for unique stay experiences.
Le Moule Airbnb Room Capacity Analysis (2025): Bedroom Distribution
Distribution of Listings by Number of Bedrooms
Room Capacity Insights for Le Moule
- The dominant room capacity in Le Moule is 1 bedroom listings, making up 43.5% of the market. This suggests a strong demand for properties suitable for couples or solo travelers.
- Together, 1 bedroom and 2 bedrooms properties represent 70.0% of the active Airbnb listings in Le Moule, indicating a high concentration in these sizes.
- A significant 23.7% of listings offer 3+ bedrooms, catering to larger groups and families seeking more space in Le Moule.
Le Moule Vacation Rental Guest Capacity Trends (2025)
Distribution of Listings by Guest Capacity
Guest Capacity Insights for Le Moule
- The most common guest capacity trend in Le Moule vacation rentals is listings accommodating 4 guests (29%). This suggests the primary traveler segment is likely small families or groups.
- Properties designed for 4 guests and 2 guests dominate the Le Moule STR market, accounting for 56.5% of listings.
- 28.1% of properties accommodate 6+ guests, serving the market segment for larger families or group travel in Le Moule.
- On average, properties in Le Moule are equipped to host 4.1 guests.
Le Moule Airbnb Booking Patterns (2025): Available vs. Booked Days
Available Days Distribution
Booked Days Distribution
Booking Pattern Insights for Le Moule
- The most common availability pattern in Le Moule falls within the 271-366 days range, representing 55.2% of listings. This suggests many properties have significant open periods on their calendars.
- Approximately 84.8% of listings show high availability (181+ days open annually), indicating potential for increased bookings or specific owner usage patterns.
- For booked days, the 91-180 days range is most frequent in Le Moule (30.6%), reflecting common guest stay durations or potential owner blocking patterns.
- A notable 15.4% of properties secure long booking periods (181+ days booked per year), highlighting successful long-term rental strategies or significant owner usage.
Le Moule Airbnb Minimum Stay Requirements Analysis
Distribution of Listings by Minimum Night Requirement
1 Night
24 listings
8% of total
2 Nights
51 listings
16.9% of total
3 Nights
59 listings
19.6% of total
4-6 Nights
106 listings
35.2% of total
7-29 Nights
23 listings
7.6% of total
30+ Nights
38 listings
12.6% of total
Key Insights
- The most prevalent minimum stay requirement in Le Moule is 4-6 Nights, adopted by 35.2% of listings. This highlights the market's preference for longer commitments.
- A significant segment (12.6%) caters to monthly stays (30+ nights) in Le Moule, pointing to opportunities in the extended-stay market.
Recommendations
- Align with the market by considering a 4-6 Nights minimum stay, as 35.2% of Le Moule hosts use this setting.
- If feasible, allowing 1-night stays, especially midweek or during low season, could capture last-minute bookings, as only 8% currently do.
- Explore offering discounts for stays of 30+ nights to attract the 12.6% of the market seeking extended stays.
- Adjust minimum nights based on seasonality – potentially shorter during low season and longer during peak demand periods in Le Moule.
Le Moule Airbnb Cancellation Policy Trends Analysis (2025)
Super Strict 30 Days
7 listings
2.7% of total
Super Strict 60 Days
2 listings
0.8% of total
Flexible
63 listings
24.2% of total
Moderate
71 listings
27.3% of total
Firm
63 listings
24.2% of total
Strict
54 listings
20.8% of total
Cancellation Policy Insights for Le Moule
- The prevailing Airbnb cancellation policy trend in Le Moule is Moderate, used by 27.3% of listings.
- There's a relatively balanced mix between guest-friendly (51.5%) and stricter (45.0%) policies, offering choices for different guest needs.
Recommendations for Hosts
- Consider adopting a Moderate policy to align with the 27.3% market standard in Le Moule.
- Regularly review your cancellation policy against competitors and market demand shifts in Le Moule.
Le Moule STR Booking Lead Time Analysis (2025)
Average Booking Lead Time by Month
Booking Lead Time Insights for Le Moule
- The overall average booking lead time for vacation rentals in Le Moule is 66 days.
- Guests book furthest in advance for stays during February (average 87 days), likely coinciding with peak travel demand or local events.
- The shortest booking windows occur for stays in September (average 46 days), indicating more last-minute travel plans during this time.
- Seasonally, Winter (79 days avg.) sees the longest lead times, while Fall (57 days avg.) has the shortest, reflecting typical travel planning cycles.
Recommendations for Hosts
- Use the overall average lead time (66 days) as a baseline for your pricing and availability strategy in Le Moule.
- For February stays, consider implementing length-of-stay discounts or slightly higher rates for bookings made less than 87 days out to capitalize on advance planning.
- Target marketing efforts for the Winter season well in advance (at least 79 days) to capture early planners.
- Monitor your own booking lead times against these Le Moule averages to identify opportunities for dynamic pricing adjustments.
Popular & Essential Airbnb Amenities in Le Moule (2025)
Amenity Prevalence
Amenity Insights for Le Moule
- Essential amenities in Le Moule that guests expect include: Kitchen, Wifi, Air conditioning. Lacking these (any) could significantly impact bookings.
- Popular amenities like Essentials, Free parking on premises, Hot water are common but not universal. Offering these can provide a competitive edge.
Recommendations for Hosts
- Ensure your listing includes all essential amenities for Le Moule: Kitchen, Wifi, Air conditioning.
- Prioritize adding missing essentials: Kitchen, Wifi, Air conditioning.
- Consider adding popular differentiators like Essentials or Free parking on premises to increase appeal.
- Highlight unique or less common amenities you offer (e.g., hot tub, dedicated workspace, EV charger) in your listing description and photos.
- Regularly check competitor amenities in Le Moule to stay competitive.
Le Moule Airbnb Guest Demographics & Profile Analysis (2025)
Guest Profile Summary for Le Moule
- The typical guest profile for Airbnb in Le Moule consists of a mix of domestic (64%) and international guests, often arriving from nearby Paris, typically belonging to the Post-2000s (Gen Z/Alpha) group (50%), primarily speaking French or English.
- Domestic travelers account for 64.1% of guests.
- Key international markets include France (64.1%) and Guadeloupe (11.2%).
- Top languages spoken are French (47.1%) followed by English (33.1%).
- A significant demographic segment is the Post-2000s (Gen Z/Alpha) group, representing 50% of guests.
Recommendations for Hosts
- Target domestic marketing efforts towards travelers from Paris and Montreal.
- Tailor amenities and listing descriptions to appeal to the dominant Post-2000s (Gen Z/Alpha) demographic (e.g., highlight fast WiFi, smart home features, local guides).
- Highlight unique local experiences or amenities relevant to the primary guest profile.
- Consider seasonal promotions aligned with peak travel times for key origin markets.
Nearby Short-Term Rental Market Comparison
How does the Le Moule Airbnb market stack up against its neighbors? Compare key performance metrics like average monthly revenue, ADR, and occupancy rates in surrounding areas to understand the broader regional STR landscape.
| Market | Active Properties | Monthly Revenue | Daily Rate | Avg. Occupancy |
|---|---|---|---|---|
| Saint Barthélemy | 769 | $5,753 | $1511.68 | 32% |
| Fleming Estate | 15 | $5,216 | $507.12 | 45% |
| Christian Hill | 10 | $3,909 | $474.96 | 33% |
| Bolans | 84 | $3,806 | $472.95 | 37% |
| The Valley | 34 | $3,614 | $655.08 | 35% |
| Crosbies | 20 | $2,938 | $511.77 | 34% |
| Blue Waters | 30 | $2,821 | $233.45 | 49% |
| Saint John | 11 | $2,813 | $226.80 | 48% |
| Jolly Harbour | 98 | $2,543 | $313.89 | 37% |
| Falmouth | 31 | $2,435 | $350.44 | 46% |