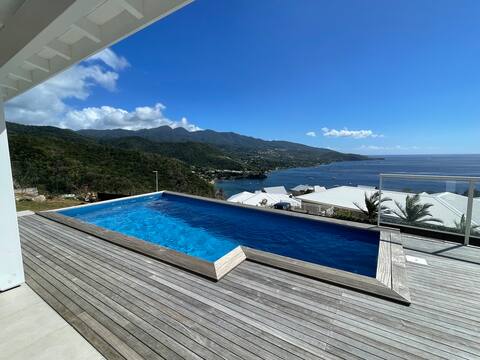
Bouillante Airbnb Market Analysis 2025: Short Term Rental Data & Vacation Rental Statistics in Guadeloupe, France
Is Airbnb profitable in Bouillante in 2025? Explore comprehensive Airbnb analytics for Bouillante, Guadeloupe, France to uncover income potential. This 2025 STR market report for Bouillante, based on AirROI data from April 2024 to March 2025, reveals key trends in the market of 442 active listings.
Whether you're considering an Airbnb investment in Bouillante, optimizing your existing vacation rental, or exploring rental arbitrage opportunities, understanding the Bouillante Airbnb data is crucial. Leveraging the low regulation environment is key to maximizing your short term rental income potential. Let's dive into the specifics.
Key Bouillante Airbnb Performance Metrics Overview
Monthly Airbnb Revenue Variations & Income Potential in Bouillante (2025)
Understanding the monthly revenue variations for Airbnb listings in Bouillante is key to maximizing your short term rental income potential. Seasonality significantly impacts earnings. Our analysis, based on data from the past 12 months, shows that the peak revenue month for STRs in Bouillante is typically January, while September often presents the lowest earnings, highlighting opportunities for strategic pricing adjustments during shoulder and low seasons. Explore the typical Airbnb income in Bouillante across different performance tiers:
- Best-in-class properties (Top 10%) achieve $4,237+ monthly, often utilizing dynamic pricing and superior guest experiences.
- Strong performing properties (Top 25%) earn $2,506 or more, indicating effective management and desirable locations/amenities.
- Typical properties (Median) generate around $1,438 per month, representing the average market performance.
- Entry-level properties (Bottom 25%) see earnings around $770, often with potential for optimization.
Average Monthly Airbnb Earnings Trend in Bouillante
Bouillante Airbnb Occupancy Rate Trends (2025)
Maximize your bookings by understanding the Bouillante STR occupancy trends. Seasonal demand shifts significantly influence how often properties are booked. Typically, Februarysees the highest demand (peak season occupancy), while September experiences the lowest (low season). Effective strategies, like adjusting minimum stays or offering promotions, can boost occupancy during slower periods. Here's how different property tiers perform in Bouillante:
- Best-in-class properties (Top 10%) achieve 83%+ occupancy, indicating high desirability and potentially optimized availability.
- Strong performing properties (Top 25%) maintain 68% or higher occupancy, suggesting good market fit and guest satisfaction.
- Typical properties (Median) have an occupancy rate around 47%.
- Entry-level properties (Bottom 25%) average 25% occupancy, potentially facing higher vacancy.
Average Monthly Occupancy Rate Trend in Bouillante
Average Daily Rate (ADR) Airbnb Trends in Bouillante (2025)
Effective short term rental pricing strategy in Bouillante involves understanding monthly ADR fluctuations. The Average Daily Rate (ADR) for Airbnb in Bouillante typically peaks in January and dips lowest during September. Leveraging Airbnb dynamic pricing tools or strategies based on this seasonality can significantly boost revenue. Here's a look at the typical nightly rates achieved:
- Best-in-class properties (Top 10%) command rates of $236+ per night, often due to premium features or locations.
- Strong performing properties (Top 25%) achieve nightly rates of $151 or more.
- Typical properties (Median) charge around $99 per night.
- Entry-level properties (Bottom 25%) earn around $73 per night.
Average Daily Rate (ADR) Trend by Month in Bouillante
Get Live Bouillante Market Intelligence 👇

Explore Real-time Analytics
Airbnb Seasonality Analysis & Trends in Bouillante (2025)
Peak Season (January, February, April)
- Revenue averages $2,763 per month
- Occupancy rates average 66.1%
- Daily rates average $135
Shoulder Season
- Revenue averages $1,927 per month
- Occupancy maintains around 44.3%
- Daily rates hold near $130
Low Season (August, September, October)
- Revenue drops to average $1,353 per month
- Occupancy decreases to average 33.8%
- Daily rates adjust to average $122
Seasonality Insights for Bouillante
- The Airbnb seasonality in Bouillante shows highly seasonal trends requiring careful strategy. While the sections above show seasonal averages, it's also insightful to look at the extremes:
- During the high season, the absolute peak month showcases Bouillante's highest earning potential, with monthly revenues capable of climbing to $2,954, occupancy reaching a high of 72.4%, and ADRs peaking at $140.
- Conversely, the slowest single month of the year, typically falling within the low season, marks the market's lowest point. In this month, revenue might dip to $1,178, occupancy could drop to 29.8%, and ADRs may adjust down to $121.
- Understanding both the seasonal averages and these monthly peaks and troughs in revenue, occupancy, and ADR is crucial for maximizing your Airbnb profit potential in Bouillante.
Seasonal Strategies for Maximizing Profit
- Peak Season: Maximize revenue through premium pricing and potentially longer minimum stays. Ensure high availability.
- Low Season: Offer competitive pricing, special promotions (e.g., extended stay discounts), and flexible cancellation policies. Target off-season travelers like remote workers or budget-conscious guests.
- Shoulder Seasons: Implement dynamic pricing that balances peak and low rates. Target weekend travelers or specific events. Offer slightly more flexible terms than peak season.
- Regularly analyze your own performance against these Bouillante seasonality benchmarks and adjust your pricing and availability strategy accordingly.
Best Areas for Airbnb Investment in Bouillante (2025)
Exploring the top neighborhoods for short-term rentals in Bouillante? This section highlights key areas, outlining why they are attractive for hosts and guests, along with notable local attractions. Consider these locations based on your target guest profile and investment strategy.
| Neighborhood / Area | Why Host Here? (Target Guests & Appeal) | Key Attractions & Landmarks |
|---|---|---|
| Bouillante Beach | A beautiful beach location known for its hot springs and warm waters, making it a favorite among tourists looking for relaxation and wellness. | Les Bains de Bouillante, Plage de Malendure, Aquaculture Park, Cousteau Reserve, Scuba diving tours |
| Anse à la Barque | A picturesque bay that offers stunning views and is a great spot for water sports. Its calm waters attract families and adventure seekers. | Anse à la Barque Beach, Kayaking, Snorkeling, Local dining spots, Nature trails |
| Pointe-Noire | Close to Bouillante, it offers a charming village feel with access to natural parks and hiking trails, appealing to eco-tourists and nature lovers. | Parc Naturel de la Guadeloupe, Plantation Grand Café, Ti-Guadeloupe, Hiking trails, Local craft markets |
| Ravine Claire | Ideal for those looking to explore the lush interior of Guadeloupe, popular with tourists who want to experience local culture and nature. | Local farms, Nature walks, Cultural festivals, Traditional Guadeloupean music, Community events |
| Malendure | Famous for its accessibility to the Cousteau Marine Reserve, it draws snorkelers and divers from around the world, making it a prime location for vacation rentals. | Cousteau Marine Reserve, Malendure Beach, Diving schools, Boat tours, Wildlife viewing |
| Baie-Mahault | A bustling district with shopping, dining, and cultural experiences, perfect for those who want to be close to urban conveniences while enjoying the island lifestyle. | Centre Commercial La Galleria, Local markets, Cultural center, Restaurants, Night markets |
| Deshaies | Known for its botanical garden and beautiful beaches, it's a scenic area that attracts tourists seeking a more relaxed, tranquil experience in nature. | Deshaies Botanical Garden, Plage de Grande Anse, Fishing village charm, Snorkeling spots, Local seafood |
| Gosier | A vibrant area known for its nightlife, dining, and beautiful beaches, attractive to younger travelers looking for a lively atmosphere. | La Isla de Gosier, Beach clubs, Nightlife, Restaurants, Water activities |
Understanding Airbnb License Requirements & STR Laws in Bouillante (2025)
While Bouillante, Guadeloupe, France currently shows low STR regulations, specific Airbnb license requirements might still exist or change. Always verify the latest short term rental regulations and Airbnb license requirements directly with local government authorities for Bouillante to ensure full compliance before hosting.
(Source: AirROI data, 2025, based on 0% licensed listings)
Top Performing Airbnb Properties in Bouillante (2025)
Benchmark your potential! Explore examples of top-performing Airbnb properties in Bouillantebased on Trailing Twelve Month (TTM) revenue. Analyze their characteristics, revenue, occupancy rate, and ADR to understand what drives success in this market.
Beautiful luxury villa 3ch + sunset
Entire Place • 3 bedrooms

Villa with panoramic sea view
Entire Place • 3 bedrooms
Wonderful land and sea view - 3 bedroom villa
Entire Place • 3 bedrooms
5* **** sea view villa with mirror pool
Entire Place • 3 bedrooms
5* **** sea view villa with mirror pool
Entire Place • 3 bedrooms
Villa Detente
Entire Place • 4 bedrooms
Note: Performance varies based on location, size, amenities, seasonality, and management quality. Data reflects the past 12 months.
Top Performing Airbnb Hosts in Bouillante (2025)
Learn from the best! This table showcases top-performing Airbnb hosts in Bouillante based on the number of properties managed and estimated total revenue over the past year. Analyze their scale and performance metrics.
| Host Name | Properties | Grossing Revenue | Stay Reviews | Avg Rating |
|---|---|---|---|---|
| Emilie | 9 | $362,343 | 342 | 4.88/5.0 |
| Lorraine & Tristan | 4 | $231,579 | 34 | 4.97/5.0 |
| Stéphane | 3 | $200,875 | 23 | 5.00/5.0 |
| Sunset Villas | 3 | $194,578 | 77 | 4.89/5.0 |
| Julie | 4 | $167,165 | 235 | 4.96/5.0 |
| Xavier | 6 | $161,710 | 426 | 4.85/5.0 |
| Victoria | 5 | $125,114 | 388 | 4.78/5.0 |
| Jo | 4 | $116,824 | 71 | 4.97/5.0 |
| Vanessa | 4 | $115,659 | 263 | 4.89/5.0 |
| Mickael | 1 | $104,772 | 6 | 5.00/5.0 |
Analyzing the strategies of top hosts, such as their property selection, pricing, and guest communication, can offer valuable lessons for optimizing your own Airbnb operations in Bouillante.
Dive Deeper: Advanced Bouillante STR Market Data (2025)
Ready to unlock more insights? AirROI provides access to advanced metrics and comprehensive Airbnb data for Bouillante. Explore detailed analytics beyond this report to refine your investment strategy, optimize pricing, and maximize your vacation rental profits.
Explore Advanced MetricsBouillante Short-Term Rental Market Composition (2025): Property & Room Types
Room Type Distribution
Property Type Distribution
Market Composition Insights for Bouillante
- The Bouillante Airbnb market composition is heavily skewed towards Entire Home/Apt listings, which make up 94.1% of the 442 active rentals. This indicates strong guest preference for privacy and space.
- Looking at the property type distribution in Bouillante, House properties are the most common (64.5%), reflecting the local real estate landscape.
- Houses represent a significant 64.5% portion, catering likely to families or larger groups.
- Smaller segments like outdoor/unique, hotel/boutique, unique stays, others (combined 8.4%) offer potential for unique stay experiences.
Bouillante Airbnb Room Capacity Analysis (2025): Bedroom Distribution
Distribution of Listings by Number of Bedrooms
Room Capacity Insights for Bouillante
- The dominant room capacity in Bouillante is 1 bedroom listings, making up 36.4% of the market. This suggests a strong demand for properties suitable for couples or solo travelers.
- Together, 1 bedroom and 2 bedrooms properties represent 71.7% of the active Airbnb listings in Bouillante, indicating a high concentration in these sizes.
- A significant 22.5% of listings offer 3+ bedrooms, catering to larger groups and families seeking more space in Bouillante.
Bouillante Vacation Rental Guest Capacity Trends (2025)
Distribution of Listings by Guest Capacity
Guest Capacity Insights for Bouillante
- The most common guest capacity trend in Bouillante vacation rentals is listings accommodating 4 guests (30.5%). This suggests the primary traveler segment is likely small families or groups.
- Properties designed for 4 guests and 2 guests dominate the Bouillante STR market, accounting for 57.0% of listings.
- 29.2% of properties accommodate 6+ guests, serving the market segment for larger families or group travel in Bouillante.
- On average, properties in Bouillante are equipped to host 4.1 guests.
Bouillante Airbnb Booking Patterns (2025): Available vs. Booked Days
Available Days Distribution
Booked Days Distribution
Booking Pattern Insights for Bouillante
- The most common availability pattern in Bouillante falls within the 271-366 days range, representing 39.8% of listings. This suggests many properties have significant open periods on their calendars.
- Approximately 73.3% of listings show high availability (181+ days open annually), indicating potential for increased bookings or specific owner usage patterns.
- For booked days, the 91-180 days range is most frequent in Bouillante (33.5%), reflecting common guest stay durations or potential owner blocking patterns.
- A notable 28.0% of properties secure long booking periods (181+ days booked per year), highlighting successful long-term rental strategies or significant owner usage.
Bouillante Airbnb Minimum Stay Requirements Analysis
Distribution of Listings by Minimum Night Requirement
1 Night
20 listings
4.7% of total
2 Nights
56 listings
13.2% of total
3 Nights
78 listings
18.4% of total
4-6 Nights
188 listings
44.2% of total
7-29 Nights
22 listings
5.2% of total
30+ Nights
61 listings
14.4% of total
Key Insights
- The most prevalent minimum stay requirement in Bouillante is 4-6 Nights, adopted by 44.2% of listings. This highlights the market's preference for longer commitments.
- Very short stays (1-2 nights) are less common (17.9%), suggesting hosts prefer slightly longer bookings to optimize turnover.
- A significant segment (14.4%) caters to monthly stays (30+ nights) in Bouillante, pointing to opportunities in the extended-stay market.
Recommendations
- Align with the market by considering a 4-6 Nights minimum stay, as 44.2% of Bouillante hosts use this setting.
- If feasible, allowing 1-night stays, especially midweek or during low season, could capture last-minute bookings, as only 4.7% currently do.
- Explore offering discounts for stays of 30+ nights to attract the 14.4% of the market seeking extended stays.
- Adjust minimum nights based on seasonality – potentially shorter during low season and longer during peak demand periods in Bouillante.
Bouillante Airbnb Cancellation Policy Trends Analysis (2025)
Flexible
103 listings
27.2% of total
Moderate
94 listings
24.9% of total
Firm
96 listings
25.4% of total
Strict
85 listings
22.5% of total
Cancellation Policy Insights for Bouillante
- The prevailing Airbnb cancellation policy trend in Bouillante is Flexible, used by 27.2% of listings.
- There's a relatively balanced mix between guest-friendly (52.1%) and stricter (47.9%) policies, offering choices for different guest needs.
Recommendations for Hosts
- Consider adopting a Flexible policy to align with the 27.2% market standard in Bouillante.
- Regularly review your cancellation policy against competitors and market demand shifts in Bouillante.
Bouillante STR Booking Lead Time Analysis (2025)
Average Booking Lead Time by Month
Booking Lead Time Insights for Bouillante
- The overall average booking lead time for vacation rentals in Bouillante is 84 days.
- Guests book furthest in advance for stays during February (average 121 days), likely coinciding with peak travel demand or local events.
- The shortest booking windows occur for stays in September (average 62 days), indicating more last-minute travel plans during this time.
- Seasonally, Winter (107 days avg.) sees the longest lead times, while Fall (72 days avg.) has the shortest, reflecting typical travel planning cycles.
Recommendations for Hosts
- Use the overall average lead time (84 days) as a baseline for your pricing and availability strategy in Bouillante.
- For February stays, consider implementing length-of-stay discounts or slightly higher rates for bookings made less than 121 days out to capitalize on advance planning.
- Target marketing efforts for the Winter season well in advance (at least 107 days) to capture early planners.
- Monitor your own booking lead times against these Bouillante averages to identify opportunities for dynamic pricing adjustments.
Popular & Essential Airbnb Amenities in Bouillante (2025)
Amenity Prevalence
Amenity Insights for Bouillante
- Essential amenities in Bouillante that guests expect include: Kitchen, Wifi, Free parking on premises. Lacking these (any) could significantly impact bookings.
- Popular amenities like Essentials, Hot water, Air conditioning are common but not universal. Offering these can provide a competitive edge.
Recommendations for Hosts
- Ensure your listing includes all essential amenities for Bouillante: Kitchen, Wifi, Free parking on premises.
- Prioritize adding missing essentials: Kitchen, Wifi, Free parking on premises.
- Consider adding popular differentiators like Essentials or Hot water to increase appeal.
- Highlight unique or less common amenities you offer (e.g., hot tub, dedicated workspace, EV charger) in your listing description and photos.
- Regularly check competitor amenities in Bouillante to stay competitive.
Bouillante Airbnb Guest Demographics & Profile Analysis (2025)
Guest Profile Summary for Bouillante
- The typical guest profile for Airbnb in Bouillante consists of primarily domestic travelers (69%), often arriving from nearby Paris, typically belonging to the Post-2000s (Gen Z/Alpha) group (50%), primarily speaking French or English.
- Domestic travelers account for 69.3% of guests.
- Key international markets include France (69.3%) and Canada (13.3%).
- Top languages spoken are French (45.8%) followed by English (35.1%).
- A significant demographic segment is the Post-2000s (Gen Z/Alpha) group, representing 50% of guests.
Recommendations for Hosts
- Target domestic marketing efforts towards travelers from Paris and Montreal.
- Tailor amenities and listing descriptions to appeal to the dominant Post-2000s (Gen Z/Alpha) demographic (e.g., highlight fast WiFi, smart home features, local guides).
- Highlight unique local experiences or amenities relevant to the primary guest profile.
- Consider seasonal promotions aligned with peak travel times for key origin markets.
Nearby Short-Term Rental Market Comparison
How does the Bouillante Airbnb market stack up against its neighbors? Compare key performance metrics like average monthly revenue, ADR, and occupancy rates in surrounding areas to understand the broader regional STR landscape.
| Market | Active Properties | Monthly Revenue | Daily Rate | Avg. Occupancy |
|---|---|---|---|---|
| Saint Barthélemy | 769 | $5,753 | $1511.68 | 32% |
| Fleming Estate | 15 | $5,216 | $507.12 | 45% |
| Christian Hill | 10 | $3,909 | $474.96 | 33% |
| Bolans | 84 | $3,806 | $472.95 | 37% |
| The Valley | 34 | $3,614 | $655.08 | 35% |
| Crosbies | 20 | $2,938 | $511.77 | 34% |
| Blue Waters | 30 | $2,821 | $233.45 | 49% |
| Saint John | 11 | $2,813 | $226.80 | 48% |
| Jolly Harbour | 98 | $2,543 | $313.89 | 37% |
| Falmouth | 31 | $2,435 | $350.44 | 46% |