Yutz Airbnb Market Analysis 2025: Short Term Rental Data & Vacation Rental Statistics in Grand Est, France
Is Airbnb profitable in Yutz in 2025? Explore comprehensive Airbnb analytics for Yutz, Grand Est, France to uncover income potential. This 2025 STR market report for Yutz, based on AirROI data from April 2024 to March 2025, reveals key trends in the niche market of 43 active listings.
Whether you're considering an Airbnb investment in Yutz, optimizing your existing vacation rental, or exploring rental arbitrage opportunities, understanding the Yutz Airbnb data is crucial. Leveraging the low regulation environment is key to maximizing your short term rental income potential. Let's dive into the specifics.
Key Yutz Airbnb Performance Metrics Overview
Monthly Airbnb Revenue Variations & Income Potential in Yutz (2025)
Understanding the monthly revenue variations for Airbnb listings in Yutz is key to maximizing your short term rental income potential. Seasonality significantly impacts earnings. Our analysis, based on data from the past 12 months, shows that the peak revenue month for STRs in Yutz is typically May, while March often presents the lowest earnings, highlighting opportunities for strategic pricing adjustments during shoulder and low seasons. Explore the typical Airbnb income in Yutz across different performance tiers:
- Best-in-class properties (Top 10%) achieve $1,719+ monthly, often utilizing dynamic pricing and superior guest experiences.
- Strong performing properties (Top 25%) earn $1,151 or more, indicating effective management and desirable locations/amenities.
- Typical properties (Median) generate around $714 per month, representing the average market performance.
- Entry-level properties (Bottom 25%) see earnings around $373, often with potential for optimization.
Average Monthly Airbnb Earnings Trend in Yutz
Yutz Airbnb Occupancy Rate Trends (2025)
Maximize your bookings by understanding the Yutz STR occupancy trends. Seasonal demand shifts significantly influence how often properties are booked. Typically, Februarysees the highest demand (peak season occupancy), while March experiences the lowest (low season). Effective strategies, like adjusting minimum stays or offering promotions, can boost occupancy during slower periods. Here's how different property tiers perform in Yutz:
- Best-in-class properties (Top 10%) achieve 85%+ occupancy, indicating high desirability and potentially optimized availability.
- Strong performing properties (Top 25%) maintain 70% or higher occupancy, suggesting good market fit and guest satisfaction.
- Typical properties (Median) have an occupancy rate around 49%.
- Entry-level properties (Bottom 25%) average 22% occupancy, potentially facing higher vacancy.
Average Monthly Occupancy Rate Trend in Yutz
Average Daily Rate (ADR) Airbnb Trends in Yutz (2025)
Effective short term rental pricing strategy in Yutz involves understanding monthly ADR fluctuations. The Average Daily Rate (ADR) for Airbnb in Yutz typically peaks in November and dips lowest during February. Leveraging Airbnb dynamic pricing tools or strategies based on this seasonality can significantly boost revenue. Here's a look at the typical nightly rates achieved:
- Best-in-class properties (Top 10%) command rates of $95+ per night, often due to premium features or locations.
- Strong performing properties (Top 25%) achieve nightly rates of $61 or more.
- Typical properties (Median) charge around $47 per night.
- Entry-level properties (Bottom 25%) earn around $38 per night.
Average Daily Rate (ADR) Trend by Month in Yutz
Get Live Yutz Market Intelligence 👇

Explore Real-time Analytics
Airbnb Seasonality Analysis & Trends in Yutz (2025)
Peak Season (May, November, April)
- Revenue averages $1,118 per month
- Occupancy rates average 50.5%
- Daily rates average $54
Shoulder Season
- Revenue averages $906 per month
- Occupancy maintains around 50.4%
- Daily rates hold near $54
Low Season (March, September, October)
- Revenue drops to average $674 per month
- Occupancy decreases to average 39.2%
- Daily rates adjust to average $54
Seasonality Insights for Yutz
- The Airbnb seasonality in Yutz shows highly seasonal trends requiring careful strategy. While the sections above show seasonal averages, it's also insightful to look at the extremes:
- During the high season, the absolute peak month showcases Yutz's highest earning potential, with monthly revenues capable of climbing to $1,240, occupancy reaching a high of 56.3%, and ADRs peaking at $56.
- Conversely, the slowest single month of the year, typically falling within the low season, marks the market's lowest point. In this month, revenue might dip to $516, occupancy could drop to 34.3%, and ADRs may adjust down to $53.
- Understanding both the seasonal averages and these monthly peaks and troughs in revenue, occupancy, and ADR is crucial for maximizing your Airbnb profit potential in Yutz.
Seasonal Strategies for Maximizing Profit
- Peak Season: Maximize revenue through premium pricing and potentially longer minimum stays. Ensure high availability.
- Low Season: Offer competitive pricing, special promotions (e.g., extended stay discounts), and flexible cancellation policies. Target off-season travelers like remote workers or budget-conscious guests.
- Shoulder Seasons: Implement dynamic pricing that balances peak and low rates. Target weekend travelers or specific events. Offer slightly more flexible terms than peak season.
- Regularly analyze your own performance against these Yutz seasonality benchmarks and adjust your pricing and availability strategy accordingly.
Best Areas for Airbnb Investment in Yutz (2025)
Exploring the top neighborhoods for short-term rentals in Yutz? This section highlights key areas, outlining why they are attractive for hosts and guests, along with notable local attractions. Consider these locations based on your target guest profile and investment strategy.
| Neighborhood / Area | Why Host Here? (Target Guests & Appeal) | Key Attractions & Landmarks |
|---|---|---|
| Yutz Center | The heart of Yutz, offering a mix of commercial activity and residential charm. It's close to public transport and has a variety of shops and cafes, making it attractive for visitors. | Yutz Park, City Hall, Café de Paris, Local Markets, Cultural Festivals |
| Near the Moselle River | Scenic area along the Moselle River with beautiful views and walking paths. Ideal for nature lovers and guests looking for a peaceful retreat close to nature. | Moselle River Walk, Botanical Gardens, Cycling Paths, Fishing Spots, Scenic Picnicking Areas |
| Fort de Guentrange | Historical site with a fortress and green spaces. Attracts history buffs and families looking for open areas to explore and learn about local history. | Fort de Guentrange, History Exhibits, Walking Trails, Picnic Areas, Local History Tours |
| Yutz Industrial Zone | While primarily industrial, this area attracts business travelers due to its proximity to local companies and business establishments. | Local Businesses, Business Conferences, Food Trucks, Networking Events, Industry Events |
| Cultural Center Area | Home to cultural institutions and event spaces, this area draws visitors interested in arts, music, and community events. | Cultural Center, Art Exhibits, Live Music Venues, Workshops, Community Events |
| Family-friendly Suburbs | Residential neighborhoods that are safe and welcoming to families. Great for those traveling with children and looking for comfortable, home-like stays. | Playgrounds, Local Schools, Family Restaurants, Community Parks, Family Events |
| Nearby Thionville | Thionville is just a short distance away and offers additional attractions and amenities, making it a great option for visitors looking to explore nearby cities. | Thionville Fortress, Shopping Centers, Restaurants, Events at the Local Theater, Cultural Festivals |
| Café and Dining District | An area known for its cafés and dining options, attracting food lovers and those looking to experience local cuisine. | Local Cafés, Bakeries, Gourmet Restaurants, Wine Tasting, Food Festivals |
Understanding Airbnb License Requirements & STR Laws in Yutz (2025)
While Yutz, Grand Est, France currently shows low STR regulations, specific Airbnb license requirements might still exist or change. Always verify the latest short term rental regulations and Airbnb license requirements directly with local government authorities for Yutz to ensure full compliance before hosting.
(Source: AirROI data, 2025, finding no licensed listings among those analyzed)
Top Performing Airbnb Properties in Yutz (2025)
Benchmark your potential! Explore examples of top-performing Airbnb properties in Yutzbased on Trailing Twelve Month (TTM) revenue. Analyze their characteristics, revenue, occupancy rate, and ADR to understand what drives success in this market.
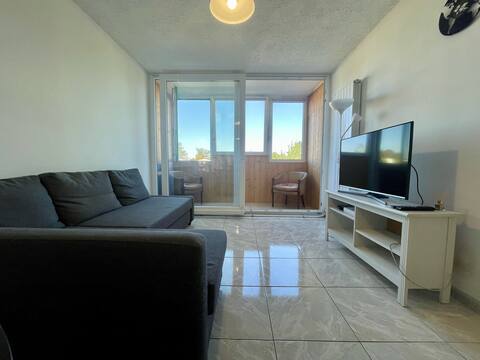
3 bedroom apartment in Yutz
Entire Place • 3 bedrooms
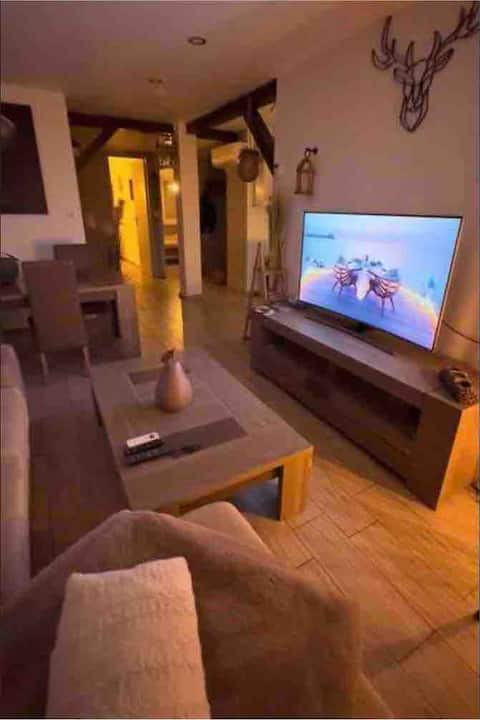
APARTMENT T3 65M² WITH PANORAMIC VIEW
Entire Place • 2 bedrooms
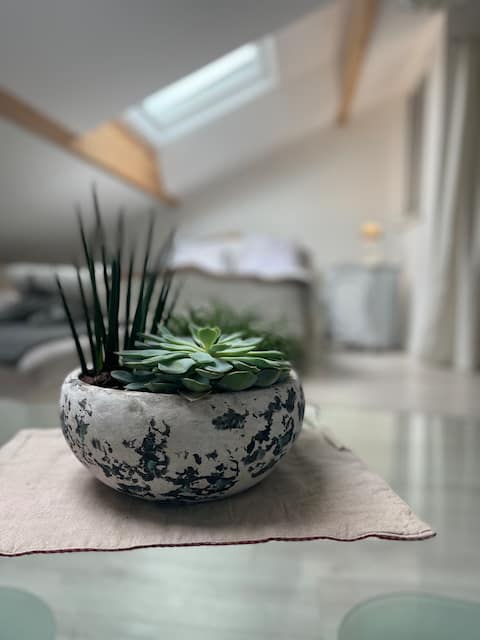
"komm à la maison", independent entrance
Entire Place • 1 bedroom
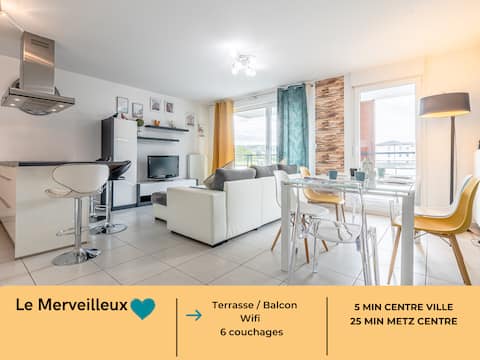
Le Merveilleux ♡ Thionville / Metz / Luxembourg
Entire Place • 2 bedrooms

Furnished cottage 1 to 4 people Yutz, Cattenom, Thionville
Entire Place • 1 bedroom
Appartement bien équipé Yutz
Entire Place • 1 bedroom
Note: Performance varies based on location, size, amenities, seasonality, and management quality. Data reflects the past 12 months.
Top Performing Airbnb Hosts in Yutz (2025)
Learn from the best! This table showcases top-performing Airbnb hosts in Yutz based on the number of properties managed and estimated total revenue over the past year. Analyze their scale and performance metrics.
| Host Name | Properties | Grossing Revenue | Stay Reviews | Avg Rating |
|---|---|---|---|---|
| Palm | 5 | $35,705 | 128 | 4.66/5.0 |
| Yann | 1 | $23,013 | 6 | 4.83/5.0 |
| Mohamed | 1 | $22,281 | 84 | 4.86/5.0 |
| BAZAM Sarl | 5 | $15,972 | 23 | 4.50/5.0 |
| Laurence | 1 | $14,891 | 27 | 5.00/5.0 |
| Nicolas | 5 | $13,104 | 43 | 3.87/5.0 |
| Francois | 2 | $12,413 | 173 | 4.54/5.0 |
| Js | 1 | $12,006 | 48 | 4.83/5.0 |
| Yoann | 1 | $11,842 | 96 | 4.63/5.0 |
| Host #7174207 | 1 | $11,056 | 0 | 0.00/5.0 |
Analyzing the strategies of top hosts, such as their property selection, pricing, and guest communication, can offer valuable lessons for optimizing your own Airbnb operations in Yutz.
Dive Deeper: Advanced Yutz STR Market Data (2025)
Ready to unlock more insights? AirROI provides access to advanced metrics and comprehensive Airbnb data for Yutz. Explore detailed analytics beyond this report to refine your investment strategy, optimize pricing, and maximize your vacation rental profits.
Explore Advanced MetricsYutz Short-Term Rental Market Composition (2025): Property & Room Types
Room Type Distribution
Property Type Distribution
Market Composition Insights for Yutz
- The Yutz Airbnb market composition is heavily skewed towards Entire Home/Apt listings, which make up 65.1% of the 43 active rentals. This indicates strong guest preference for privacy and space.
- However, a notable 34.9% share for Private Rooms suggests opportunities for budget-conscious travelers or hosts renting out spare rooms.
- Looking at the property type distribution in Yutz, Apartment/Condo properties are the most common (74.4%), reflecting the local real estate landscape.
- The presence of 14% Hotel/Boutique listings indicates integration with traditional hospitality.
Yutz Airbnb Room Capacity Analysis (2025): Bedroom Distribution
Distribution of Listings by Number of Bedrooms
Room Capacity Insights for Yutz
- The dominant room capacity in Yutz is 1 bedroom listings, making up 48.8% of the market. This suggests a strong demand for properties suitable for couples or solo travelers.
- Together, 1 bedroom and 2 bedrooms properties represent 62.8% of the active Airbnb listings in Yutz, indicating a high concentration in these sizes.
- Listings with 3+ bedrooms (7.0%) represent a smaller niche, potentially indicating an underserved market for larger group accommodations in Yutz.
Yutz Vacation Rental Guest Capacity Trends (2025)
Distribution of Listings by Guest Capacity
Guest Capacity Insights for Yutz
- The most common guest capacity trend in Yutz vacation rentals is listings accommodating 2 guests (34.9%). This suggests the primary traveler segment is likely couples or solo travelers.
- Properties designed for 2 guests and 4 guests dominate the Yutz STR market, accounting for 48.9% of listings.
- A significant 44.2% of listings cater specifically to 1-2 guests, highlighting strong demand from couples and solo travelers in Yutz.
- On average, properties in Yutz are equipped to host 2.3 guests.
Yutz Airbnb Booking Patterns (2025): Available vs. Booked Days
Available Days Distribution
Booked Days Distribution
Booking Pattern Insights for Yutz
- The most common availability pattern in Yutz falls within the 271-366 days range, representing 53.5% of listings. This suggests many properties have significant open periods on their calendars.
- Approximately 74.4% of listings show high availability (181+ days open annually), indicating potential for increased bookings or specific owner usage patterns.
- For booked days, the 31-90 days range is most frequent in Yutz (37.2%), reflecting common guest stay durations or potential owner blocking patterns.
- A notable 27.9% of properties secure long booking periods (181+ days booked per year), highlighting successful long-term rental strategies or significant owner usage.
Yutz Airbnb Minimum Stay Requirements Analysis
Distribution of Listings by Minimum Night Requirement
1 Night
4 listings
9.5% of total
2 Nights
10 listings
23.8% of total
3 Nights
8 listings
19% of total
4-6 Nights
11 listings
26.2% of total
7-29 Nights
7 listings
16.7% of total
30+ Nights
2 listings
4.8% of total
Key Insights
- The most prevalent minimum stay requirement in Yutz is 4-6 Nights, adopted by 26.2% of listings. This highlights the market's preference for longer commitments.
Recommendations
- Align with the market by considering a 4-6 Nights minimum stay, as 26.2% of Yutz hosts use this setting.
- If feasible, allowing 1-night stays, especially midweek or during low season, could capture last-minute bookings, as only 9.5% currently do.
- Adjust minimum nights based on seasonality – potentially shorter during low season and longer during peak demand periods in Yutz.
Yutz Airbnb Cancellation Policy Trends Analysis (2025)
Non-refundable
1 listings
2.6% of total
Flexible
15 listings
39.5% of total
Moderate
13 listings
34.2% of total
Firm
2 listings
5.3% of total
Strict
7 listings
18.4% of total
Cancellation Policy Insights for Yutz
- The prevailing Airbnb cancellation policy trend in Yutz is Flexible, used by 39.5% of listings.
- The market strongly favors guest-friendly terms, with 73.7% of listings offering Flexible or Moderate policies. This suggests guests in Yutz may expect booking flexibility.
Recommendations for Hosts
- Consider adopting a Flexible policy to align with the 39.5% market standard in Yutz.
- Regularly review your cancellation policy against competitors and market demand shifts in Yutz.
Yutz STR Booking Lead Time Analysis (2025)
Average Booking Lead Time by Month
Booking Lead Time Insights for Yutz
- The overall average booking lead time for vacation rentals in Yutz is 38 days.
- Guests book furthest in advance for stays during June (average 64 days), likely coinciding with peak travel demand or local events.
- The shortest booking windows occur for stays in September (average 22 days), indicating more last-minute travel plans during this time.
- Seasonally, Summer (48 days avg.) sees the longest lead times, while Winter (38 days avg.) has the shortest, reflecting typical travel planning cycles.
Recommendations for Hosts
- Use the overall average lead time (38 days) as a baseline for your pricing and availability strategy in Yutz.
- For June stays, consider implementing length-of-stay discounts or slightly higher rates for bookings made less than 64 days out to capitalize on advance planning.
- Target marketing efforts for the Summer season well in advance (at least 48 days) to capture early planners.
- Monitor your own booking lead times against these Yutz averages to identify opportunities for dynamic pricing adjustments.
Popular & Essential Airbnb Amenities in Yutz (2025)
Amenity Prevalence
Amenity Insights for Yutz
- Essential amenities in Yutz that guests expect include: Wifi, Heating, Kitchen, Free parking on premises. Lacking these (any) could significantly impact bookings.
- Popular amenities like TV, Cooking basics, Washer are common but not universal. Offering these can provide a competitive edge.
Recommendations for Hosts
- Ensure your listing includes all essential amenities for Yutz: Wifi, Heating, Kitchen, Free parking on premises.
- Prioritize adding missing essentials: Heating, Kitchen, Free parking on premises.
- Consider adding popular differentiators like TV or Cooking basics to increase appeal.
- Highlight unique or less common amenities you offer (e.g., hot tub, dedicated workspace, EV charger) in your listing description and photos.
- Regularly check competitor amenities in Yutz to stay competitive.
Yutz Airbnb Guest Demographics & Profile Analysis (2025)
Guest Profile Summary for Yutz
- The typical guest profile for Airbnb in Yutz consists of primarily domestic travelers (70%), often arriving from nearby Paris, typically belonging to the Post-2000s (Gen Z/Alpha) group (50%), primarily speaking French or English.
- Domestic travelers account for 69.5% of guests.
- Key international markets include France (69.5%) and Netherlands (12.5%).
- Top languages spoken are French (31.3%) followed by English (30.6%).
- A significant demographic segment is the Post-2000s (Gen Z/Alpha) group, representing 50% of guests.
Recommendations for Hosts
- Target domestic marketing efforts towards travelers from Paris and Strasbourg.
- Tailor amenities and listing descriptions to appeal to the dominant Post-2000s (Gen Z/Alpha) demographic (e.g., highlight fast WiFi, smart home features, local guides).
- Highlight unique local experiences or amenities relevant to the primary guest profile.
- Consider seasonal promotions aligned with peak travel times for key origin markets.
Nearby Short-Term Rental Market Comparison
How does the Yutz Airbnb market stack up against its neighbors? Compare key performance metrics like average monthly revenue, ADR, and occupancy rates in surrounding areas to understand the broader regional STR landscape.
| Market | Active Properties | Monthly Revenue | Daily Rate | Avg. Occupancy |
|---|---|---|---|---|
| Ittenheim | 19 | $3,672 | $228.19 | 45% |
| Furdenheim | 16 | $3,576 | $330.05 | 50% |
| Ondenval | 10 | $3,432 | $235.00 | 45% |
| Aubel | 33 | $3,418 | $244.77 | 44% |
| Saint-Hubert | 28 | $3,414 | $294.66 | 41% |
| Samrée | 16 | $3,330 | $366.11 | 30% |
| Bertogne | 30 | $3,297 | $296.96 | 38% |
| Wellin | 12 | $3,084 | $202.34 | 42% |
| Le Valtin | 18 | $3,072 | $289.72 | 38% |
| Griesheim-près-Molsheim | 19 | $3,065 | $263.48 | 41% |