Ventron Airbnb Market Analysis 2025: Short Term Rental Data & Vacation Rental Statistics in Grand Est, France
Is Airbnb profitable in Ventron in 2025? Explore comprehensive Airbnb analytics for Ventron, Grand Est, France to uncover income potential. This 2025 STR market report for Ventron, based on AirROI data from April 2024 to March 2025, reveals key trends in the niche market of 82 active listings.
Whether you're considering an Airbnb investment in Ventron, optimizing your existing vacation rental, or exploring rental arbitrage opportunities, understanding the Ventron Airbnb data is crucial. Understanding the local regulations is key to maximizing your short term rental income potential. Let's dive into the specifics.
Key Ventron Airbnb Performance Metrics Overview
Monthly Airbnb Revenue Variations & Income Potential in Ventron (2025)
Understanding the monthly revenue variations for Airbnb listings in Ventron is key to maximizing your short term rental income potential. Seasonality significantly impacts earnings. Our analysis, based on data from the past 12 months, shows that the peak revenue month for STRs in Ventron is typically August, while March often presents the lowest earnings, highlighting opportunities for strategic pricing adjustments during shoulder and low seasons. Explore the typical Airbnb income in Ventron across different performance tiers:
- Best-in-class properties (Top 10%) achieve $9,064+ monthly, often utilizing dynamic pricing and superior guest experiences.
- Strong performing properties (Top 25%) earn $4,670 or more, indicating effective management and desirable locations/amenities.
- Typical properties (Median) generate around $2,134 per month, representing the average market performance.
- Entry-level properties (Bottom 25%) see earnings around $1,010, often with potential for optimization.
Average Monthly Airbnb Earnings Trend in Ventron
Ventron Airbnb Occupancy Rate Trends (2025)
Maximize your bookings by understanding the Ventron STR occupancy trends. Seasonal demand shifts significantly influence how often properties are booked. Typically, Augustsees the highest demand (peak season occupancy), while November experiences the lowest (low season). Effective strategies, like adjusting minimum stays or offering promotions, can boost occupancy during slower periods. Here's how different property tiers perform in Ventron:
- Best-in-class properties (Top 10%) achieve 68%+ occupancy, indicating high desirability and potentially optimized availability.
- Strong performing properties (Top 25%) maintain 50% or higher occupancy, suggesting good market fit and guest satisfaction.
- Typical properties (Median) have an occupancy rate around 32%.
- Entry-level properties (Bottom 25%) average 19% occupancy, potentially facing higher vacancy.
Average Monthly Occupancy Rate Trend in Ventron
Average Daily Rate (ADR) Airbnb Trends in Ventron (2025)
Effective short term rental pricing strategy in Ventron involves understanding monthly ADR fluctuations. The Average Daily Rate (ADR) for Airbnb in Ventron typically peaks in December and dips lowest during April. Leveraging Airbnb dynamic pricing tools or strategies based on this seasonality can significantly boost revenue. Here's a look at the typical nightly rates achieved:
- Best-in-class properties (Top 10%) command rates of $559+ per night, often due to premium features or locations.
- Strong performing properties (Top 25%) achieve nightly rates of $360 or more.
- Typical properties (Median) charge around $169 per night.
- Entry-level properties (Bottom 25%) earn around $108 per night.
Average Daily Rate (ADR) Trend by Month in Ventron
Get Live Ventron Market Intelligence 👇

Explore Real-time Analytics
Airbnb Seasonality Analysis & Trends in Ventron (2025)
Peak Season (August, May, December)
- Revenue averages $4,649 per month
- Occupancy rates average 46.5%
- Daily rates average $269
Shoulder Season
- Revenue averages $3,482 per month
- Occupancy maintains around 35.3%
- Daily rates hold near $262
Low Season (January, March, November)
- Revenue drops to average $2,520 per month
- Occupancy decreases to average 28.5%
- Daily rates adjust to average $277
Seasonality Insights for Ventron
- The Airbnb seasonality in Ventron shows highly seasonal trends requiring careful strategy. While the sections above show seasonal averages, it's also insightful to look at the extremes:
- During the high season, the absolute peak month showcases Ventron's highest earning potential, with monthly revenues capable of climbing to $5,197, occupancy reaching a high of 57.6%, and ADRs peaking at $290.
- Conversely, the slowest single month of the year, typically falling within the low season, marks the market's lowest point. In this month, revenue might dip to $2,405, occupancy could drop to 26.6%, and ADRs may adjust down to $254.
- Understanding both the seasonal averages and these monthly peaks and troughs in revenue, occupancy, and ADR is crucial for maximizing your Airbnb profit potential in Ventron.
Seasonal Strategies for Maximizing Profit
- Peak Season: Maximize revenue through premium pricing and potentially longer minimum stays. Ensure high availability.
- Low Season: Offer competitive pricing, special promotions (e.g., extended stay discounts), and flexible cancellation policies. Target off-season travelers like remote workers or budget-conscious guests.
- Shoulder Seasons: Implement dynamic pricing that balances peak and low rates. Target weekend travelers or specific events. Offer slightly more flexible terms than peak season.
- Regularly analyze your own performance against these Ventron seasonality benchmarks and adjust your pricing and availability strategy accordingly.
Best Areas for Airbnb Investment in Ventron (2025)
Exploring the top neighborhoods for short-term rentals in Ventron? This section highlights key areas, outlining why they are attractive for hosts and guests, along with notable local attractions. Consider these locations based on your target guest profile and investment strategy.
| Neighborhood / Area | Why Host Here? (Target Guests & Appeal) | Key Attractions & Landmarks |
|---|---|---|
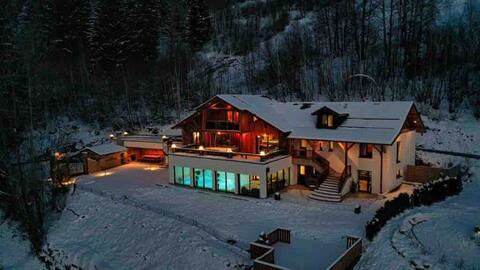
| Ventron Village | A charming alpine village set in the Vosges mountains, popular for skiing, hiking, and nature tourism. Close to ski resorts which attract winter sports enthusiasts. | Ventron Ski Resort, La Bresse Hohneck Ski Area, Vosges Mountains, St. Maurice sur Moselle, Le Markstein, Nature walks and hiking trails |
| Les Hautes-Vosges | A beautiful region known for its natural landscapes and outdoor activities, ideal for tourists looking for relaxation and adventure in nature. | Hiking trails, Ski resorts, Lac de Lispach, Museum of the Mountain, Local wildlife parks |
| Gérardmer | Known as the 'Pearl of the Vosges', this lakeside town is famous for its beautiful lake and outdoor activities, making it a year-round destination. | Lac de Gérardmer, Gérardmer Ski Resort, Casino de Gérardmer, Sentiers de grande randonnée, Local festivals |
| La Bresse | The largest ski area in the Vosges, attracting winter sports enthusiasts and offering plenty of summer activities such as mountain biking and hiking. | La Bresse Ski Resort, Cascades in La Bresse, Mountain biking trails, Local markets, Nature parks |
| Lac de Gérardmer | A stunning lake surrounded by mountains, perfect for water sports in the summer and a popular destination for families. | Water sports, Beaches, Scenic boat tours, Hiking trails, Local restaurants |
| Plombières-les-Bains | A spa town known for its thermal waters and wellness tourism, attracting visitors looking for relaxation and rejuvenation. | Thermal spas, Historical architecture, Nature parks, Hiking areas, Gastronomy |
| Thann | Located at the gateway to the Vosges, Thann has rich history and beautiful vineyards, perfect for wine tourism. | St. Theobald Church, Wine tasting tours, Historic sites, Paths of Discovery, Scenic views |
| Munster | Famous for its cheese and beautiful valley, Munster attracts tourists interested in gastronomy and hiking in stunning natural surroundings. | Munster Cheese, Vallée de Munster, Hiking trails, Local markets, Historic sites |
Understanding Airbnb License Requirements & STR Laws in Ventron (2025)
With 17% of listings showing registration in 2025, understanding potential Airbnb license requirements is crucial in Ventron. Always verify the latest short term rental regulations and Airbnb license requirements directly with local government authorities for Ventron to ensure full compliance before hosting.
(Source: AirROI data, 2025, based on 17% licensed listings)
Top Performing Airbnb Properties in Ventron (2025)
Benchmark your potential! Explore examples of top-performing Airbnb properties in Ventronbased on Trailing Twelve Month (TTM) revenue. Analyze their characteristics, revenue, occupancy rate, and ADR to understand what drives success in this market.

Gîte du Mont d 'Air Ventron 4* in the heart of the massif
Entire Place • 6 bedrooms
Le Lodge à Ventron exceptional property + pool
Entire Place • 5 bedrooms
Chalet Ventron
Entire Place • 4 bedrooms
farm Beaucerf 450 m² 14 pers, spa, sauna
Entire Place • 5 bedrooms

Ferme du Douanier & Spa 5* All Inclusive
Entire Place • 6 bedrooms

Chalet du Kos
Entire Place • 6 bedrooms
Note: Performance varies based on location, size, amenities, seasonality, and management quality. Data reflects the past 12 months.
Top Performing Airbnb Hosts in Ventron (2025)
Learn from the best! This table showcases top-performing Airbnb hosts in Ventron based on the number of properties managed and estimated total revenue over the past year. Analyze their scale and performance metrics.
| Host Name | Properties | Grossing Revenue | Stay Reviews | Avg Rating |
|---|---|---|---|---|
| Estelle | 5 | $212,813 | 44 | 3.90/5.0 |
| Romain | 1 | $160,747 | 28 | 5.00/5.0 |
| Aurore | 2 | $138,760 | 82 | 4.89/5.0 |
| Marjorie | 2 | $133,149 | 62 | 4.95/5.0 |
| Valérie | 1 | $124,904 | 16 | 5.00/5.0 |
| Laetitia | 1 | $124,571 | 35 | 4.97/5.0 |
| Florence | 1 | $121,118 | 8 | 4.88/5.0 |
| Marine | 2 | $107,615 | 179 | 4.95/5.0 |
| Sylviane | 1 | $106,630 | 119 | 4.89/5.0 |
| Anne-Céline Et Dimitri | 1 | $104,229 | 57 | 4.96/5.0 |
Analyzing the strategies of top hosts, such as their property selection, pricing, and guest communication, can offer valuable lessons for optimizing your own Airbnb operations in Ventron.
Dive Deeper: Advanced Ventron STR Market Data (2025)
Ready to unlock more insights? AirROI provides access to advanced metrics and comprehensive Airbnb data for Ventron. Explore detailed analytics beyond this report to refine your investment strategy, optimize pricing, and maximize your vacation rental profits.
Explore Advanced MetricsVentron Short-Term Rental Market Composition (2025): Property & Room Types
Room Type Distribution
Property Type Distribution
Market Composition Insights for Ventron
- The Ventron Airbnb market composition is heavily skewed towards Entire Home/Apt listings, which make up 90.2% of the 82 active rentals. This indicates strong guest preference for privacy and space.
- Looking at the property type distribution in Ventron, House properties are the most common (54.9%), reflecting the local real estate landscape.
- Houses represent a significant 54.9% portion, catering likely to families or larger groups.
- The presence of 11% Hotel/Boutique listings indicates integration with traditional hospitality.
- Smaller segments like outdoor/unique, others (combined 3.6%) offer potential for unique stay experiences.
Ventron Airbnb Room Capacity Analysis (2025): Bedroom Distribution
Distribution of Listings by Number of Bedrooms
Room Capacity Insights for Ventron
- The dominant room capacity in Ventron is 1 bedroom listings, making up 23.2% of the market. This suggests a strong demand for properties suitable for couples or solo travelers.
- Together, 1 bedroom and 3 bedrooms properties represent 46.4% of the active Airbnb listings in Ventron, indicating a high concentration in these sizes.
- A significant 58.6% of listings offer 3+ bedrooms, catering to larger groups and families seeking more space in Ventron.
Ventron Vacation Rental Guest Capacity Trends (2025)
Distribution of Listings by Guest Capacity
Guest Capacity Insights for Ventron
- The most common guest capacity trend in Ventron vacation rentals is listings accommodating 8+ guests (51.2%). This suggests the primary traveler segment is likely larger groups.
- Properties designed for 8+ guests and 6 guests dominate the Ventron STR market, accounting for 67.1% of listings.
- 68.3% of properties accommodate 6+ guests, serving the market segment for larger families or group travel in Ventron.
- On average, properties in Ventron are equipped to host 6.2 guests.
Ventron Airbnb Booking Patterns (2025): Available vs. Booked Days
Available Days Distribution
Booked Days Distribution
Booking Pattern Insights for Ventron
- The most common availability pattern in Ventron falls within the 181-270 days range, representing 43.9% of listings. This suggests many properties have significant open periods on their calendars.
- Approximately 84.1% of listings show high availability (181+ days open annually), indicating potential for increased bookings or specific owner usage patterns.
- For booked days, the 91-180 days range is most frequent in Ventron (45.1%), reflecting common guest stay durations or potential owner blocking patterns.
- A notable 15.9% of properties secure long booking periods (181+ days booked per year), highlighting successful long-term rental strategies or significant owner usage.
Ventron Airbnb Minimum Stay Requirements Analysis
Distribution of Listings by Minimum Night Requirement
1 Night
15 listings
19% of total
2 Nights
19 listings
24.1% of total
3 Nights
8 listings
10.1% of total
4-6 Nights
5 listings
6.3% of total
7-29 Nights
2 listings
2.5% of total
30+ Nights
30 listings
38% of total
Key Insights
- The most prevalent minimum stay requirement in Ventron is 30+ Nights, adopted by 38% of listings. This highlights the market's preference for longer commitments.
- A significant segment (38%) caters to monthly stays (30+ nights) in Ventron, pointing to opportunities in the extended-stay market.
Recommendations
- Align with the market by considering a 30+ Nights minimum stay, as 38% of Ventron hosts use this setting.
- If feasible, allowing 1-night stays, especially midweek or during low season, could capture last-minute bookings, as only 19% currently do.
- Explore offering discounts for stays of 30+ nights to attract the 38% of the market seeking extended stays.
- Adjust minimum nights based on seasonality – potentially shorter during low season and longer during peak demand periods in Ventron.
Ventron Airbnb Cancellation Policy Trends Analysis (2025)
Flexible
7 listings
10% of total
Moderate
15 listings
21.4% of total
Firm
30 listings
42.9% of total
Strict
18 listings
25.7% of total
Cancellation Policy Insights for Ventron
- The prevailing Airbnb cancellation policy trend in Ventron is Firm, used by 42.9% of listings.
- A majority (68.6%) of hosts in Ventron utilize Firm or Strict policies, indicating a market where hosts prioritize booking security.
Recommendations for Hosts
- Consider adopting a Firm policy to align with the 42.9% market standard in Ventron.
- Regularly review your cancellation policy against competitors and market demand shifts in Ventron.
Ventron STR Booking Lead Time Analysis (2025)
Average Booking Lead Time by Month
Booking Lead Time Insights for Ventron
- The overall average booking lead time for vacation rentals in Ventron is 66 days.
- Guests book furthest in advance for stays during December (average 103 days), likely coinciding with peak travel demand or local events.
- The shortest booking windows occur for stays in October (average 46 days), indicating more last-minute travel plans during this time.
- Seasonally, Winter (84 days avg.) sees the longest lead times, while Fall (54 days avg.) has the shortest, reflecting typical travel planning cycles.
Recommendations for Hosts
- Use the overall average lead time (66 days) as a baseline for your pricing and availability strategy in Ventron.
- For December stays, consider implementing length-of-stay discounts or slightly higher rates for bookings made less than 103 days out to capitalize on advance planning.
- Target marketing efforts for the Winter season well in advance (at least 84 days) to capture early planners.
- Monitor your own booking lead times against these Ventron averages to identify opportunities for dynamic pricing adjustments.
Popular & Essential Airbnb Amenities in Ventron (2025)
Amenity Prevalence
Amenity Insights for Ventron
- Essential amenities in Ventron that guests expect include: Heating, Kitchen, Hot water, TV, Smoke alarm. Lacking these (any) could significantly impact bookings.
- Popular amenities like Free parking on premises, Washer, Wifi are common but not universal. Offering these can provide a competitive edge.
- Warning: Wifi is not universally provided but is considered essential globally. Ensure reliable Wifi is offered.
Recommendations for Hosts
- Ensure your listing includes all essential amenities for Ventron: Heating, Kitchen, Hot water, TV, Smoke alarm.
- Prioritize adding missing essentials: Kitchen, Hot water, TV, Smoke alarm.
- Consider adding popular differentiators like Free parking on premises or Washer to increase appeal.
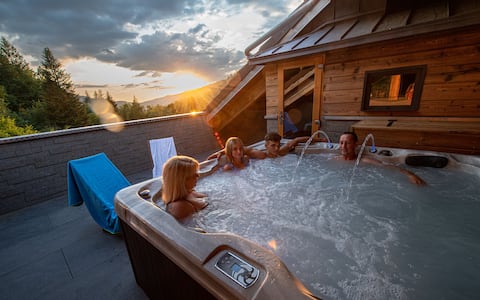
- Highlight unique or less common amenities you offer (e.g., hot tub, dedicated workspace, EV charger) in your listing description and photos.
- Regularly check competitor amenities in Ventron to stay competitive.
Ventron Airbnb Guest Demographics & Profile Analysis (2025)
Guest Profile Summary for Ventron
- The typical guest profile for Airbnb in Ventron consists of a mix of domestic (46%) and international guests, with top international origins including Germany, typically belonging to the Post-2000s (Gen Z/Alpha) group (50%), primarily speaking English or French.
- Domestic travelers account for 46.0% of guests.
- Key international markets include France (46%) and Germany (27.9%).
- Top languages spoken are English (34.9%) followed by French (26.6%).
- A significant demographic segment is the Post-2000s (Gen Z/Alpha) group, representing 50% of guests.
Recommendations for Hosts
- Balance marketing efforts between domestic and international channels based on the guest mix.
- Tailor amenities and listing descriptions to appeal to the dominant Post-2000s (Gen Z/Alpha) demographic (e.g., highlight fast WiFi, smart home features, local guides).
- Highlight unique local experiences or amenities relevant to the primary guest profile.
- Consider seasonal promotions aligned with peak travel times for key origin markets.
Nearby Short-Term Rental Market Comparison
How does the Ventron Airbnb market stack up against its neighbors? Compare key performance metrics like average monthly revenue, ADR, and occupancy rates in surrounding areas to understand the broader regional STR landscape.
| Market | Active Properties | Monthly Revenue | Daily Rate | Avg. Occupancy |
|---|---|---|---|---|
| Lauterbrunnen | 525 | $7,079 | $546.45 | 54% |
| La Rivière-Enverse | 17 | $5,972 | $624.02 | 41% |
| Matten bei Interlaken | 52 | $5,674 | $316.63 | 63% |
| Iseltwald | 14 | $5,491 | $331.95 | 58% |
| Habkern | 13 | $5,382 | $344.74 | 50% |
| Interlaken | 288 | $4,987 | $310.52 | 56% |
| Zermatt | 734 | $4,604 | $463.00 | 46% |
| Oberhofen am Thunersee | 24 | $4,572 | $265.94 | 55% |
| Sigriswil | 99 | $4,371 | $271.90 | 58% |
| Bönigen | 32 | $4,321 | $253.84 | 64% |