Taintrux Airbnb Market Analysis 2025: Short Term Rental Data & Vacation Rental Statistics in Grand Est, France
Is Airbnb profitable in Taintrux in 2025? Explore comprehensive Airbnb analytics for Taintrux, Grand Est, France to uncover income potential. This 2025 STR market report for Taintrux, based on AirROI data from April 2024 to March 2025, reveals key trends in the niche market of 24 active listings.
Whether you're considering an Airbnb investment in Taintrux, optimizing your existing vacation rental, or exploring rental arbitrage opportunities, understanding the Taintrux Airbnb data is crucial. Understanding the local regulations is key to maximizing your short term rental income potential. Let's dive into the specifics.
Key Taintrux Airbnb Performance Metrics Overview
Monthly Airbnb Revenue Variations & Income Potential in Taintrux (2025)
Understanding the monthly revenue variations for Airbnb listings in Taintrux is key to maximizing your short term rental income potential. Seasonality significantly impacts earnings. Our analysis, based on data from the past 12 months, shows that the peak revenue month for STRs in Taintrux is typically August, while January often presents the lowest earnings, highlighting opportunities for strategic pricing adjustments during shoulder and low seasons. Explore the typical Airbnb income in Taintrux across different performance tiers:
- Best-in-class properties (Top 10%) achieve $3,611+ monthly, often utilizing dynamic pricing and superior guest experiences.
- Strong performing properties (Top 25%) earn $2,233 or more, indicating effective management and desirable locations/amenities.
- Typical properties (Median) generate around $1,317 per month, representing the average market performance.
- Entry-level properties (Bottom 25%) see earnings around $724, often with potential for optimization.
Average Monthly Airbnb Earnings Trend in Taintrux
Taintrux Airbnb Occupancy Rate Trends (2025)
Maximize your bookings by understanding the Taintrux STR occupancy trends. Seasonal demand shifts significantly influence how often properties are booked. Typically, Augustsees the highest demand (peak season occupancy), while November experiences the lowest (low season). Effective strategies, like adjusting minimum stays or offering promotions, can boost occupancy during slower periods. Here's how different property tiers perform in Taintrux:
- Best-in-class properties (Top 10%) achieve 78%+ occupancy, indicating high desirability and potentially optimized availability.
- Strong performing properties (Top 25%) maintain 62% or higher occupancy, suggesting good market fit and guest satisfaction.
- Typical properties (Median) have an occupancy rate around 43%.
- Entry-level properties (Bottom 25%) average 21% occupancy, potentially facing higher vacancy.
Average Monthly Occupancy Rate Trend in Taintrux
Average Daily Rate (ADR) Airbnb Trends in Taintrux (2025)
Effective short term rental pricing strategy in Taintrux involves understanding monthly ADR fluctuations. The Average Daily Rate (ADR) for Airbnb in Taintrux typically peaks in December and dips lowest during March. Leveraging Airbnb dynamic pricing tools or strategies based on this seasonality can significantly boost revenue. Here's a look at the typical nightly rates achieved:
- Best-in-class properties (Top 10%) command rates of $220+ per night, often due to premium features or locations.
- Strong performing properties (Top 25%) achieve nightly rates of $163 or more.
- Typical properties (Median) charge around $101 per night.
- Entry-level properties (Bottom 25%) earn around $67 per night.
Average Daily Rate (ADR) Trend by Month in Taintrux
Get Live Taintrux Market Intelligence 👇

Explore Real-time Analytics
Airbnb Seasonality Analysis & Trends in Taintrux (2025)
Peak Season (August, July, May)
- Revenue averages $2,207 per month
- Occupancy rates average 56.6%
- Daily rates average $118
Shoulder Season
- Revenue averages $1,663 per month
- Occupancy maintains around 42.4%
- Daily rates hold near $118
Low Season (January, February, November)
- Revenue drops to average $1,265 per month
- Occupancy decreases to average 35.1%
- Daily rates adjust to average $120
Seasonality Insights for Taintrux
- The Airbnb seasonality in Taintrux shows highly seasonal trends requiring careful strategy. While the sections above show seasonal averages, it's also insightful to look at the extremes:
- During the high season, the absolute peak month showcases Taintrux's highest earning potential, with monthly revenues capable of climbing to $2,462, occupancy reaching a high of 62.5%, and ADRs peaking at $125.
- Conversely, the slowest single month of the year, typically falling within the low season, marks the market's lowest point. In this month, revenue might dip to $1,151, occupancy could drop to 30.8%, and ADRs may adjust down to $116.
- Understanding both the seasonal averages and these monthly peaks and troughs in revenue, occupancy, and ADR is crucial for maximizing your Airbnb profit potential in Taintrux.
Seasonal Strategies for Maximizing Profit
- Peak Season: Maximize revenue through premium pricing and potentially longer minimum stays. Ensure high availability.
- Low Season: Offer competitive pricing, special promotions (e.g., extended stay discounts), and flexible cancellation policies. Target off-season travelers like remote workers or budget-conscious guests.
- Shoulder Seasons: Implement dynamic pricing that balances peak and low rates. Target weekend travelers or specific events. Offer slightly more flexible terms than peak season.
- Regularly analyze your own performance against these Taintrux seasonality benchmarks and adjust your pricing and availability strategy accordingly.
Best Areas for Airbnb Investment in Taintrux (2025)
Exploring the top neighborhoods for short-term rentals in Taintrux? This section highlights key areas, outlining why they are attractive for hosts and guests, along with notable local attractions. Consider these locations based on your target guest profile and investment strategy.
| Neighborhood / Area | Why Host Here? (Target Guests & Appeal) | Key Attractions & Landmarks |
|---|---|---|
| Taintrux Village | A quaint village known for its scenic countryside and peaceful ambiance. Ideal for travelers seeking a serene getaway close to nature and hiking trails. | Château de la Roche, Hiking trails, Local wineries, Cascades du Nideck |
| Saint-Dié-des-Vosges | A nearby town known for its rich history and vibrant culture. A popular choice for those looking to explore both urban and rural experiences. | St. Die Cathedral, Maison du Patrimoine, Museum of Art and History, Hiking in the Vosges |
| Colmar | Famous for its stunning architecture and picturesque canals, Colmar is a key tourist destination, perfect for those wanting to experience Alsatian culture. | Little Venice, Colmar Christmas Market, Unterlinden Museum, St. Martin's Church |
| Strasbourg | A major cultural hub known for its historical architecture and vibrant EU presence. Great for business travelers and tourists alike. | Strasbourg Cathedral, La Petite France, European Parliament, Orangerie Park |
| Gerardmer | A resort town known for its lake and ski areas, attracting tourists year-round for both summer and winter activities. | Lac de Gérardmer, Ski Resorts, Hiking trails, Gerardmer Music Festival |
| Kaysersberg | A charming town renowned for its medieval architecture and vineyards. Perfect for wine enthusiasts and fans of quaint, traditional French villages. | Kaysersberg Castle, Vineyard tours, Local wineries, Christmas Market |
| Epinal | Known for its historic sites and natural parks, Epinal offers cultural experiences and access to the scenic Vosges mountains. | Château d'Épinal, Imagerie d'Épinal, Parc du Château |
| La Bresse | Popular for outdoor activities and skiing in winter, this location provides ample opportunities for adventure-seekers and nature lovers. | La Bresse Hohneck, Skiing and snowboarding, Lac de la Bresse, Wildlife parks |
Understanding Airbnb License Requirements & STR Laws in Taintrux (2025)
With 29% of listings showing registration in 2025, understanding potential Airbnb license requirements is crucial in Taintrux. Always verify the latest short term rental regulations and Airbnb license requirements directly with local government authorities for Taintrux to ensure full compliance before hosting.
(Source: AirROI data, 2025, based on 29% licensed listings)
Top Performing Airbnb Properties in Taintrux (2025)
Benchmark your potential! Explore examples of top-performing Airbnb properties in Taintruxbased on Trailing Twelve Month (TTM) revenue. Analyze their characteristics, revenue, occupancy rate, and ADR to understand what drives success in this market.
Casa el nido
Entire Place • 2 bedrooms
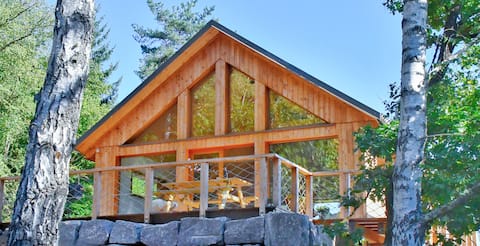
the waterfront cabin
Entire Place • 1 bedroom
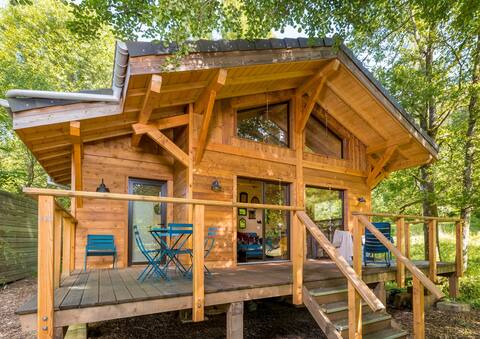
the horse hut
Entire Place • 1 bedroom
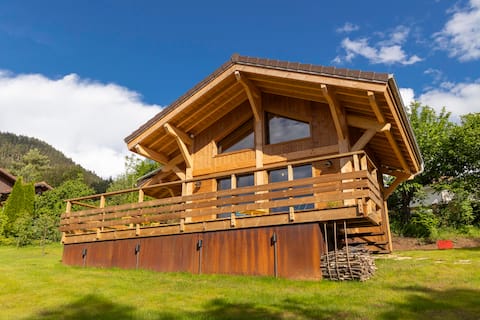
Le Paxoral
Entire Place • 3 bedrooms

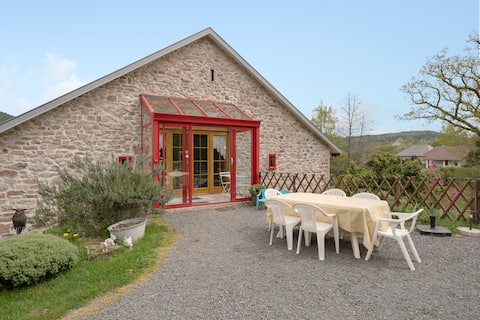
Rural cottage 6 people in the heart of the Vosges
Entire Place • 2 bedrooms

La chèvrerie
Entire Place • 2 bedrooms
Note: Performance varies based on location, size, amenities, seasonality, and management quality. Data reflects the past 12 months.
Top Performing Airbnb Hosts in Taintrux (2025)
Learn from the best! This table showcases top-performing Airbnb hosts in Taintrux based on the number of properties managed and estimated total revenue over the past year. Analyze their scale and performance metrics.
| Host Name | Properties | Grossing Revenue | Stay Reviews | Avg Rating |
|---|---|---|---|---|
| Jean-Philippe | 2 | $68,407 | 203 | 4.94/5.0 |
| Beatrizgauthier | 1 | $55,985 | 68 | 4.96/5.0 |
| Matthieu | 3 | $46,616 | 67 | 4.73/5.0 |
| Gérard | 1 | $24,980 | 4 | 5.00/5.0 |
| Monique | 3 | $24,723 | 34 | 4.85/5.0 |
| Claude | 1 | $22,165 | 48 | 4.92/5.0 |
| Jade | 1 | $20,605 | 41 | 4.90/5.0 |
| Anna | 1 | $20,583 | 70 | 4.89/5.0 |
| Jerome Et Nadege | 1 | $19,810 | 65 | 4.66/5.0 |
| Béa | 2 | $18,650 | 547 | 4.79/5.0 |
Analyzing the strategies of top hosts, such as their property selection, pricing, and guest communication, can offer valuable lessons for optimizing your own Airbnb operations in Taintrux.
Dive Deeper: Advanced Taintrux STR Market Data (2025)
Ready to unlock more insights? AirROI provides access to advanced metrics and comprehensive Airbnb data for Taintrux. Explore detailed analytics beyond this report to refine your investment strategy, optimize pricing, and maximize your vacation rental profits.
Explore Advanced MetricsTaintrux Short-Term Rental Market Composition (2025): Property & Room Types
Room Type Distribution
Property Type Distribution
Market Composition Insights for Taintrux
- The Taintrux Airbnb market composition is heavily skewed towards Entire Home/Apt listings, which make up 87.5% of the 24 active rentals. This indicates strong guest preference for privacy and space.
- Looking at the property type distribution in Taintrux, House properties are the most common (62.5%), reflecting the local real estate landscape.
- Houses represent a significant 62.5% portion, catering likely to families or larger groups.
- The presence of 12.5% Hotel/Boutique listings indicates integration with traditional hospitality.
- Smaller segments like outdoor/unique, unique stays (combined 8.4%) offer potential for unique stay experiences.
Taintrux Airbnb Room Capacity Analysis (2025): Bedroom Distribution
Distribution of Listings by Number of Bedrooms
Room Capacity Insights for Taintrux
- The dominant room capacity in Taintrux is 1 bedroom listings, making up 37.5% of the market. This suggests a strong demand for properties suitable for couples or solo travelers.
- Together, 1 bedroom and 2 bedrooms properties represent 70.8% of the active Airbnb listings in Taintrux, indicating a high concentration in these sizes.
- A significant 20.8% of listings offer 3+ bedrooms, catering to larger groups and families seeking more space in Taintrux.
Taintrux Vacation Rental Guest Capacity Trends (2025)
Distribution of Listings by Guest Capacity
Guest Capacity Insights for Taintrux
- The most common guest capacity trend in Taintrux vacation rentals is listings accommodating 4 guests (33.3%). This suggests the primary traveler segment is likely small families or groups.
- Properties designed for 4 guests and 2 guests dominate the Taintrux STR market, accounting for 54.1% of listings.
- 29.2% of properties accommodate 6+ guests, serving the market segment for larger families or group travel in Taintrux.
- On average, properties in Taintrux are equipped to host 4.0 guests.
Taintrux Airbnb Booking Patterns (2025): Available vs. Booked Days
Available Days Distribution
Booked Days Distribution
Booking Pattern Insights for Taintrux
- The most common availability pattern in Taintrux falls within the 271-366 days range, representing 41.7% of listings. This suggests many properties have significant open periods on their calendars.
- Approximately 54.2% of listings show high availability (181+ days open annually), indicating potential for increased bookings or specific owner usage patterns.
- For booked days, the 181-270 days range is most frequent in Taintrux (41.7%), reflecting common guest stay durations or potential owner blocking patterns.
- A notable 45.9% of properties secure long booking periods (181+ days booked per year), highlighting successful long-term rental strategies or significant owner usage.
Taintrux Airbnb Minimum Stay Requirements Analysis
Distribution of Listings by Minimum Night Requirement
1 Night
2 listings
8.3% of total
2 Nights
14 listings
58.3% of total
4-6 Nights
1 listings
4.2% of total
30+ Nights
7 listings
29.2% of total
Key Insights
- The most prevalent minimum stay requirement in Taintrux is 2 Nights, adopted by 58.3% of listings. This highlights the market's preference for shorter, flexible bookings.
- A strong majority (66.6%) of the Taintrux Airbnb data shows acceptance of very short stays (1-2 nights), indicating a dynamic, high-turnover market.
- A significant segment (29.2%) caters to monthly stays (30+ nights) in Taintrux, pointing to opportunities in the extended-stay market.
Recommendations
- Align with the market by considering a 2 Nights minimum stay, as 58.3% of Taintrux hosts use this setting.
- If feasible, allowing 1-night stays, especially midweek or during low season, could capture last-minute bookings, as only 8.3% currently do.
- A 2-night minimum appears standard (58.3%). Consider this for weekends or peak periods.
- Explore offering discounts for stays of 30+ nights to attract the 29.2% of the market seeking extended stays.
- Adjust minimum nights based on seasonality – potentially shorter during low season and longer during peak demand periods in Taintrux.
Taintrux Airbnb Cancellation Policy Trends Analysis (2025)
Flexible
4 listings
16.7% of total
Moderate
11 listings
45.8% of total
Firm
3 listings
12.5% of total
Strict
6 listings
25% of total
Cancellation Policy Insights for Taintrux
- The prevailing Airbnb cancellation policy trend in Taintrux is Moderate, used by 45.8% of listings.
- There's a relatively balanced mix between guest-friendly (62.5%) and stricter (37.5%) policies, offering choices for different guest needs.
Recommendations for Hosts
- Consider adopting a Moderate policy to align with the 45.8% market standard in Taintrux.
- Regularly review your cancellation policy against competitors and market demand shifts in Taintrux.
Taintrux STR Booking Lead Time Analysis (2025)
Average Booking Lead Time by Month
Booking Lead Time Insights for Taintrux
- The overall average booking lead time for vacation rentals in Taintrux is 45 days.
- Guests book furthest in advance for stays during June (average 98 days), likely coinciding with peak travel demand or local events.
- The shortest booking windows occur for stays in March (average 26 days), indicating more last-minute travel plans during this time.
- Seasonally, Summer (78 days avg.) sees the longest lead times, while Winter (40 days avg.) has the shortest, reflecting typical travel planning cycles.
Recommendations for Hosts
- Use the overall average lead time (45 days) as a baseline for your pricing and availability strategy in Taintrux.
- For June stays, consider implementing length-of-stay discounts or slightly higher rates for bookings made less than 98 days out to capitalize on advance planning.
- Target marketing efforts for the Summer season well in advance (at least 78 days) to capture early planners.
- Monitor your own booking lead times against these Taintrux averages to identify opportunities for dynamic pricing adjustments.
Popular & Essential Airbnb Amenities in Taintrux (2025)
Amenity Prevalence
Amenity Insights for Taintrux
- Essential amenities in Taintrux that guests expect include: Free parking on premises, Heating, Hot water. Lacking these (any) could significantly impact bookings.
- Popular amenities like Kitchen, Hair dryer, Smoke alarm are common but not universal. Offering these can provide a competitive edge.
- Warning: Wifi is not universally provided but is considered essential globally. Ensure reliable Wifi is offered.
Recommendations for Hosts
- Ensure your listing includes all essential amenities for Taintrux: Free parking on premises, Heating, Hot water.
- Prioritize adding missing essentials: Hot water.
- Consider adding popular differentiators like Kitchen or Hair dryer to increase appeal.
- Highlight unique or less common amenities you offer (e.g., hot tub, dedicated workspace, EV charger) in your listing description and photos.
- Regularly check competitor amenities in Taintrux to stay competitive.
Taintrux Airbnb Guest Demographics & Profile Analysis (2025)
Guest Profile Summary for Taintrux
- The typical guest profile for Airbnb in Taintrux consists of a mix of domestic (43%) and international guests, with top international origins including Germany, typically belonging to the Post-2000s (Gen Z/Alpha) group (50%), primarily speaking English or French.
- Domestic travelers account for 42.5% of guests.
- Key international markets include France (42.5%) and Germany (23%).
- Top languages spoken are English (36.8%) followed by French (27.4%).
- A significant demographic segment is the Post-2000s (Gen Z/Alpha) group, representing 50% of guests.
Recommendations for Hosts
- Balance marketing efforts between domestic and international channels based on the guest mix.
- Tailor amenities and listing descriptions to appeal to the dominant Post-2000s (Gen Z/Alpha) demographic (e.g., highlight fast WiFi, smart home features, local guides).
- Highlight unique local experiences or amenities relevant to the primary guest profile.
- Consider seasonal promotions aligned with peak travel times for key origin markets.
Nearby Short-Term Rental Market Comparison
How does the Taintrux Airbnb market stack up against its neighbors? Compare key performance metrics like average monthly revenue, ADR, and occupancy rates in surrounding areas to understand the broader regional STR landscape.
| Market | Active Properties | Monthly Revenue | Daily Rate | Avg. Occupancy |
|---|---|---|---|---|
| Ittenheim | 19 | $3,672 | $228.19 | 45% |
| Furdenheim | 16 | $3,576 | $330.05 | 50% |
| Osenbach | 23 | $3,150 | $276.55 | 39% |
| Le Valtin | 18 | $3,072 | $289.72 | 38% |
| Griesheim-près-Molsheim | 19 | $3,065 | $263.48 | 41% |
| Belmont | 13 | $2,931 | $260.89 | 36% |
| Ventron | 82 | $2,809 | $278.41 | 36% |
| Léglise | 21 | $2,804 | $259.32 | 38% |
| Rust | 160 | $2,750 | $187.61 | 52% |
| Libin | 46 | $2,632 | $218.34 | 42% |