Saint-Julien-les-Villas Airbnb Market Analysis 2025: Short Term Rental Data & Vacation Rental Statistics in Grand Est, France
Is Airbnb profitable in Saint-Julien-les-Villas in 2025? Explore comprehensive Airbnb analytics for Saint-Julien-les-Villas, Grand Est, France to uncover income potential. This 2025 STR market report for Saint-Julien-les-Villas, based on AirROI data from April 2024 to March 2025, reveals key trends in the niche market of 26 active listings.
Whether you're considering an Airbnb investment in Saint-Julien-les-Villas, optimizing your existing vacation rental, or exploring rental arbitrage opportunities, understanding the Saint-Julien-les-Villas Airbnb data is crucial. Leveraging the low regulation environment is key to maximizing your short term rental income potential. Let's dive into the specifics.
Key Saint-Julien-les-Villas Airbnb Performance Metrics Overview
Monthly Airbnb Revenue Variations & Income Potential in Saint-Julien-les-Villas (2025)
Understanding the monthly revenue variations for Airbnb listings in Saint-Julien-les-Villas is key to maximizing your short term rental income potential. Seasonality significantly impacts earnings. Our analysis, based on data from the past 12 months, shows that the peak revenue month for STRs in Saint-Julien-les-Villas is typically July, while February often presents the lowest earnings, highlighting opportunities for strategic pricing adjustments during shoulder and low seasons. Explore the typical Airbnb income in Saint-Julien-les-Villas across different performance tiers:
- Best-in-class properties (Top 10%) achieve $1,952+ monthly, often utilizing dynamic pricing and superior guest experiences.
- Strong performing properties (Top 25%) earn $1,384 or more, indicating effective management and desirable locations/amenities.
- Typical properties (Median) generate around $829 per month, representing the average market performance.
- Entry-level properties (Bottom 25%) see earnings around $460, often with potential for optimization.
Average Monthly Airbnb Earnings Trend in Saint-Julien-les-Villas
Saint-Julien-les-Villas Airbnb Occupancy Rate Trends (2025)
Maximize your bookings by understanding the Saint-Julien-les-Villas STR occupancy trends. Seasonal demand shifts significantly influence how often properties are booked. Typically, Julysees the highest demand (peak season occupancy), while March experiences the lowest (low season). Effective strategies, like adjusting minimum stays or offering promotions, can boost occupancy during slower periods. Here's how different property tiers perform in Saint-Julien-les-Villas:
- Best-in-class properties (Top 10%) achieve 79%+ occupancy, indicating high desirability and potentially optimized availability.
- Strong performing properties (Top 25%) maintain 65% or higher occupancy, suggesting good market fit and guest satisfaction.
- Typical properties (Median) have an occupancy rate around 43%.
- Entry-level properties (Bottom 25%) average 24% occupancy, potentially facing higher vacancy.
Average Monthly Occupancy Rate Trend in Saint-Julien-les-Villas
Average Daily Rate (ADR) Airbnb Trends in Saint-Julien-les-Villas (2025)
Effective short term rental pricing strategy in Saint-Julien-les-Villas involves understanding monthly ADR fluctuations. The Average Daily Rate (ADR) for Airbnb in Saint-Julien-les-Villas typically peaks in July and dips lowest during March. Leveraging Airbnb dynamic pricing tools or strategies based on this seasonality can significantly boost revenue. Here's a look at the typical nightly rates achieved:
- Best-in-class properties (Top 10%) command rates of $180+ per night, often due to premium features or locations.
- Strong performing properties (Top 25%) achieve nightly rates of $89 or more.
- Typical properties (Median) charge around $52 per night.
- Entry-level properties (Bottom 25%) earn around $39 per night.
Average Daily Rate (ADR) Trend by Month in Saint-Julien-les-Villas
Get Live Saint-Julien-les-Villas Market Intelligence 👇

Explore Real-time Analytics
Airbnb Seasonality Analysis & Trends in Saint-Julien-les-Villas (2025)
Peak Season (July, August, June)
- Revenue averages $1,594 per month
- Occupancy rates average 52.4%
- Daily rates average $78
Shoulder Season
- Revenue averages $1,032 per month
- Occupancy maintains around 44.2%
- Daily rates hold near $75
Low Season (February, March, December)
- Revenue drops to average $651 per month
- Occupancy decreases to average 37.5%
- Daily rates adjust to average $71
Seasonality Insights for Saint-Julien-les-Villas
- The Airbnb seasonality in Saint-Julien-les-Villas shows highly seasonal trends requiring careful strategy. While the sections above show seasonal averages, it's also insightful to look at the extremes:
- During the high season, the absolute peak month showcases Saint-Julien-les-Villas's highest earning potential, with monthly revenues capable of climbing to $1,643, occupancy reaching a high of 58.9%, and ADRs peaking at $79.
- Conversely, the slowest single month of the year, typically falling within the low season, marks the market's lowest point. In this month, revenue might dip to $600, occupancy could drop to 34.9%, and ADRs may adjust down to $69.
- Understanding both the seasonal averages and these monthly peaks and troughs in revenue, occupancy, and ADR is crucial for maximizing your Airbnb profit potential in Saint-Julien-les-Villas.
Seasonal Strategies for Maximizing Profit
- Peak Season: Maximize revenue through premium pricing and potentially longer minimum stays. Ensure high availability.
- Low Season: Offer competitive pricing, special promotions (e.g., extended stay discounts), and flexible cancellation policies. Target off-season travelers like remote workers or budget-conscious guests.
- Shoulder Seasons: Implement dynamic pricing that balances peak and low rates. Target weekend travelers or specific events. Offer slightly more flexible terms than peak season.
- Regularly analyze your own performance against these Saint-Julien-les-Villas seasonality benchmarks and adjust your pricing and availability strategy accordingly.
Best Areas for Airbnb Investment in Saint-Julien-les-Villas (2025)
Exploring the top neighborhoods for short-term rentals in Saint-Julien-les-Villas? This section highlights key areas, outlining why they are attractive for hosts and guests, along with notable local attractions. Consider these locations based on your target guest profile and investment strategy.
| Neighborhood / Area | Why Host Here? (Target Guests & Appeal) | Key Attractions & Landmarks |
|---|---|---|
| Saint-Julien-les-Villas Centre | The heart of Saint-Julien-les-Villas offers convenient access to local shops, restaurants, and community events. It's ideal for guests wanting a quaint village atmosphere while being close to amenities. | Local markets, Church of Saint-Julien, Community parks, Cafes and bistros |
| Aube Riverbanks | Stunning natural landscapes along the Aube River, perfect for outdoor enthusiasts. Ideal for guests looking for tranquility and beautiful surroundings for walking, cycling, or picnicking. | Aube river paths, Picnic areas, Scenic viewpoints |
| Reims Champagne Trail | Proximity to the famed Champagne vineyards and cellars. A great choice for wine lovers and those interested in the champagne-making process, with many winery tours available. | Champagne houses, Vineyard tours, Wine tasting experiences |
| Troyes Historic District | Nearby Troyes, with its well-preserved medieval buildings and rich history, attracts guests interested in culture, history, and beautiful architecture. | Troyes Cathedral, Old Troyes, St. Peter and Paul Church, Museums |
| Festival Venues | Hosting various cultural and music festivals throughout the year, this area appeals to event-goers looking to enjoy local festivities and entertainment options. | Festival de la Lumière, Music festivals, Local artisan markets |
| Cultural Heritage Trails | This location offers educational opportunities to explore the rich cultural heritage and local artistry, appealing to tourists interested in exploring the local arts scene. | Local galleries, Historical landmarks, Art expos |
| Nature Parks | Surrounding nature parks provide opportunities for outdoor activities and are attractive for families and nature lovers seeking diverse recreational options. | Nature trails, Wildlife observation, Family picnic spots |
| Local Gastronomy | Known for its local cuisine and gastronomic experiences, this area attracts foodies eager to explore traditional dishes and local specialties. | Culinary tours, Local restaurants, Food markets |
Understanding Airbnb License Requirements & STR Laws in Saint-Julien-les-Villas (2025)
While Saint-Julien-les-Villas, Grand Est, France currently shows low STR regulations, specific Airbnb license requirements might still exist or change. Always verify the latest short term rental regulations and Airbnb license requirements directly with local government authorities for Saint-Julien-les-Villas to ensure full compliance before hosting.
(Source: AirROI data, 2025, based on 4% licensed listings)
Top Performing Airbnb Properties in Saint-Julien-les-Villas (2025)
Benchmark your potential! Explore examples of top-performing Airbnb properties in Saint-Julien-les-Villasbased on Trailing Twelve Month (TTM) revenue. Analyze their characteristics, revenue, occupancy rate, and ADR to understand what drives success in this market.

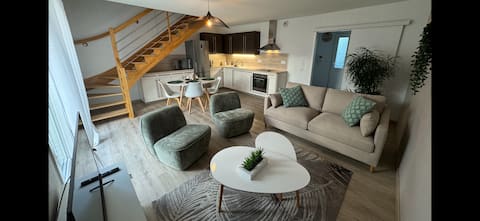
Warm modern home
Entire Place • 3 bedrooms
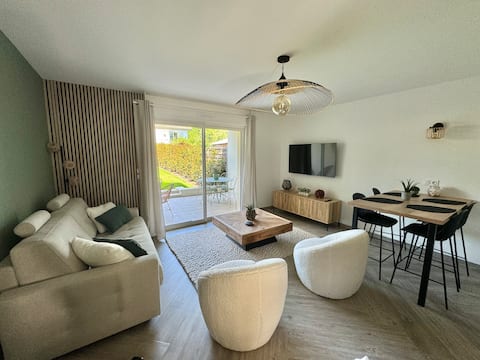
apartment duplex house 80 m² terrace garden
Entire Place • 2 bedrooms
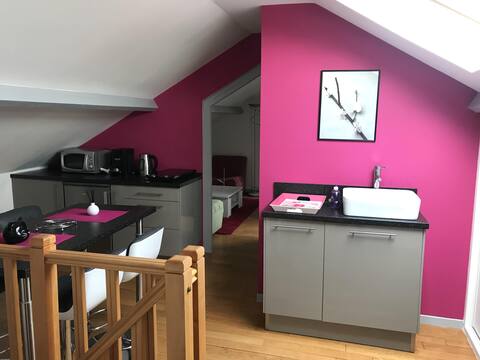
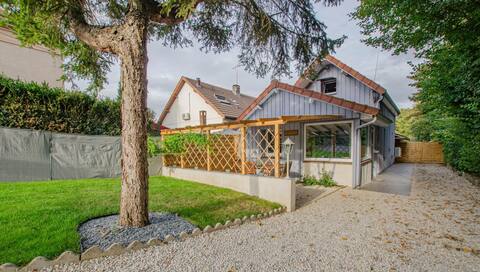
Cozy home garden terrace secure parking
Entire Place • 1 bedroom
Air-conditioned accommodation and complimentary breakfast. Pat
Entire Place • 2 bedrooms

Le Cosy - Providence - Parking - Terrasse
Entire Place • 1 bedroom
Le Refuge
Entire Place • 2 bedrooms
Note: Performance varies based on location, size, amenities, seasonality, and management quality. Data reflects the past 12 months.
Top Performing Airbnb Hosts in Saint-Julien-les-Villas (2025)
Learn from the best! This table showcases top-performing Airbnb hosts in Saint-Julien-les-Villas based on the number of properties managed and estimated total revenue over the past year. Analyze their scale and performance metrics.
| Host Name | Properties | Grossing Revenue | Stay Reviews | Avg Rating |
|---|---|---|---|---|
| Sebastien | 3 | $48,763 | 814 | 4.96/5.0 |
| Stéphane | 1 | $46,644 | 25 | 5.00/5.0 |
| Melissa | 3 | $33,766 | 293 | 4.72/5.0 |
| John | 4 | $25,891 | 292 | 4.76/5.0 |
| Gites De France Aube | 3 | $19,876 | 10 | 3.33/5.0 |
| Patricia | 1 | $17,962 | 534 | 4.97/5.0 |
| Capitaine BnB | 1 | $17,605 | 23 | 4.65/5.0 |
| Sophie | 1 | $13,843 | 12 | 4.92/5.0 |
| Manon | 1 | $13,433 | 177 | 4.75/5.0 |
| Host #25158382 | 1 | $9,606 | 15 | 4.87/5.0 |
Analyzing the strategies of top hosts, such as their property selection, pricing, and guest communication, can offer valuable lessons for optimizing your own Airbnb operations in Saint-Julien-les-Villas.
Dive Deeper: Advanced Saint-Julien-les-Villas STR Market Data (2025)
Ready to unlock more insights? AirROI provides access to advanced metrics and comprehensive Airbnb data for Saint-Julien-les-Villas. Explore detailed analytics beyond this report to refine your investment strategy, optimize pricing, and maximize your vacation rental profits.
Explore Advanced MetricsSaint-Julien-les-Villas Short-Term Rental Market Composition (2025): Property & Room Types
Room Type Distribution
Property Type Distribution
Market Composition Insights for Saint-Julien-les-Villas
- The Saint-Julien-les-Villas Airbnb market composition is heavily skewed towards Entire Home/Apt listings, which make up 88.5% of the 26 active rentals. This indicates strong guest preference for privacy and space.
- Looking at the property type distribution in Saint-Julien-les-Villas, Apartment/Condo properties are the most common (53.8%), reflecting the local real estate landscape.
- Houses represent a significant 42.3% portion, catering likely to families or larger groups.
- Smaller segments like others (combined 3.8%) offer potential for unique stay experiences.
Saint-Julien-les-Villas Airbnb Room Capacity Analysis (2025): Bedroom Distribution
Distribution of Listings by Number of Bedrooms
Room Capacity Insights for Saint-Julien-les-Villas
- The dominant room capacity in Saint-Julien-les-Villas is 1 bedroom listings, making up 38.5% of the market. This suggests a strong demand for properties suitable for couples or solo travelers.
- Together, 1 bedroom and 2 bedrooms properties represent 65.4% of the active Airbnb listings in Saint-Julien-les-Villas, indicating a high concentration in these sizes.
- Listings with 3+ bedrooms (3.8%) represent a smaller niche, potentially indicating an underserved market for larger group accommodations in Saint-Julien-les-Villas.
Saint-Julien-les-Villas Vacation Rental Guest Capacity Trends (2025)
Distribution of Listings by Guest Capacity
Guest Capacity Insights for Saint-Julien-les-Villas
- The most common guest capacity trend in Saint-Julien-les-Villas vacation rentals is listings accommodating 4 guests (42.3%). This suggests the primary traveler segment is likely small families or groups.
- Properties designed for 4 guests and 2 guests dominate the Saint-Julien-les-Villas STR market, accounting for 73.1% of listings.
- Listings for large groups (6+ guests) are relatively rare (3.8%), potentially indicating an opportunity for hosts targeting this segment in Saint-Julien-les-Villas.
- On average, properties in Saint-Julien-les-Villas are equipped to host 3.0 guests.
Saint-Julien-les-Villas Airbnb Booking Patterns (2025): Available vs. Booked Days
Available Days Distribution
Booked Days Distribution
Booking Pattern Insights for Saint-Julien-les-Villas
- The most common availability pattern in Saint-Julien-les-Villas falls within the 181-270 days range, representing 42.3% of listings. This suggests many properties have significant open periods on their calendars.
- Approximately 65.4% of listings show high availability (181+ days open annually), indicating potential for increased bookings or specific owner usage patterns.
- For booked days, the 91-180 days range is most frequent in Saint-Julien-les-Villas (38.5%), reflecting common guest stay durations or potential owner blocking patterns.
- A notable 38.4% of properties secure long booking periods (181+ days booked per year), highlighting successful long-term rental strategies or significant owner usage.
Saint-Julien-les-Villas Airbnb Minimum Stay Requirements Analysis
Distribution of Listings by Minimum Night Requirement
1 Night
15 listings
62.5% of total
2 Nights
3 listings
12.5% of total
30+ Nights
6 listings
25% of total
Key Insights
- The most prevalent minimum stay requirement in Saint-Julien-les-Villas is 1 Night, adopted by 62.5% of listings. This highlights the market's preference for shorter, flexible bookings.
- A strong majority (75.0%) of the Saint-Julien-les-Villas Airbnb data shows acceptance of very short stays (1-2 nights), indicating a dynamic, high-turnover market.
- A significant segment (25%) caters to monthly stays (30+ nights) in Saint-Julien-les-Villas, pointing to opportunities in the extended-stay market.
Recommendations
- Align with the market by considering a 1 Night minimum stay, as 62.5% of Saint-Julien-les-Villas hosts use this setting.
- Explore offering discounts for stays of 30+ nights to attract the 25% of the market seeking extended stays.
- Adjust minimum nights based on seasonality – potentially shorter during low season and longer during peak demand periods in Saint-Julien-les-Villas.
Saint-Julien-les-Villas Airbnb Cancellation Policy Trends Analysis (2025)
Super Strict 30 Days
2 listings
8.7% of total
Flexible
11 listings
47.8% of total
Moderate
10 listings
43.5% of total
Cancellation Policy Insights for Saint-Julien-les-Villas
- The prevailing Airbnb cancellation policy trend in Saint-Julien-les-Villas is Flexible, used by 47.8% of listings.
- The market strongly favors guest-friendly terms, with 91.3% of listings offering Flexible or Moderate policies. This suggests guests in Saint-Julien-les-Villas may expect booking flexibility.
Recommendations for Hosts
- Consider adopting a Flexible policy to align with the 47.8% market standard in Saint-Julien-les-Villas.
- Regularly review your cancellation policy against competitors and market demand shifts in Saint-Julien-les-Villas.
Saint-Julien-les-Villas STR Booking Lead Time Analysis (2025)
Average Booking Lead Time by Month
Booking Lead Time Insights for Saint-Julien-les-Villas
- The overall average booking lead time for vacation rentals in Saint-Julien-les-Villas is 24 days.
- Guests book furthest in advance for stays during April (average 48 days), likely coinciding with peak travel demand or local events.
- The shortest booking windows occur for stays in February (average 15 days), indicating more last-minute travel plans during this time.
- Seasonally, Summer (41 days avg.) sees the longest lead times, while Fall (23 days avg.) has the shortest, reflecting typical travel planning cycles.
Recommendations for Hosts
- Use the overall average lead time (24 days) as a baseline for your pricing and availability strategy in Saint-Julien-les-Villas.
- For April stays, consider implementing length-of-stay discounts or slightly higher rates for bookings made less than 48 days out to capitalize on advance planning.
- Target marketing efforts for the Summer season well in advance (at least 41 days) to capture early planners.
- Monitor your own booking lead times against these Saint-Julien-les-Villas averages to identify opportunities for dynamic pricing adjustments.
Popular & Essential Airbnb Amenities in Saint-Julien-les-Villas (2025)
Amenity Prevalence
Amenity Insights for Saint-Julien-les-Villas
- Essential amenities in Saint-Julien-les-Villas that guests expect include: Dishes and silverware, Kitchen, Smoke alarm, Refrigerator, TV, Heating. Lacking these (any) could significantly impact bookings.
- Popular amenities like Cooking basics, Coffee maker, Free parking on premises are common but not universal. Offering these can provide a competitive edge.
Recommendations for Hosts
- Ensure your listing includes all essential amenities for Saint-Julien-les-Villas: Dishes and silverware, Kitchen, Smoke alarm, Refrigerator, TV, Heating.
- Prioritize adding missing essentials: Smoke alarm, Refrigerator, TV, Heating.
- Consider adding popular differentiators like Cooking basics or Coffee maker to increase appeal.
- Highlight unique or less common amenities you offer (e.g., hot tub, dedicated workspace, EV charger) in your listing description and photos.
- Regularly check competitor amenities in Saint-Julien-les-Villas to stay competitive.
Saint-Julien-les-Villas Airbnb Guest Demographics & Profile Analysis (2025)
Guest Profile Summary for Saint-Julien-les-Villas
- The typical guest profile for Airbnb in Saint-Julien-les-Villas consists of primarily domestic travelers (78%), often arriving from nearby Paris, typically belonging to the Post-2000s (Gen Z/Alpha) group (50%), primarily speaking French or English.
- Domestic travelers account for 77.6% of guests.
- Key international markets include France (77.6%) and United Kingdom (7.9%).
- Top languages spoken are French (46%) followed by English (31.9%).
- A significant demographic segment is the Post-2000s (Gen Z/Alpha) group, representing 50% of guests.
Recommendations for Hosts
- Target domestic marketing efforts towards travelers from Paris and England.
- Tailor amenities and listing descriptions to appeal to the dominant Post-2000s (Gen Z/Alpha) demographic (e.g., highlight fast WiFi, smart home features, local guides).
- Highlight unique local experiences or amenities relevant to the primary guest profile.
- Consider seasonal promotions aligned with peak travel times for key origin markets.
Nearby Short-Term Rental Market Comparison
How does the Saint-Julien-les-Villas Airbnb market stack up against its neighbors? Compare key performance metrics like average monthly revenue, ADR, and occupancy rates in surrounding areas to understand the broader regional STR landscape.
| Market | Active Properties | Monthly Revenue | Daily Rate | Avg. Occupancy |
|---|---|---|---|---|
| Verdelot | 13 | $3,885 | $300.79 | 46% |
| Trigny | 10 | $3,775 | $248.19 | 46% |
| Corgoloin | 10 | $3,314 | $296.49 | 44% |
| Léglise | 21 | $2,804 | $259.32 | 38% |
| Bairon et ses environs | 11 | $2,800 | $219.30 | 31% |
| Saint-Germain-des-Champs | 10 | $2,673 | $248.04 | 47% |
| Libin | 46 | $2,632 | $218.34 | 42% |
| Sépeaux-Saint Romain | 12 | $2,603 | $181.16 | 46% |
| Trélou-sur-Marne | 12 | $2,602 | $191.18 | 46% |
| Saint-Romain | 17 | $2,563 | $306.82 | 34% |