Pfaffenheim Airbnb Market Analysis 2025: Short Term Rental Data & Vacation Rental Statistics in Grand Est, France
Is Airbnb profitable in Pfaffenheim in 2025? Explore comprehensive Airbnb analytics for Pfaffenheim, Grand Est, France to uncover income potential. This 2025 STR market report for Pfaffenheim, based on AirROI data from April 2024 to March 2025, reveals key trends in the niche market of 18 active listings.
Whether you're considering an Airbnb investment in Pfaffenheim, optimizing your existing vacation rental, or exploring rental arbitrage opportunities, understanding the Pfaffenheim Airbnb data is crucial. Understanding the local regulations is key to maximizing your short term rental income potential. Let's dive into the specifics.
Key Pfaffenheim Airbnb Performance Metrics Overview
Monthly Airbnb Revenue Variations & Income Potential in Pfaffenheim (2025)
Understanding the monthly revenue variations for Airbnb listings in Pfaffenheim is key to maximizing your short term rental income potential. Seasonality significantly impacts earnings. Our analysis, based on data from the past 12 months, shows that the peak revenue month for STRs in Pfaffenheim is typically December, while March often presents the lowest earnings, highlighting opportunities for strategic pricing adjustments during shoulder and low seasons. Explore the typical Airbnb income in Pfaffenheim across different performance tiers:
- Best-in-class properties (Top 10%) achieve $5,488+ monthly, often utilizing dynamic pricing and superior guest experiences.
- Strong performing properties (Top 25%) earn $2,254 or more, indicating effective management and desirable locations/amenities.
- Typical properties (Median) generate around $1,470 per month, representing the average market performance.
- Entry-level properties (Bottom 25%) see earnings around $928, often with potential for optimization.
Average Monthly Airbnb Earnings Trend in Pfaffenheim
Pfaffenheim Airbnb Occupancy Rate Trends (2025)
Maximize your bookings by understanding the Pfaffenheim STR occupancy trends. Seasonal demand shifts significantly influence how often properties are booked. Typically, Decembersees the highest demand (peak season occupancy), while February experiences the lowest (low season). Effective strategies, like adjusting minimum stays or offering promotions, can boost occupancy during slower periods. Here's how different property tiers perform in Pfaffenheim:
- Best-in-class properties (Top 10%) achieve 78%+ occupancy, indicating high desirability and potentially optimized availability.
- Strong performing properties (Top 25%) maintain 66% or higher occupancy, suggesting good market fit and guest satisfaction.
- Typical properties (Median) have an occupancy rate around 42%.
- Entry-level properties (Bottom 25%) average 18% occupancy, potentially facing higher vacancy.
Average Monthly Occupancy Rate Trend in Pfaffenheim
Average Daily Rate (ADR) Airbnb Trends in Pfaffenheim (2025)
Effective short term rental pricing strategy in Pfaffenheim involves understanding monthly ADR fluctuations. The Average Daily Rate (ADR) for Airbnb in Pfaffenheim typically peaks in December and dips lowest during April. Leveraging Airbnb dynamic pricing tools or strategies based on this seasonality can significantly boost revenue. Here's a look at the typical nightly rates achieved:
- Best-in-class properties (Top 10%) command rates of $373+ per night, often due to premium features or locations.
- Strong performing properties (Top 25%) achieve nightly rates of $173 or more.
- Typical properties (Median) charge around $126 per night.
- Entry-level properties (Bottom 25%) earn around $88 per night.
Average Daily Rate (ADR) Trend by Month in Pfaffenheim
Get Live Pfaffenheim Market Intelligence 👇

Explore Real-time Analytics
Airbnb Seasonality Analysis & Trends in Pfaffenheim (2025)
Peak Season (December, August, May)
- Revenue averages $4,411 per month
- Occupancy rates average 55.8%
- Daily rates average $179
Shoulder Season
- Revenue averages $3,199 per month
- Occupancy maintains around 42.3%
- Daily rates hold near $173
Low Season (February, March, September)
- Revenue drops to average $1,485 per month
- Occupancy decreases to average 34.4%
- Daily rates adjust to average $178
Seasonality Insights for Pfaffenheim
- The Airbnb seasonality in Pfaffenheim shows highly seasonal trends requiring careful strategy. While the sections above show seasonal averages, it's also insightful to look at the extremes:
- During the high season, the absolute peak month showcases Pfaffenheim's highest earning potential, with monthly revenues capable of climbing to $4,651, occupancy reaching a high of 64.5%, and ADRs peaking at $208.
- Conversely, the slowest single month of the year, typically falling within the low season, marks the market's lowest point. In this month, revenue might dip to $1,029, occupancy could drop to 29.3%, and ADRs may adjust down to $159.
- Understanding both the seasonal averages and these monthly peaks and troughs in revenue, occupancy, and ADR is crucial for maximizing your Airbnb profit potential in Pfaffenheim.
Seasonal Strategies for Maximizing Profit
- Peak Season: Maximize revenue through premium pricing and potentially longer minimum stays. Ensure high availability.
- Low Season: Offer competitive pricing, special promotions (e.g., extended stay discounts), and flexible cancellation policies. Target off-season travelers like remote workers or budget-conscious guests.
- Shoulder Seasons: Implement dynamic pricing that balances peak and low rates. Target weekend travelers or specific events. Offer slightly more flexible terms than peak season.
- Regularly analyze your own performance against these Pfaffenheim seasonality benchmarks and adjust your pricing and availability strategy accordingly.
Best Areas for Airbnb Investment in Pfaffenheim (2025)
Exploring the top neighborhoods for short-term rentals in Pfaffenheim? This section highlights key areas, outlining why they are attractive for hosts and guests, along with notable local attractions. Consider these locations based on your target guest profile and investment strategy.
| Neighborhood / Area | Why Host Here? (Target Guests & Appeal) | Key Attractions & Landmarks |
|---|---|---|
| Pfaffenheim Village | A picturesque Alsatian village known for its wine production and charming half-timbered houses. Attracts tourists looking for an authentic French experience in the heart of the Alsace region. | Vineyards of Alsace, Wine tasting tours, Scenic countryside, Historical churches, Local artisan shops |
| Eguisheim | Renowned for its medieval architecture and winemaking, Eguisheim offers a fairy-tale setting and is one of the most beautiful villages in France. Popular among tourists and wine lovers. | Eguisheim Wine Route, Historical castle, Charming narrow streets, St. Leonard's Church, Local markets |
| Colmar | A beautiful town famous for its well-preserved Old Town and canals, often referred to as the 'Venice of Alsace'. It attracts millions of visitors each year. | Little Venice, Unterlinden Museum, Colmar Christmas Market, St. Martin's Church, Colmar Toy Museum |
| Riquewihr | An emblematic wine village, Riquewihr boasts stunning medieval architecture and is surrounded by vineyards. A key location on the Alsace Wine Route. | Riquewihr Wine Tour, Dolder Tower, Musee du Dolder, Vineyard hikes, Local wine cellars |
| Kaysersberg | Another picturesque village on the Alsace Wine Route, Kaysersberg is known for its historical center and beautiful views, drawing in visitors year-round. | Kaysersberg Castle, Historical museum, Local shops and cafes, Scenic walking trails, Christmas markets |
| Ribeauvillé | Famous for its rich history and the nearby Trois Châteaux, Ribeauvillé offers a mix of culture, nature, and wine tourism, making it a favored destination. | Ribeauvillé Wine Festival, Historical castles, Local wine tasting, Cultural events, Beautiful walking paths |
| Strasbourg | As the capital of Alsace, Strasbourg is known for its stunning architecture and vibrant cultural scene. It’s a hotspot for both tourists and business travelers. | Strasbourg Cathedral, La Petite France, European Parliament, Museum of Modern and Contemporary Art, Parc de l'Orangerie |
| Mulhouse | Known for its museums and proximity to the Swiss border, Mulhouse attracts business travelers as well as tourists interested in automobile history and culture. | Cité de l'Automobile, Museum of Printed Textiles, Historic city center, Train Museum, Local dining experiences |
Understanding Airbnb License Requirements & STR Laws in Pfaffenheim (2025)
With 11% of listings showing registration in 2025, understanding potential Airbnb license requirements is crucial in Pfaffenheim. Always verify the latest short term rental regulations and Airbnb license requirements directly with local government authorities for Pfaffenheim to ensure full compliance before hosting.
(Source: AirROI data, 2025, based on 11% licensed listings)
Top Performing Airbnb Properties in Pfaffenheim (2025)
Benchmark your potential! Explore examples of top-performing Airbnb properties in Pfaffenheimbased on Trailing Twelve Month (TTM) revenue. Analyze their characteristics, revenue, occupancy rate, and ADR to understand what drives success in this market.

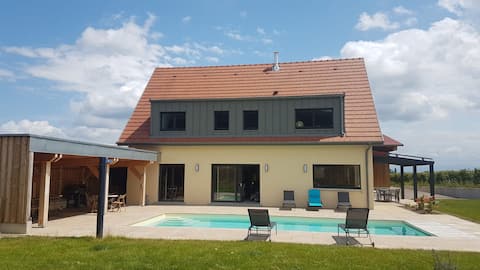
Les Aspérules cottage combining great comfort and nature
Entire Place • 7 bedrooms
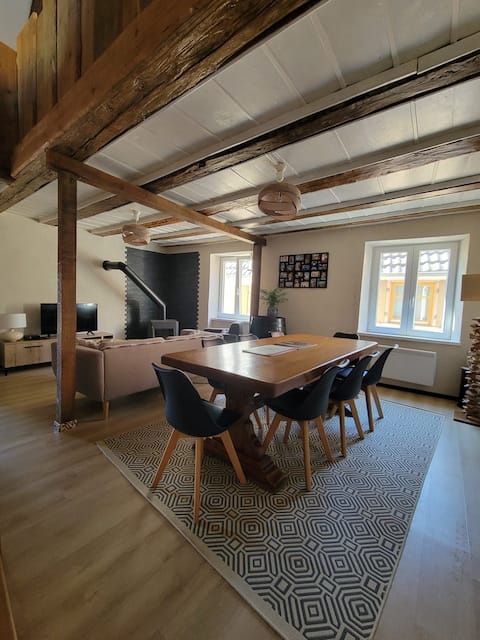
Beautiful Jacuzzi House +Pool in the heart of vineyards
Entire Place • 3 bedrooms
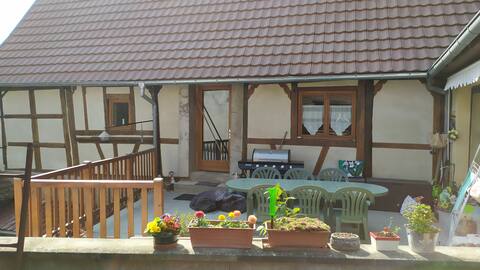
Maison Vigneronne de Caractère (Alsace-Haut Rhin)
Entire Place • 3 bedrooms
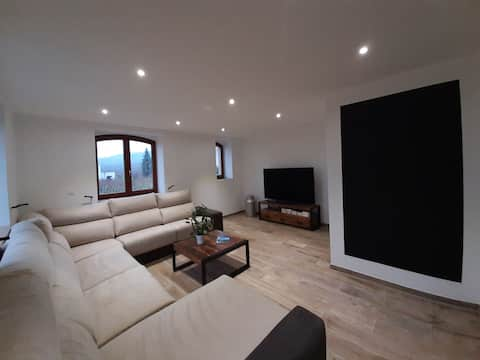
Ddé's Home
Entire Place • 1 bedroom
Large vacation home "A l 'Orée des Vignes"
Entire Place • 4 bedrooms
Independent home in the heart of the vineyard
Entire Place • 2 bedrooms
Note: Performance varies based on location, size, amenities, seasonality, and management quality. Data reflects the past 12 months.
Top Performing Airbnb Hosts in Pfaffenheim (2025)
Learn from the best! This table showcases top-performing Airbnb hosts in Pfaffenheim based on the number of properties managed and estimated total revenue over the past year. Analyze their scale and performance metrics.
| Host Name | Properties | Grossing Revenue | Stay Reviews | Avg Rating |
|---|---|---|---|---|
| Victor | 1 | $248,043 | 32 | 5.00/5.0 |
| Daniel | 1 | $49,785 | 52 | 4.87/5.0 |
| Eliane | 2 | $38,785 | 359 | 4.83/5.0 |
| Valérie Et Patrice | 1 | $26,960 | 55 | 4.69/5.0 |
| Andre | 1 | $20,954 | 29 | 4.97/5.0 |
| Christelle Et Emmanuel | 1 | $20,424 | 19 | 5.00/5.0 |
| Fabien | 1 | $17,550 | 108 | 4.98/5.0 |
| Jean-François | 1 | $16,103 | 231 | 4.95/5.0 |
| Céline | 1 | $16,010 | 71 | 4.92/5.0 |
| Blandine | 1 | $15,672 | 147 | 4.88/5.0 |
Analyzing the strategies of top hosts, such as their property selection, pricing, and guest communication, can offer valuable lessons for optimizing your own Airbnb operations in Pfaffenheim.
Dive Deeper: Advanced Pfaffenheim STR Market Data (2025)
Ready to unlock more insights? AirROI provides access to advanced metrics and comprehensive Airbnb data for Pfaffenheim. Explore detailed analytics beyond this report to refine your investment strategy, optimize pricing, and maximize your vacation rental profits.
Explore Advanced MetricsPfaffenheim Short-Term Rental Market Composition (2025): Property & Room Types
Room Type Distribution
Property Type Distribution
Market Composition Insights for Pfaffenheim
- The Pfaffenheim Airbnb market composition is heavily skewed towards Entire Home/Apt listings, which make up 100% of the 18 active rentals. This indicates strong guest preference for privacy and space.
- Looking at the property type distribution in Pfaffenheim, House properties are the most common (50%), reflecting the local real estate landscape.
- Houses represent a significant 50% portion, catering likely to families or larger groups.
- The presence of 11.1% Hotel/Boutique listings indicates integration with traditional hospitality.
Pfaffenheim Airbnb Room Capacity Analysis (2025): Bedroom Distribution
Distribution of Listings by Number of Bedrooms
Room Capacity Insights for Pfaffenheim
- The dominant room capacity in Pfaffenheim is 2 bedrooms listings, making up 33.3% of the market. This suggests a strong demand for properties suitable for couples or solo travelers.
- Together, 2 bedrooms and 1 bedroom properties represent 66.6% of the active Airbnb listings in Pfaffenheim, indicating a high concentration in these sizes.
- A significant 33.4% of listings offer 3+ bedrooms, catering to larger groups and families seeking more space in Pfaffenheim.
Pfaffenheim Vacation Rental Guest Capacity Trends (2025)
Distribution of Listings by Guest Capacity
Guest Capacity Insights for Pfaffenheim
- The most common guest capacity trend in Pfaffenheim vacation rentals is listings accommodating 8+ guests (33.3%). This suggests the primary traveler segment is likely larger groups.
- Properties designed for 8+ guests and 4 guests dominate the Pfaffenheim STR market, accounting for 66.6% of listings.
- 33.3% of properties accommodate 6+ guests, serving the market segment for larger families or group travel in Pfaffenheim.
- On average, properties in Pfaffenheim are equipped to host 5.1 guests.
Pfaffenheim Airbnb Booking Patterns (2025): Available vs. Booked Days
Available Days Distribution
Booked Days Distribution
Booking Pattern Insights for Pfaffenheim
- The most common availability pattern in Pfaffenheim falls within the 271-366 days range, representing 44.4% of listings. This suggests many properties have significant open periods on their calendars.
- Approximately 66.6% of listings show high availability (181+ days open annually), indicating potential for increased bookings or specific owner usage patterns.
- For booked days, the 181-270 days range is most frequent in Pfaffenheim (27.8%), reflecting common guest stay durations or potential owner blocking patterns.
- A notable 33.4% of properties secure long booking periods (181+ days booked per year), highlighting successful long-term rental strategies or significant owner usage.
Pfaffenheim Airbnb Minimum Stay Requirements Analysis
Distribution of Listings by Minimum Night Requirement
1 Night
5 listings
27.8% of total
2 Nights
7 listings
38.9% of total
3 Nights
3 listings
16.7% of total
30+ Nights
3 listings
16.7% of total
Key Insights
- The most prevalent minimum stay requirement in Pfaffenheim is 2 Nights, adopted by 38.9% of listings. This highlights the market's preference for shorter, flexible bookings.
- A strong majority (66.7%) of the Pfaffenheim Airbnb data shows acceptance of very short stays (1-2 nights), indicating a dynamic, high-turnover market.
- A significant segment (16.7%) caters to monthly stays (30+ nights) in Pfaffenheim, pointing to opportunities in the extended-stay market.
Recommendations
- Align with the market by considering a 2 Nights minimum stay, as 38.9% of Pfaffenheim hosts use this setting.
- If feasible, allowing 1-night stays, especially midweek or during low season, could capture last-minute bookings, as only 27.8% currently do.
- Explore offering discounts for stays of 30+ nights to attract the 16.7% of the market seeking extended stays.
- Adjust minimum nights based on seasonality – potentially shorter during low season and longer during peak demand periods in Pfaffenheim.
Pfaffenheim Airbnb Cancellation Policy Trends Analysis (2025)
Super Strict 60 Days
1 listings
5.6% of total
Refundable
1 listings
5.6% of total
Flexible
2 listings
11.1% of total
Moderate
3 listings
16.7% of total
Firm
4 listings
22.2% of total
Strict
7 listings
38.9% of total
Cancellation Policy Insights for Pfaffenheim
- The prevailing Airbnb cancellation policy trend in Pfaffenheim is Strict, used by 38.9% of listings.
- A majority (61.1%) of hosts in Pfaffenheim utilize Firm or Strict policies, indicating a market where hosts prioritize booking security.
Recommendations for Hosts
- Consider adopting a Strict policy to align with the 38.9% market standard in Pfaffenheim.
- With 38.9% using Strict terms, this is a viable option in Pfaffenheim, particularly for high-value properties or during peak demand periods.
- Regularly review your cancellation policy against competitors and market demand shifts in Pfaffenheim.
Pfaffenheim STR Booking Lead Time Analysis (2025)
Average Booking Lead Time by Month
Booking Lead Time Insights for Pfaffenheim
- The overall average booking lead time for vacation rentals in Pfaffenheim is 72 days.
- Guests book furthest in advance for stays during December (average 122 days), likely coinciding with peak travel demand or local events.
- The shortest booking windows occur for stays in February (average 35 days), indicating more last-minute travel plans during this time.
- Seasonally, Summer (97 days avg.) sees the longest lead times, while Spring (64 days avg.) has the shortest, reflecting typical travel planning cycles.
Recommendations for Hosts
- Use the overall average lead time (72 days) as a baseline for your pricing and availability strategy in Pfaffenheim.
- For December stays, consider implementing length-of-stay discounts or slightly higher rates for bookings made less than 122 days out to capitalize on advance planning.
- Target marketing efforts for the Summer season well in advance (at least 97 days) to capture early planners.
- Monitor your own booking lead times against these Pfaffenheim averages to identify opportunities for dynamic pricing adjustments.
Popular & Essential Airbnb Amenities in Pfaffenheim (2025)
Amenity Prevalence
Amenity Insights for Pfaffenheim
- Essential amenities in Pfaffenheim that guests expect include: Coffee maker, Microwave, Kitchen, Heating, TV, Hangers. Lacking these (any) could significantly impact bookings.
- Popular amenities like Hair dryer, Wifi, Dishes and silverware are common but not universal. Offering these can provide a competitive edge.
- Warning: Wifi is not universally provided but is considered essential globally. Ensure reliable Wifi is offered.
Recommendations for Hosts
- Ensure your listing includes all essential amenities for Pfaffenheim: Coffee maker, Microwave, Kitchen, Heating, TV, Hangers.
- Consider adding popular differentiators like Hair dryer or Wifi to increase appeal.
- Highlight unique or less common amenities you offer (e.g., hot tub, dedicated workspace, EV charger) in your listing description and photos.
- Regularly check competitor amenities in Pfaffenheim to stay competitive.
Pfaffenheim Airbnb Guest Demographics & Profile Analysis (2025)
Guest Profile Summary for Pfaffenheim
- The typical guest profile for Airbnb in Pfaffenheim consists of a mix of domestic (56%) and international guests, often arriving from nearby Metz, typically belonging to the Post-2000s (Gen Z/Alpha) group (50%), primarily speaking English or French.
- Domestic travelers account for 55.6% of guests.
- Key international markets include France (55.6%) and Germany (15.5%).
- Top languages spoken are English (33.8%) followed by French (29%).
- A significant demographic segment is the Post-2000s (Gen Z/Alpha) group, representing 50% of guests.
Recommendations for Hosts
- Balance marketing efforts between domestic and international channels based on the guest mix.
- Tailor amenities and listing descriptions to appeal to the dominant Post-2000s (Gen Z/Alpha) demographic (e.g., highlight fast WiFi, smart home features, local guides).
- Highlight unique local experiences or amenities relevant to the primary guest profile.
- Consider seasonal promotions aligned with peak travel times for key origin markets.
Nearby Short-Term Rental Market Comparison
How does the Pfaffenheim Airbnb market stack up against its neighbors? Compare key performance metrics like average monthly revenue, ADR, and occupancy rates in surrounding areas to understand the broader regional STR landscape.
| Market | Active Properties | Monthly Revenue | Daily Rate | Avg. Occupancy |
|---|---|---|---|---|
| Lauterbrunnen | 525 | $7,079 | $546.45 | 54% |
| La Rivière-Enverse | 17 | $5,972 | $624.02 | 41% |
| Matten bei Interlaken | 52 | $5,674 | $316.63 | 63% |
| Iseltwald | 14 | $5,491 | $331.95 | 58% |
| Habkern | 13 | $5,382 | $344.74 | 50% |
| Interlaken | 288 | $4,987 | $310.52 | 56% |
| Grindelwald | 489 | $4,921 | $345.40 | 57% |
| Zermatt | 734 | $4,604 | $463.00 | 46% |
| Oberhofen am Thunersee | 24 | $4,572 | $265.94 | 55% |
| Sigriswil | 99 | $4,371 | $271.90 | 58% |