Oberhausbergen Airbnb Market Analysis 2025: Short Term Rental Data & Vacation Rental Statistics in Grand Est, France
Is Airbnb profitable in Oberhausbergen in 2025? Explore comprehensive Airbnb analytics for Oberhausbergen, Grand Est, France to uncover income potential. This 2025 STR market report for Oberhausbergen, based on AirROI data from April 2024 to March 2025, reveals key trends in the niche market of 18 active listings.
Whether you're considering an Airbnb investment in Oberhausbergen, optimizing your existing vacation rental, or exploring rental arbitrage opportunities, understanding the Oberhausbergen Airbnb data is crucial. Understanding the local regulations is key to maximizing your short term rental income potential. Let's dive into the specifics.
Key Oberhausbergen Airbnb Performance Metrics Overview
Monthly Airbnb Revenue Variations & Income Potential in Oberhausbergen (2025)
Understanding the monthly revenue variations for Airbnb listings in Oberhausbergen is key to maximizing your short term rental income potential. Seasonality significantly impacts earnings. Our analysis, based on data from the past 12 months, shows that the peak revenue month for STRs in Oberhausbergen is typically December, while February often presents the lowest earnings, highlighting opportunities for strategic pricing adjustments during shoulder and low seasons. Explore the typical Airbnb income in Oberhausbergen across different performance tiers:
- Best-in-class properties (Top 10%) achieve $3,013+ monthly, often utilizing dynamic pricing and superior guest experiences.
- Strong performing properties (Top 25%) earn $2,142 or more, indicating effective management and desirable locations/amenities.
- Typical properties (Median) generate around $1,277 per month, representing the average market performance.
- Entry-level properties (Bottom 25%) see earnings around $613, often with potential for optimization.
Average Monthly Airbnb Earnings Trend in Oberhausbergen
Oberhausbergen Airbnb Occupancy Rate Trends (2025)
Maximize your bookings by understanding the Oberhausbergen STR occupancy trends. Seasonal demand shifts significantly influence how often properties are booked. Typically, Julysees the highest demand (peak season occupancy), while May experiences the lowest (low season). Effective strategies, like adjusting minimum stays or offering promotions, can boost occupancy during slower periods. Here's how different property tiers perform in Oberhausbergen:
- Best-in-class properties (Top 10%) achieve 79%+ occupancy, indicating high desirability and potentially optimized availability.
- Strong performing properties (Top 25%) maintain 68% or higher occupancy, suggesting good market fit and guest satisfaction.
- Typical properties (Median) have an occupancy rate around 43%.
- Entry-level properties (Bottom 25%) average 18% occupancy, potentially facing higher vacancy.
Average Monthly Occupancy Rate Trend in Oberhausbergen
Average Daily Rate (ADR) Airbnb Trends in Oberhausbergen (2025)
Effective short term rental pricing strategy in Oberhausbergen involves understanding monthly ADR fluctuations. The Average Daily Rate (ADR) for Airbnb in Oberhausbergen typically peaks in December and dips lowest during September. Leveraging Airbnb dynamic pricing tools or strategies based on this seasonality can significantly boost revenue. Here's a look at the typical nightly rates achieved:
- Best-in-class properties (Top 10%) command rates of $172+ per night, often due to premium features or locations.
- Strong performing properties (Top 25%) achieve nightly rates of $125 or more.
- Typical properties (Median) charge around $94 per night.
- Entry-level properties (Bottom 25%) earn around $56 per night.
Average Daily Rate (ADR) Trend by Month in Oberhausbergen
Get Live Oberhausbergen Market Intelligence 👇

Explore Real-time Analytics
Airbnb Seasonality Analysis & Trends in Oberhausbergen (2025)
Peak Season (December, July, May)
- Revenue averages $1,934 per month
- Occupancy rates average 48.9%
- Daily rates average $110
Shoulder Season
- Revenue averages $1,433 per month
- Occupancy maintains around 42.3%
- Daily rates hold near $100
Low Season (February, October, November)
- Revenue drops to average $1,127 per month
- Occupancy decreases to average 39.8%
- Daily rates adjust to average $107
Seasonality Insights for Oberhausbergen
- The Airbnb seasonality in Oberhausbergen shows highly seasonal trends requiring careful strategy. While the sections above show seasonal averages, it's also insightful to look at the extremes:
- During the high season, the absolute peak month showcases Oberhausbergen's highest earning potential, with monthly revenues capable of climbing to $2,172, occupancy reaching a high of 64.5%, and ADRs peaking at $138.
- Conversely, the slowest single month of the year, typically falling within the low season, marks the market's lowest point. In this month, revenue might dip to $937, occupancy could drop to 30.4%, and ADRs may adjust down to $93.
- Understanding both the seasonal averages and these monthly peaks and troughs in revenue, occupancy, and ADR is crucial for maximizing your Airbnb profit potential in Oberhausbergen.
Seasonal Strategies for Maximizing Profit
- Peak Season: Maximize revenue through premium pricing and potentially longer minimum stays. Ensure high availability.
- Low Season: Offer competitive pricing, special promotions (e.g., extended stay discounts), and flexible cancellation policies. Target off-season travelers like remote workers or budget-conscious guests.
- Shoulder Seasons: Implement dynamic pricing that balances peak and low rates. Target weekend travelers or specific events. Offer slightly more flexible terms than peak season.
- Regularly analyze your own performance against these Oberhausbergen seasonality benchmarks and adjust your pricing and availability strategy accordingly.
Best Areas for Airbnb Investment in Oberhausbergen (2025)
Exploring the top neighborhoods for short-term rentals in Oberhausbergen? This section highlights key areas, outlining why they are attractive for hosts and guests, along with notable local attractions. Consider these locations based on your target guest profile and investment strategy.
| Neighborhood / Area | Why Host Here? (Target Guests & Appeal) | Key Attractions & Landmarks |
|---|---|---|
| Place de l'Ancienne Douane | Historic and picturesque square in Strasbourg, attracting tourists with its charming ambiance and proximity to key attractions. | Strasbourg Cathedral, Maison Kammerzell, Petite France, Palais Rohan |
| La Petite France | Famous historic district known for its well-preserved medieval buildings and canals, perfect for tourists wanting to experience local culture and history. | Canals of Petite France, Ponts Couverts, Alsatian Museum, Église Saint-Pierre-le-Jeune |
| Strasbourg European Quarter | Important political and cultural district, hosting various European institutions, ideal for business travelers and tourists alike. | European Parliament, Palais de l'Europe, Parc de l'Europa, Rivetoile shopping center |
| Orangerie Park | Beautiful park area in Strasbourg, popular for its green spaces and the nearby European institutions, great for families and outdoor enthusiasts. | Parc de l'Orangerie, Reptilarium, Bois de la Robertsau |
| Schiltigheim | Suburb known for its local breweries and cultural events, provides a more local experience and is close to Strasbourg. | Brasseries de Schiltigheim, Le Parc de la Citadelle |
| Kehl | Nearby German town offering a unique cross-border experience, popular with visitors wanting to explore both France and Germany. | Rhine Bridge, Kehl Town Center, Zehnder's Café |
| Oberhausbergen center | Charming village atmosphere with a close-knit community vibe, offering local experiences and is just a short distance from Strasbourg. | Local Markets, Village Churches |
| Saverne | Charming town known for its historical sites and castles, it's a bit farther but offers a different side of Alsace culture and history. | Château des Rohan, Lorient Canal, Vosges Mountains nearby |
Understanding Airbnb License Requirements & STR Laws in Oberhausbergen (2025)
With 17% of listings showing registration in 2025, understanding potential Airbnb license requirements is crucial in Oberhausbergen. Always verify the latest short term rental regulations and Airbnb license requirements directly with local government authorities for Oberhausbergen to ensure full compliance before hosting.
(Source: AirROI data, 2025, based on 17% licensed listings)
Top Performing Airbnb Properties in Oberhausbergen (2025)
Benchmark your potential! Explore examples of top-performing Airbnb properties in Oberhausbergenbased on Trailing Twelve Month (TTM) revenue. Analyze their characteristics, revenue, occupancy rate, and ADR to understand what drives success in this market.
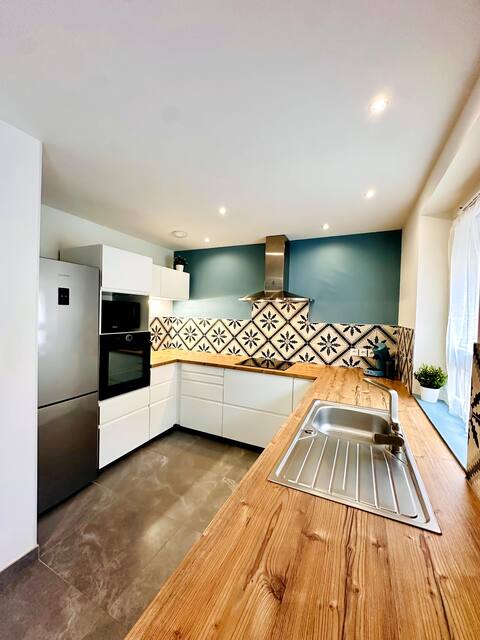
La Casa Joca
Entire Place • 2 bedrooms
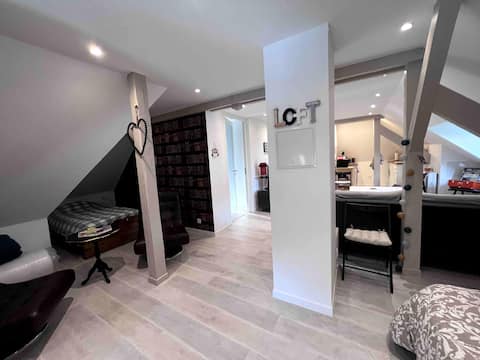
Entire new loft type property
Entire Place • 2 bedrooms
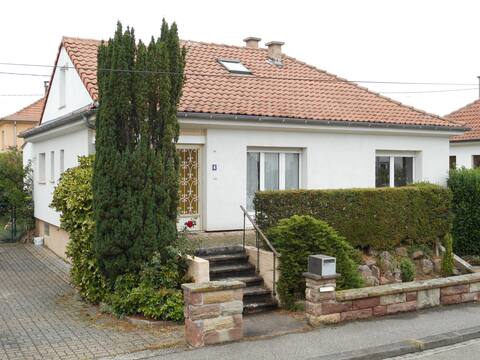
Quiet single-family home
Entire Place • 3 bedrooms
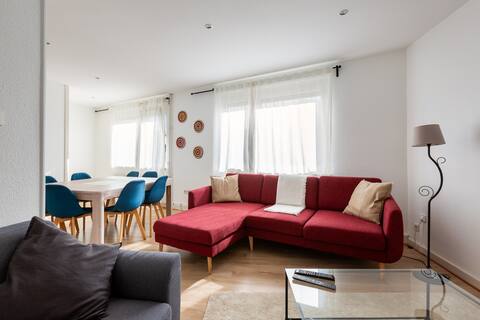
Hosting
Entire Place • 2 bedrooms
Cozy 2 room apt at the gates of Strasbourg
Entire Place • 1 bedroom

ORANA
Entire Place • 3 bedrooms
Note: Performance varies based on location, size, amenities, seasonality, and management quality. Data reflects the past 12 months.
Top Performing Airbnb Hosts in Oberhausbergen (2025)
Learn from the best! This table showcases top-performing Airbnb hosts in Oberhausbergen based on the number of properties managed and estimated total revenue over the past year. Analyze their scale and performance metrics.
| Host Name | Properties | Grossing Revenue | Stay Reviews | Avg Rating |
|---|---|---|---|---|
| Camille | 1 | $31,480 | 135 | 4.87/5.0 |
| Philippe | 1 | $26,166 | 37 | 5.00/5.0 |
| Joseph | 1 | $26,052 | 104 | 4.79/5.0 |
| Mélissa | 1 | $24,324 | 37 | 4.84/5.0 |
| Léo | 1 | $17,841 | 34 | 4.82/5.0 |
| Valérie | 1 | $16,709 | 37 | 4.84/5.0 |
| Marie-Laure | 1 | $13,310 | 32 | 4.91/5.0 |
| Annie | 1 | $12,023 | 128 | 4.93/5.0 |
| Romain | 1 | $9,856 | 40 | 4.88/5.0 |
| Jeannine | 2 | $7,774 | 45 | 4.96/5.0 |
Analyzing the strategies of top hosts, such as their property selection, pricing, and guest communication, can offer valuable lessons for optimizing your own Airbnb operations in Oberhausbergen.
Dive Deeper: Advanced Oberhausbergen STR Market Data (2025)
Ready to unlock more insights? AirROI provides access to advanced metrics and comprehensive Airbnb data for Oberhausbergen. Explore detailed analytics beyond this report to refine your investment strategy, optimize pricing, and maximize your vacation rental profits.
Explore Advanced MetricsOberhausbergen Short-Term Rental Market Composition (2025): Property & Room Types
Room Type Distribution
Property Type Distribution
Market Composition Insights for Oberhausbergen
- The Oberhausbergen Airbnb market composition is heavily skewed towards Entire Home/Apt listings, which make up 72.2% of the 18 active rentals. This indicates strong guest preference for privacy and space.
- Looking at the property type distribution in Oberhausbergen, Apartment/Condo properties are the most common (61.1%), reflecting the local real estate landscape.
- Houses represent a significant 27.8% portion, catering likely to families or larger groups.
- The presence of 11.1% Hotel/Boutique listings indicates integration with traditional hospitality.
Oberhausbergen Airbnb Room Capacity Analysis (2025): Bedroom Distribution
Distribution of Listings by Number of Bedrooms
Room Capacity Insights for Oberhausbergen
- The dominant room capacity in Oberhausbergen is 2 bedrooms listings, making up 33.3% of the market. This suggests a strong demand for properties suitable for couples or solo travelers.
- Together, 2 bedrooms and 1 bedroom properties represent 61.1% of the active Airbnb listings in Oberhausbergen, indicating a high concentration in these sizes.
Oberhausbergen Vacation Rental Guest Capacity Trends (2025)
Distribution of Listings by Guest Capacity
Guest Capacity Insights for Oberhausbergen
- The most common guest capacity trend in Oberhausbergen vacation rentals is listings accommodating 5 guests (22.2%). This suggests the primary traveler segment is likely larger groups.
- Properties designed for 5 guests and 4 guests dominate the Oberhausbergen STR market, accounting for 38.9% of listings.
- 16.7% of properties accommodate 6+ guests, serving the market segment for larger families or group travel in Oberhausbergen.
- On average, properties in Oberhausbergen are equipped to host 3.2 guests.
Oberhausbergen Airbnb Booking Patterns (2025): Available vs. Booked Days
Available Days Distribution
Booked Days Distribution
Booking Pattern Insights for Oberhausbergen
- The most common availability pattern in Oberhausbergen falls within the 271-366 days range, representing 44.4% of listings. This suggests many properties have significant open periods on their calendars.
- Approximately 72.2% of listings show high availability (181+ days open annually), indicating potential for increased bookings or specific owner usage patterns.
- For booked days, the 91-180 days range is most frequent in Oberhausbergen (33.3%), reflecting common guest stay durations or potential owner blocking patterns.
- A notable 27.8% of properties secure long booking periods (181+ days booked per year), highlighting successful long-term rental strategies or significant owner usage.
Oberhausbergen Airbnb Minimum Stay Requirements Analysis
Distribution of Listings by Minimum Night Requirement
1 Night
2 listings
13.3% of total
2 Nights
11 listings
73.3% of total
4-6 Nights
1 listings
6.7% of total
30+ Nights
1 listings
6.7% of total
Key Insights
- The most prevalent minimum stay requirement in Oberhausbergen is 2 Nights, adopted by 73.3% of listings. This highlights the market's preference for shorter, flexible bookings.
- A strong majority (86.6%) of the Oberhausbergen Airbnb data shows acceptance of very short stays (1-2 nights), indicating a dynamic, high-turnover market.
Recommendations
- Align with the market by considering a 2 Nights minimum stay, as 73.3% of Oberhausbergen hosts use this setting.
- If feasible, allowing 1-night stays, especially midweek or during low season, could capture last-minute bookings, as only 13.3% currently do.
- A 2-night minimum appears standard (73.3%). Consider this for weekends or peak periods.
- Explore offering discounts for stays of 30+ nights to attract the 6.7% of the market seeking extended stays.
- Adjust minimum nights based on seasonality – potentially shorter during low season and longer during peak demand periods in Oberhausbergen.
Oberhausbergen Airbnb Cancellation Policy Trends Analysis (2025)
Flexible
4 listings
26.7% of total
Moderate
4 listings
26.7% of total
Firm
3 listings
20% of total
Strict
4 listings
26.7% of total
Cancellation Policy Insights for Oberhausbergen
- The prevailing Airbnb cancellation policy trend in Oberhausbergen is Flexible, used by 26.7% of listings.
- There's a relatively balanced mix between guest-friendly (53.4%) and stricter (46.7%) policies, offering choices for different guest needs.
Recommendations for Hosts
- Consider adopting a Flexible policy to align with the 26.7% market standard in Oberhausbergen.
- Regularly review your cancellation policy against competitors and market demand shifts in Oberhausbergen.
Oberhausbergen STR Booking Lead Time Analysis (2025)
Average Booking Lead Time by Month
Booking Lead Time Insights for Oberhausbergen
- The overall average booking lead time for vacation rentals in Oberhausbergen is 37 days.
- Guests book furthest in advance for stays during December (average 61 days), likely coinciding with peak travel demand or local events.
- The shortest booking windows occur for stays in March (average 19 days), indicating more last-minute travel plans during this time.
- Seasonally, Summer (50 days avg.) sees the longest lead times, while Spring (29 days avg.) has the shortest, reflecting typical travel planning cycles.
Recommendations for Hosts
- Use the overall average lead time (37 days) as a baseline for your pricing and availability strategy in Oberhausbergen.
- For December stays, consider implementing length-of-stay discounts or slightly higher rates for bookings made less than 61 days out to capitalize on advance planning.
- Target marketing efforts for the Summer season well in advance (at least 50 days) to capture early planners.
- Monitor your own booking lead times against these Oberhausbergen averages to identify opportunities for dynamic pricing adjustments.
Popular & Essential Airbnb Amenities in Oberhausbergen (2025)
Amenity Prevalence
Amenity Insights for Oberhausbergen
- Popular amenities like Free parking on premises, Washer, Hot water are common but not universal. Offering these can provide a competitive edge.
- Warning: Wifi is not universally provided but is considered essential globally. Ensure reliable Wifi is offered.
Recommendations for Hosts
- Consider adding popular differentiators like Free parking on premises or Washer to increase appeal.
- Highlight unique or less common amenities you offer (e.g., hot tub, dedicated workspace, EV charger) in your listing description and photos.
- Regularly check competitor amenities in Oberhausbergen to stay competitive.
Oberhausbergen Airbnb Guest Demographics & Profile Analysis (2025)
Guest Profile Summary for Oberhausbergen
- The typical guest profile for Airbnb in Oberhausbergen consists of primarily domestic travelers (67%), often arriving from nearby Strasbourg, typically belonging to the Post-2000s (Gen Z/Alpha) group (50%), primarily speaking French or English.
- Domestic travelers account for 67.0% of guests.
- Key international markets include France (67%) and Germany (8.5%).
- Top languages spoken are French (34.8%) followed by English (32.9%).
- A significant demographic segment is the Post-2000s (Gen Z/Alpha) group, representing 50% of guests.
Recommendations for Hosts
- Target domestic marketing efforts towards travelers from Strasbourg and Toulouse.
- Tailor amenities and listing descriptions to appeal to the dominant Post-2000s (Gen Z/Alpha) demographic (e.g., highlight fast WiFi, smart home features, local guides).
- Highlight unique local experiences or amenities relevant to the primary guest profile.
- Consider seasonal promotions aligned with peak travel times for key origin markets.
Nearby Short-Term Rental Market Comparison
How does the Oberhausbergen Airbnb market stack up against its neighbors? Compare key performance metrics like average monthly revenue, ADR, and occupancy rates in surrounding areas to understand the broader regional STR landscape.
| Market | Active Properties | Monthly Revenue | Daily Rate | Avg. Occupancy |
|---|---|---|---|---|
| Vitznau | 29 | $4,171 | $333.53 | 51% |
| Lucerne | 371 | $3,870 | $260.48 | 54% |
| Ittenheim | 19 | $3,672 | $228.19 | 45% |
| Furdenheim | 16 | $3,576 | $330.05 | 50% |
| Schwyz | 18 | $3,491 | $251.34 | 51% |
| Weggis | 48 | $3,444 | $251.92 | 49% |
| Meggen | 10 | $3,324 | $212.62 | 58% |
| Osenbach | 23 | $3,150 | $276.55 | 39% |
| Le Valtin | 18 | $3,072 | $289.72 | 38% |
| Griesheim-près-Molsheim | 19 | $3,065 | $263.48 | 41% |