Nancy Airbnb Market Analysis 2025: Short Term Rental Data & Vacation Rental Statistics in Grand Est, France
Is Airbnb profitable in Nancy in 2025? Explore comprehensive Airbnb analytics for Nancy, Grand Est, France to uncover income potential. This 2025 STR market report for Nancy, based on AirROI data from April 2024 to March 2025, reveals key trends in the market of 832 active listings.
Whether you're considering an Airbnb investment in Nancy, optimizing your existing vacation rental, or exploring rental arbitrage opportunities, understanding the Nancy Airbnb data is crucial. Understanding the local regulations is key to maximizing your short term rental income potential. Let's dive into the specifics.
Key Nancy Airbnb Performance Metrics Overview
Monthly Airbnb Revenue Variations & Income Potential in Nancy (2025)
Understanding the monthly revenue variations for Airbnb listings in Nancy is key to maximizing your short term rental income potential. Seasonality significantly impacts earnings. Our analysis, based on data from the past 12 months, shows that the peak revenue month for STRs in Nancy is typically May, while March often presents the lowest earnings, highlighting opportunities for strategic pricing adjustments during shoulder and low seasons. Explore the typical Airbnb income in Nancy across different performance tiers:
- Best-in-class properties (Top 10%) achieve $2,445+ monthly, often utilizing dynamic pricing and superior guest experiences.
- Strong performing properties (Top 25%) earn $1,685 or more, indicating effective management and desirable locations/amenities.
- Typical properties (Median) generate around $1,129 per month, representing the average market performance.
- Entry-level properties (Bottom 25%) see earnings around $634, often with potential for optimization.
Average Monthly Airbnb Earnings Trend in Nancy
Nancy Airbnb Occupancy Rate Trends (2025)
Maximize your bookings by understanding the Nancy STR occupancy trends. Seasonal demand shifts significantly influence how often properties are booked. Typically, Decembersees the highest demand (peak season occupancy), while March experiences the lowest (low season). Effective strategies, like adjusting minimum stays or offering promotions, can boost occupancy during slower periods. Here's how different property tiers perform in Nancy:
- Best-in-class properties (Top 10%) achieve 83%+ occupancy, indicating high desirability and potentially optimized availability.
- Strong performing properties (Top 25%) maintain 69% or higher occupancy, suggesting good market fit and guest satisfaction.
- Typical properties (Median) have an occupancy rate around 47%.
- Entry-level properties (Bottom 25%) average 24% occupancy, potentially facing higher vacancy.
Average Monthly Occupancy Rate Trend in Nancy
Average Daily Rate (ADR) Airbnb Trends in Nancy (2025)
Effective short term rental pricing strategy in Nancy involves understanding monthly ADR fluctuations. The Average Daily Rate (ADR) for Airbnb in Nancy typically peaks in December and dips lowest during April. Leveraging Airbnb dynamic pricing tools or strategies based on this seasonality can significantly boost revenue. Here's a look at the typical nightly rates achieved:
- Best-in-class properties (Top 10%) command rates of $135+ per night, often due to premium features or locations.
- Strong performing properties (Top 25%) achieve nightly rates of $94 or more.
- Typical properties (Median) charge around $67 per night.
- Entry-level properties (Bottom 25%) earn around $52 per night.
Average Daily Rate (ADR) Trend by Month in Nancy
Get Live Nancy Market Intelligence 👇

Explore Real-time Analytics
Airbnb Seasonality Analysis & Trends in Nancy (2025)
Peak Season (May, June, April)
- Revenue averages $1,693 per month
- Occupancy rates average 46.2%
- Daily rates average $82
Shoulder Season
- Revenue averages $1,328 per month
- Occupancy maintains around 50.5%
- Daily rates hold near $84
Low Season (January, February, March)
- Revenue drops to average $931 per month
- Occupancy decreases to average 40.5%
- Daily rates adjust to average $83
Seasonality Insights for Nancy
- The Airbnb seasonality in Nancy shows moderate seasonality with distinct peak and low periods. While the sections above show seasonal averages, it's also insightful to look at the extremes:
- During the high season, the absolute peak month showcases Nancy's highest earning potential, with monthly revenues capable of climbing to $1,744, occupancy reaching a high of 55.0%, and ADRs peaking at $89.
- Conversely, the slowest single month of the year, typically falling within the low season, marks the market's lowest point. In this month, revenue might dip to $868, occupancy could drop to 37.1%, and ADRs may adjust down to $81.
- Understanding both the seasonal averages and these monthly peaks and troughs in revenue, occupancy, and ADR is crucial for maximizing your Airbnb profit potential in Nancy.
Seasonal Strategies for Maximizing Profit
- Peak Season: Maximize revenue through premium pricing and potentially longer minimum stays. Ensure high availability.
- Low Season: Offer competitive pricing, special promotions (e.g., extended stay discounts), and flexible cancellation policies. Target off-season travelers like remote workers or budget-conscious guests.
- Shoulder Seasons: Implement dynamic pricing that balances peak and low rates. Target weekend travelers or specific events. Offer slightly more flexible terms than peak season.
- Regularly analyze your own performance against these Nancy seasonality benchmarks and adjust your pricing and availability strategy accordingly.
Best Areas for Airbnb Investment in Nancy (2025)
Exploring the top neighborhoods for short-term rentals in Nancy? This section highlights key areas, outlining why they are attractive for hosts and guests, along with notable local attractions. Consider these locations based on your target guest profile and investment strategy.
| Neighborhood / Area | Why Host Here? (Target Guests & Appeal) | Key Attractions & Landmarks |
|---|---|---|
| Place Stanislas | This UNESCO World Heritage site is famous for its stunning architecture and parks. It attracts a significant number of tourists, making it a prime location for Airbnb investments. | Place Stanislas, Musee des Beaux-Arts, Jardin de la Pepiniere, Opera de Nancy, Hotel de Ville |
| Vélodrome de Nancy | Located near the historic center, this area is popular for sporting events and cultural activities. It draws visitors interested in local events, making it lucrative for short-term rentals. | Vélodrome de Nancy, Parc de la Pépinière, Musee de l'Ecole de Nancy, Nancy Grand Coeur, Zenith de Nancy |
| Nancy Old Town | The charming old town features narrow streets and beautiful buildings, appealing to tourists who enjoy history and culture. Its vibrant atmosphere is perfect for Airbnb hosting. | Rue des Boulangers, Cathedrale de Nancy, Palais Ducal, Place de la Carriere, Place de la Concorde |
| Rives de Meurthe | This riverside area offers a relaxed atmosphere with beautiful views. It is a great spot for nature lovers and those looking for leisure activities, making it suitable for Airbnb. | La Meurthe promenade, Parc de l'Esplanade, Musee de l'Histoire du Fer, The Botanical Garden, Les Jardins d'Eau |
| Saint-Nicolas-de-Port | Close to Nancy, this area has a strong local community and historical sites. It attracts visitors looking to explore beyond the city center. | Basilique Saint-Nicolas, Chateau de Montaigu, Parc de la Planchette, Local markets, Cultural festivals |
| Laxou | This suburb is well-connected to Nancy, providing quieter accommodation options for families and groups. It’s attractive for those wanting to explore the region. | Parc de l'Ermitage, Fort de Villers, Local parks, Shopping centers, Nearby cycling paths |
| Heillecourt | A tranquil residential area that is gaining popularity among short-term visitors seeking affordable yet comfortable stays near Nancy. | Local parks, Entertainment venues, Family-friendly activities, Nearby transportation links, Cafes and shops |
| Tomblaine | This area offers a mix of residential and commercial spaces, appealing to visitors for its proximity to Nancy while providing a local experience. | Parc de l'Etang, Shopping malls, Cultural events, Sporting facilities, Community parks |
Understanding Airbnb License Requirements & STR Laws in Nancy (2025)
With 12% of listings showing registration in 2025, understanding potential Airbnb license requirements is crucial in Nancy. Always verify the latest short term rental regulations and Airbnb license requirements directly with local government authorities for Nancy to ensure full compliance before hosting.
(Source: AirROI data, 2025, based on 12% licensed listings)
Top Performing Airbnb Properties in Nancy (2025)
Benchmark your potential! Explore examples of top-performing Airbnb properties in Nancybased on Trailing Twelve Month (TTM) revenue. Analyze their characteristics, revenue, occupancy rate, and ADR to understand what drives success in this market.

Rock in Share - Le Joli Coeur
Entire Place • 2 bedrooms
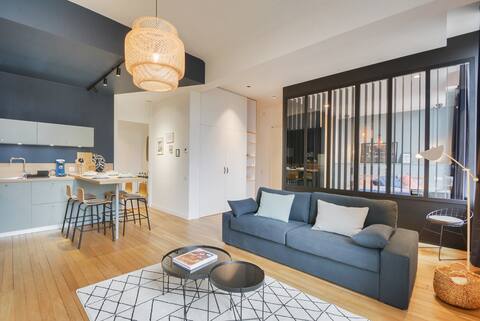
Entire loft Stylated and Friendly in Nancy Centre
Entire Place • 5 bedrooms

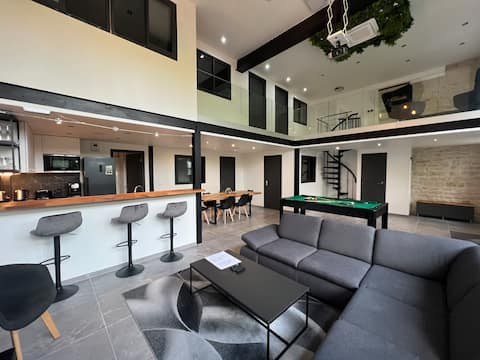
Mega Joan of Arc Billiards Baby
Entire Place • 3 bedrooms
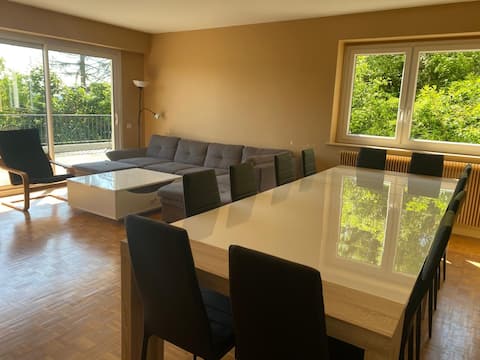
Villa Maraboue
Entire Place • 7 bedrooms
LE FOCH! 110m2 atypical Gare-topappartnancy
Entire Place • 2 bedrooms

Rock in Share - L'Annexe de Stanislas
Entire Place • 2 bedrooms
Note: Performance varies based on location, size, amenities, seasonality, and management quality. Data reflects the past 12 months.
Top Performing Airbnb Hosts in Nancy (2025)
Learn from the best! This table showcases top-performing Airbnb hosts in Nancy based on the number of properties managed and estimated total revenue over the past year. Analyze their scale and performance metrics.
| Host Name | Properties | Grossing Revenue | Stay Reviews | Avg Rating |
|---|---|---|---|---|
| Hugues | 59 | $824,275 | 2099 | 4.27/5.0 |
| Agence COCOONR / BOOK&PAY | 53 | $707,907 | 1649 | 4.34/5.0 |
| Héloïse | 28 | $462,533 | 1900 | 4.83/5.0 |
| Kevin Et L'Équipe Rock In Shar | 10 | $394,252 | 144 | 4.19/5.0 |
| Nicolas | 9 | $312,304 | 636 | 4.88/5.0 |
| CÔME Conciergerie | 11 | $188,268 | 245 | 4.72/5.0 |
| Slocations | 9 | $155,825 | 1496 | 4.82/5.0 |
| Gary | 3 | $125,112 | 53 | 4.44/5.0 |
| Hômtimise | 4 | $118,112 | 147 | 4.80/5.0 |
| David | 3 | $101,783 | 170 | 4.93/5.0 |
Analyzing the strategies of top hosts, such as their property selection, pricing, and guest communication, can offer valuable lessons for optimizing your own Airbnb operations in Nancy.
Dive Deeper: Advanced Nancy STR Market Data (2025)
Ready to unlock more insights? AirROI provides access to advanced metrics and comprehensive Airbnb data for Nancy. Explore detailed analytics beyond this report to refine your investment strategy, optimize pricing, and maximize your vacation rental profits.
Explore Advanced MetricsNancy Short-Term Rental Market Composition (2025): Property & Room Types
Room Type Distribution
Property Type Distribution
Market Composition Insights for Nancy
- The Nancy Airbnb market composition is heavily skewed towards Entire Home/Apt listings, which make up 91.5% of the 832 active rentals. This indicates strong guest preference for privacy and space.
- Looking at the property type distribution in Nancy, Apartment/Condo properties are the most common (91%), reflecting the local real estate landscape.
- Smaller segments like hotel/boutique, others, outdoor/unique (combined 2.0%) offer potential for unique stay experiences.
Nancy Airbnb Room Capacity Analysis (2025): Bedroom Distribution
Distribution of Listings by Number of Bedrooms
Room Capacity Insights for Nancy
- The dominant room capacity in Nancy is 1 bedroom listings, making up 54.3% of the market. This suggests a strong demand for properties suitable for couples or solo travelers.
- Together, 1 bedroom and 2 bedrooms properties represent 77.9% of the active Airbnb listings in Nancy, indicating a high concentration in these sizes.
- With over half the market (54.3%) consisting of studios or 1-bedroom units, Nancy is particularly well-suited for individuals or couples.
- Listings with 3+ bedrooms (8.5%) represent a smaller niche, potentially indicating an underserved market for larger group accommodations in Nancy.
Nancy Vacation Rental Guest Capacity Trends (2025)
Distribution of Listings by Guest Capacity
Guest Capacity Insights for Nancy
- The most common guest capacity trend in Nancy vacation rentals is listings accommodating 2 guests (41.7%). This suggests the primary traveler segment is likely couples or solo travelers.
- Properties designed for 2 guests and 4 guests dominate the Nancy STR market, accounting for 70.8% of listings.
- A significant 44.7% of listings cater specifically to 1-2 guests, highlighting strong demand from couples and solo travelers in Nancy.
- 11.8% of properties accommodate 6+ guests, serving the market segment for larger families or group travel in Nancy.
- On average, properties in Nancy are equipped to host 3.1 guests.
Nancy Airbnb Booking Patterns (2025): Available vs. Booked Days
Available Days Distribution
Booked Days Distribution
Booking Pattern Insights for Nancy
- The most common availability pattern in Nancy falls within the 271-366 days range, representing 32.8% of listings. This suggests many properties have significant open periods on their calendars.
- Approximately 63.9% of listings show high availability (181+ days open annually), indicating potential for increased bookings or specific owner usage patterns.
- For booked days, the 91-180 days range is most frequent in Nancy (30%), reflecting common guest stay durations or potential owner blocking patterns.
- A notable 37.8% of properties secure long booking periods (181+ days booked per year), highlighting successful long-term rental strategies or significant owner usage.
Nancy Airbnb Minimum Stay Requirements Analysis
Distribution of Listings by Minimum Night Requirement
1 Night
300 listings
40.7% of total
2 Nights
224 listings
30.4% of total
3 Nights
111 listings
15% of total
4-6 Nights
41 listings
5.6% of total
7-29 Nights
15 listings
2% of total
30+ Nights
47 listings
6.4% of total
Key Insights
- The most prevalent minimum stay requirement in Nancy is 1 Night, adopted by 40.7% of listings. This highlights the market's preference for shorter, flexible bookings.
- A strong majority (71.1%) of the Nancy Airbnb data shows acceptance of very short stays (1-2 nights), indicating a dynamic, high-turnover market.
Recommendations
- Align with the market by considering a 1 Night minimum stay, as 40.7% of Nancy hosts use this setting.
- Explore offering discounts for stays of 30+ nights to attract the 6.4% of the market seeking extended stays.
- Adjust minimum nights based on seasonality – potentially shorter during low season and longer during peak demand periods in Nancy.
Nancy Airbnb Cancellation Policy Trends Analysis (2025)
Flexible
254 listings
36.2% of total
Moderate
298 listings
42.5% of total
Firm
68 listings
9.7% of total
Strict
82 listings
11.7% of total
Cancellation Policy Insights for Nancy
- The prevailing Airbnb cancellation policy trend in Nancy is Moderate, used by 42.5% of listings.
- The market strongly favors guest-friendly terms, with 78.7% of listings offering Flexible or Moderate policies. This suggests guests in Nancy may expect booking flexibility.
Recommendations for Hosts
- Consider adopting a Moderate policy to align with the 42.5% market standard in Nancy.
- Using a Strict policy might deter some guests, as only 11.7% of listings use it. Evaluate if potential revenue protection outweighs possible lower booking rates.
- Regularly review your cancellation policy against competitors and market demand shifts in Nancy.
Nancy STR Booking Lead Time Analysis (2025)
Average Booking Lead Time by Month
Booking Lead Time Insights for Nancy
- The overall average booking lead time for vacation rentals in Nancy is 33 days.
- Guests book furthest in advance for stays during June (average 54 days), likely coinciding with peak travel demand or local events.
- The shortest booking windows occur for stays in March (average 30 days), indicating more last-minute travel plans during this time.
- Seasonally, Summer (44 days avg.) sees the longest lead times, while Winter (32 days avg.) has the shortest, reflecting typical travel planning cycles.
Recommendations for Hosts
- Use the overall average lead time (33 days) as a baseline for your pricing and availability strategy in Nancy.
- For June stays, consider implementing length-of-stay discounts or slightly higher rates for bookings made less than 54 days out to capitalize on advance planning.
- Target marketing efforts for the Summer season well in advance (at least 44 days) to capture early planners.
- Monitor your own booking lead times against these Nancy averages to identify opportunities for dynamic pricing adjustments.
Popular & Essential Airbnb Amenities in Nancy (2025)
Amenity Prevalence
Amenity Insights for Nancy
- Essential amenities in Nancy that guests expect include: Heating, Wifi, Kitchen. Lacking these (any) could significantly impact bookings.
- Popular amenities like Hot water, TV, Essentials are common but not universal. Offering these can provide a competitive edge.
Recommendations for Hosts
- Ensure your listing includes all essential amenities for Nancy: Heating, Wifi, Kitchen.
- Prioritize adding missing essentials: Heating, Wifi, Kitchen.
- Consider adding popular differentiators like Hot water or TV to increase appeal.
- Highlight unique or less common amenities you offer (e.g., hot tub, dedicated workspace, EV charger) in your listing description and photos.
- Regularly check competitor amenities in Nancy to stay competitive.
Nancy Airbnb Guest Demographics & Profile Analysis (2025)
Guest Profile Summary for Nancy
- The typical guest profile for Airbnb in Nancy consists of primarily domestic travelers (72%), often arriving from nearby Paris, typically belonging to the Post-2000s (Gen Z/Alpha) group (50%), primarily speaking French or English.
- Domestic travelers account for 71.5% of guests.
- Key international markets include France (71.5%) and Germany (8.4%).
- Top languages spoken are French (36.9%) followed by English (33.4%).
- A significant demographic segment is the Post-2000s (Gen Z/Alpha) group, representing 50% of guests.
Recommendations for Hosts
- Target domestic marketing efforts towards travelers from Paris and Nancy.
- Tailor amenities and listing descriptions to appeal to the dominant Post-2000s (Gen Z/Alpha) demographic (e.g., highlight fast WiFi, smart home features, local guides).
- Highlight unique local experiences or amenities relevant to the primary guest profile.
- Consider seasonal promotions aligned with peak travel times for key origin markets.
Nearby Short-Term Rental Market Comparison
How does the Nancy Airbnb market stack up against its neighbors? Compare key performance metrics like average monthly revenue, ADR, and occupancy rates in surrounding areas to understand the broader regional STR landscape.
| Market | Active Properties | Monthly Revenue | Daily Rate | Avg. Occupancy |
|---|---|---|---|---|
| Ittenheim | 19 | $3,672 | $228.19 | 45% |
| Furdenheim | 16 | $3,576 | $330.05 | 50% |
| Osenbach | 23 | $3,150 | $276.55 | 39% |
| Le Valtin | 18 | $3,072 | $289.72 | 38% |
| Griesheim-près-Molsheim | 19 | $3,065 | $263.48 | 41% |
| Belmont | 13 | $2,931 | $260.89 | 36% |
| Ventron | 82 | $2,809 | $278.41 | 36% |
| Léglise | 21 | $2,804 | $259.32 | 38% |
| Rust | 160 | $2,750 | $187.61 | 52% |
| Libin | 46 | $2,632 | $218.34 | 42% |