Linthal Airbnb Market Analysis 2025: Short Term Rental Data & Vacation Rental Statistics in Grand Est, France
Is Airbnb profitable in Linthal in 2025? Explore comprehensive Airbnb analytics for Linthal, Grand Est, France to uncover income potential. This 2025 STR market report for Linthal, based on AirROI data from April 2024 to March 2025, reveals key trends in the niche market of 21 active listings.
Whether you're considering an Airbnb investment in Linthal, optimizing your existing vacation rental, or exploring rental arbitrage opportunities, understanding the Linthal Airbnb data is crucial. Leveraging the low regulation environment is key to maximizing your short term rental income potential. Let's dive into the specifics.
Key Linthal Airbnb Performance Metrics Overview
Monthly Airbnb Revenue Variations & Income Potential in Linthal (2025)
Understanding the monthly revenue variations for Airbnb listings in Linthal is key to maximizing your short term rental income potential. Seasonality significantly impacts earnings. Our analysis, based on data from the past 12 months, shows that the peak revenue month for STRs in Linthal is typically December, while January often presents the lowest earnings, highlighting opportunities for strategic pricing adjustments during shoulder and low seasons. Explore the typical Airbnb income in Linthal across different performance tiers:
- Best-in-class properties (Top 10%) achieve $3,481+ monthly, often utilizing dynamic pricing and superior guest experiences.
- Strong performing properties (Top 25%) earn $2,245 or more, indicating effective management and desirable locations/amenities.
- Typical properties (Median) generate around $1,274 per month, representing the average market performance.
- Entry-level properties (Bottom 25%) see earnings around $709, often with potential for optimization.
Average Monthly Airbnb Earnings Trend in Linthal
Linthal Airbnb Occupancy Rate Trends (2025)
Maximize your bookings by understanding the Linthal STR occupancy trends. Seasonal demand shifts significantly influence how often properties are booked. Typically, Decembersees the highest demand (peak season occupancy), while January experiences the lowest (low season). Effective strategies, like adjusting minimum stays or offering promotions, can boost occupancy during slower periods. Here's how different property tiers perform in Linthal:
- Best-in-class properties (Top 10%) achieve 81%+ occupancy, indicating high desirability and potentially optimized availability.
- Strong performing properties (Top 25%) maintain 65% or higher occupancy, suggesting good market fit and guest satisfaction.
- Typical properties (Median) have an occupancy rate around 38%.
- Entry-level properties (Bottom 25%) average 24% occupancy, potentially facing higher vacancy.
Average Monthly Occupancy Rate Trend in Linthal
Average Daily Rate (ADR) Airbnb Trends in Linthal (2025)
Effective short term rental pricing strategy in Linthal involves understanding monthly ADR fluctuations. The Average Daily Rate (ADR) for Airbnb in Linthal typically peaks in December and dips lowest during March. Leveraging Airbnb dynamic pricing tools or strategies based on this seasonality can significantly boost revenue. Here's a look at the typical nightly rates achieved:
- Best-in-class properties (Top 10%) command rates of $167+ per night, often due to premium features or locations.
- Strong performing properties (Top 25%) achieve nightly rates of $104 or more.
- Typical properties (Median) charge around $74 per night.
- Entry-level properties (Bottom 25%) earn around $50 per night.
Average Daily Rate (ADR) Trend by Month in Linthal
Get Live Linthal Market Intelligence 👇

Explore Real-time Analytics
Airbnb Seasonality Analysis & Trends in Linthal (2025)
Peak Season (December, August, June)
- Revenue averages $2,304 per month
- Occupancy rates average 56.4%
- Daily rates average $102
Shoulder Season
- Revenue averages $1,778 per month
- Occupancy maintains around 45.3%
- Daily rates hold near $99
Low Season (January, February, March)
- Revenue drops to average $1,137 per month
- Occupancy decreases to average 33.1%
- Daily rates adjust to average $99
Seasonality Insights for Linthal
- The Airbnb seasonality in Linthal shows highly seasonal trends requiring careful strategy. While the sections above show seasonal averages, it's also insightful to look at the extremes:
- During the high season, the absolute peak month showcases Linthal's highest earning potential, with monthly revenues capable of climbing to $2,729, occupancy reaching a high of 63.3%, and ADRs peaking at $110.
- Conversely, the slowest single month of the year, typically falling within the low season, marks the market's lowest point. In this month, revenue might dip to $1,051, occupancy could drop to 27.8%, and ADRs may adjust down to $96.
- Understanding both the seasonal averages and these monthly peaks and troughs in revenue, occupancy, and ADR is crucial for maximizing your Airbnb profit potential in Linthal.
Seasonal Strategies for Maximizing Profit
- Peak Season: Maximize revenue through premium pricing and potentially longer minimum stays. Ensure high availability.
- Low Season: Offer competitive pricing, special promotions (e.g., extended stay discounts), and flexible cancellation policies. Target off-season travelers like remote workers or budget-conscious guests.
- Shoulder Seasons: Implement dynamic pricing that balances peak and low rates. Target weekend travelers or specific events. Offer slightly more flexible terms than peak season.
- Regularly analyze your own performance against these Linthal seasonality benchmarks and adjust your pricing and availability strategy accordingly.
Best Areas for Airbnb Investment in Linthal (2025)
Exploring the top neighborhoods for short-term rentals in Linthal? This section highlights key areas, outlining why they are attractive for hosts and guests, along with notable local attractions. Consider these locations based on your target guest profile and investment strategy.
| Neighborhood / Area | Why Host Here? (Target Guests & Appeal) | Key Attractions & Landmarks |
|---|---|---|
| Linthal Village | Charming French village known for its picturesque scenery and proximity to the Vosges mountains. Ideal for travelers seeking a peaceful retreat with nature activities like hiking and snow sports. | Gorges de la Tümpen, Local hiking trails, Historical village architecture, Scenic viewpoints, Mountain biking routes |
| La Bresse | Popular tourist destination for skiing and outdoor activities throughout the year. Welcomed by families and adventure seekers, it's a prime location for winter sports enthusiasts and summer hikers. | La Bresse Hohneck, Parc de la Bresse, Lac de la Bresse, Cross-country skiing trails, Mountain resorts |
| Gérardmer | Known as the 'Pearl of the Vosges', Gérardmer is famous for its beautiful lake and outdoor activities. A bustling town that attracts tourists year-round for water sports in summer and skiing in winter. | Lac de Gérardmer, Les Lézardes, Ski resorts, Botanical gardens, Gérardmer Ski Station |
| Mulhouse | A vibrant city known for its rich industrial history and cultural diversity. Hosts various museum attractions and is perfect for urban travelers looking for a mix of history, culture, and adventure. | Cité de l'Automobile, Mulhouse Zoological and Botanical Park, Musee du Papier Peint, Historical city center, Art Gallery |
| Colmar | A fairy-tale town famous for its well-preserved old town and Alsace architecture. Attracts tourists looking for a romantic getaway with scenic views and charming streets to explore. | Little Venice, Colmar Unterlinden Museum, Dominican Church, Wine tasting tours, Christmas markets |
| Strasbourg | The capital of the Alsace region, known for its blend of French and German cultures. A stunning city with historical sites that attract visitors year-round, making it a great Airbnb investment. | Strasbourg Cathedral, La Petite France, European Parliament, Riverside cafes, Museums |
| Eguisheim | A quaint village renowned for its wine production and stunning landscapes. Travelers come for vineyard tours and to enjoy the picturesque Alsatian village charm, perfect for weekend getaways. | Wine routes, Château du Haut-Koenigsbourg, Strolling through vineyards, Local wine tasting, Historic town centers |
| Kaysersberg | Known for its scenic beauty and historical buildings, Kaysersberg is a delightful destination for travelers. It's perfect for those interested in wine tourism and exploring Alsace's famous routes. | Kaysersberg Castle, Local vineyards, Historic center, Wine tasting tours, Natural surroundings |
Understanding Airbnb License Requirements & STR Laws in Linthal (2025)
While Linthal, Grand Est, France currently shows low STR regulations, specific Airbnb license requirements might still exist or change. Always verify the latest short term rental regulations and Airbnb license requirements directly with local government authorities for Linthal to ensure full compliance before hosting.
(Source: AirROI data, 2025, based on 5% licensed listings)
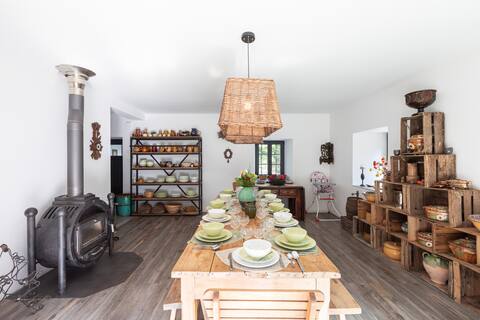
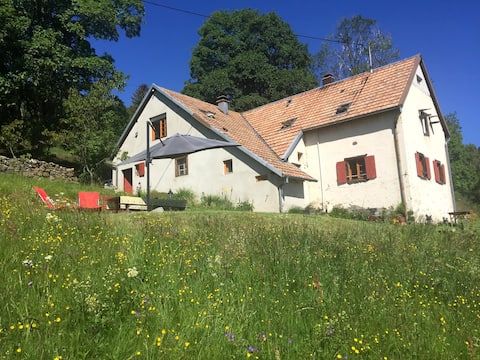
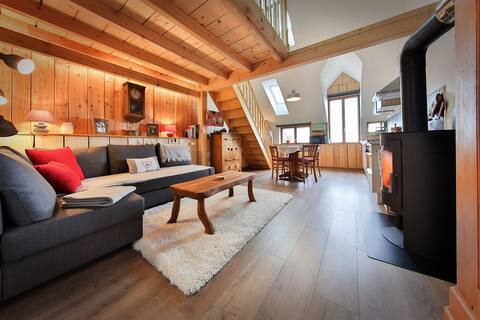
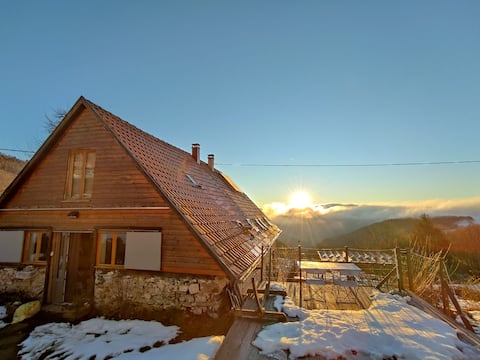
Top Performing Airbnb Properties in Linthal (2025)
Benchmark your potential! Explore examples of top-performing Airbnb properties in Linthalbased on Trailing Twelve Month (TTM) revenue. Analyze their characteristics, revenue, occupancy rate, and ADR to understand what drives success in this market.
La Désirade Grand lodge en Alsace Vosges sud
Entire Place • 5 bedrooms

Lodge Le Rucher cozy little cottage surrounded by nature
Entire Place • 2 bedrooms
Ferme " Les Primevères du Hilsen"
Entire Place • 3 bedrooms

La Grange 4*, harbor of peace at the foot of the Vosges
Entire Place • 2 bedrooms
Gîte "Mon Jardin Nourricier" in the mountain
Entire Place • N/A
Mountain spot in Alsace
Entire Place • 1 bedroom
Note: Performance varies based on location, size, amenities, seasonality, and management quality. Data reflects the past 12 months.
Top Performing Airbnb Hosts in Linthal (2025)
Learn from the best! This table showcases top-performing Airbnb hosts in Linthal based on the number of properties managed and estimated total revenue over the past year. Analyze their scale and performance metrics.
| Host Name | Properties | Grossing Revenue | Stay Reviews | Avg Rating |
|---|---|---|---|---|
| Anastride | 1 | $57,114 | 7 | 5.00/5.0 |
| Aurélie Et Manu | 1 | $37,223 | 124 | 4.99/5.0 |
| Pascale | 1 | $33,637 | 113 | 4.90/5.0 |
| Jeannette | 1 | $26,610 | 36 | 4.94/5.0 |
| Noëlle | 1 | $23,177 | 84 | 5.00/5.0 |
| Carole | 1 | $21,090 | 287 | 4.98/5.0 |
| Sandrine | 2 | $20,251 | 21 | 4.62/5.0 |
| Benoit | 1 | $16,858 | 73 | 4.97/5.0 |
| Christiane | 1 | $16,046 | 37 | 4.92/5.0 |
| Olivier | 1 | $15,844 | 66 | 4.91/5.0 |
Analyzing the strategies of top hosts, such as their property selection, pricing, and guest communication, can offer valuable lessons for optimizing your own Airbnb operations in Linthal.
Dive Deeper: Advanced Linthal STR Market Data (2025)
Ready to unlock more insights? AirROI provides access to advanced metrics and comprehensive Airbnb data for Linthal. Explore detailed analytics beyond this report to refine your investment strategy, optimize pricing, and maximize your vacation rental profits.
Explore Advanced MetricsLinthal Short-Term Rental Market Composition (2025): Property & Room Types
Room Type Distribution
Property Type Distribution
Market Composition Insights for Linthal
- The Linthal Airbnb market composition is heavily skewed towards Entire Home/Apt listings, which make up 100% of the 21 active rentals. This indicates strong guest preference for privacy and space.
- Looking at the property type distribution in Linthal, Apartment/Condo properties are the most common (57.1%), reflecting the local real estate landscape.
- Houses represent a significant 38.1% portion, catering likely to families or larger groups.
- Smaller segments like outdoor/unique (combined 4.8%) offer potential for unique stay experiences.
Linthal Airbnb Room Capacity Analysis (2025): Bedroom Distribution
Distribution of Listings by Number of Bedrooms
Room Capacity Insights for Linthal
- The dominant room capacity in Linthal is 1 bedroom listings, making up 52.4% of the market. This suggests a strong demand for properties suitable for couples or solo travelers.
- Together, 1 bedroom and 2 bedrooms properties represent 71.4% of the active Airbnb listings in Linthal, indicating a high concentration in these sizes.
- With over half the market (52.4%) consisting of studios or 1-bedroom units, Linthal is particularly well-suited for individuals or couples.
Linthal Vacation Rental Guest Capacity Trends (2025)
Distribution of Listings by Guest Capacity
Guest Capacity Insights for Linthal
- The most common guest capacity trend in Linthal vacation rentals is listings accommodating 2 guests (47.6%). This suggests the primary traveler segment is likely couples or solo travelers.
- Properties designed for 2 guests and 4 guests dominate the Linthal STR market, accounting for 71.4% of listings.
- A significant 47.6% of listings cater specifically to 1-2 guests, highlighting strong demand from couples and solo travelers in Linthal.
- 19.1% of properties accommodate 6+ guests, serving the market segment for larger families or group travel in Linthal.
- On average, properties in Linthal are equipped to host 3.7 guests.
Linthal Airbnb Booking Patterns (2025): Available vs. Booked Days
Available Days Distribution
Booked Days Distribution
Booking Pattern Insights for Linthal
- The most common availability pattern in Linthal falls within the 271-366 days range, representing 38.1% of listings. This suggests many properties have significant open periods on their calendars.
- Approximately 71.4% of listings show high availability (181+ days open annually), indicating potential for increased bookings or specific owner usage patterns.
- For booked days, the 31-90 days range is most frequent in Linthal (28.6%), reflecting common guest stay durations or potential owner blocking patterns.
- A notable 33.3% of properties secure long booking periods (181+ days booked per year), highlighting successful long-term rental strategies or significant owner usage.
Linthal Airbnb Minimum Stay Requirements Analysis
Distribution of Listings by Minimum Night Requirement
1 Night
2 listings
13.3% of total
2 Nights
5 listings
33.3% of total
3 Nights
4 listings
26.7% of total
4-6 Nights
2 listings
13.3% of total
30+ Nights
2 listings
13.3% of total
Key Insights
- The most prevalent minimum stay requirement in Linthal is 2 Nights, adopted by 33.3% of listings. This highlights the market's preference for shorter, flexible bookings.
- A significant segment (13.3%) caters to monthly stays (30+ nights) in Linthal, pointing to opportunities in the extended-stay market.
Recommendations
- Align with the market by considering a 2 Nights minimum stay, as 33.3% of Linthal hosts use this setting.
- If feasible, allowing 1-night stays, especially midweek or during low season, could capture last-minute bookings, as only 13.3% currently do.
- A 2-night minimum appears standard (33.3%). Consider this for weekends or peak periods.
- Explore offering discounts for stays of 30+ nights to attract the 13.3% of the market seeking extended stays.
- Adjust minimum nights based on seasonality – potentially shorter during low season and longer during peak demand periods in Linthal.
Linthal Airbnb Cancellation Policy Trends Analysis (2025)
Flexible
5 listings
23.8% of total
Moderate
4 listings
19% of total
Firm
10 listings
47.6% of total
Strict
2 listings
9.5% of total
Cancellation Policy Insights for Linthal
- The prevailing Airbnb cancellation policy trend in Linthal is Firm, used by 47.6% of listings.
- A majority (57.1%) of hosts in Linthal utilize Firm or Strict policies, indicating a market where hosts prioritize booking security.
- Strict cancellation policies are quite rare (9.5%), potentially making listings with this policy less competitive unless justified by high demand or property type.
Recommendations for Hosts
- Consider adopting a Firm policy to align with the 47.6% market standard in Linthal.
- Using a Strict policy might deter some guests, as only 9.5% of listings use it. Evaluate if potential revenue protection outweighs possible lower booking rates.
- Regularly review your cancellation policy against competitors and market demand shifts in Linthal.
Linthal STR Booking Lead Time Analysis (2025)
Average Booking Lead Time by Month
Booking Lead Time Insights for Linthal
- The overall average booking lead time for vacation rentals in Linthal is 52 days.
- Guests book furthest in advance for stays during July (average 103 days), likely coinciding with peak travel demand or local events.
- The shortest booking windows occur for stays in January (average 24 days), indicating more last-minute travel plans during this time.
- Seasonally, Summer (75 days avg.) sees the longest lead times, while Fall (36 days avg.) has the shortest, reflecting typical travel planning cycles.
Recommendations for Hosts
- Use the overall average lead time (52 days) as a baseline for your pricing and availability strategy in Linthal.
- For July stays, consider implementing length-of-stay discounts or slightly higher rates for bookings made less than 103 days out to capitalize on advance planning.
- Target marketing efforts for the Summer season well in advance (at least 75 days) to capture early planners.
- Monitor your own booking lead times against these Linthal averages to identify opportunities for dynamic pricing adjustments.
Popular & Essential Airbnb Amenities in Linthal (2025)
Amenity Prevalence
Amenity Insights for Linthal
- Essential amenities in Linthal that guests expect include: Dishes and silverware, Kitchen, Heating, Coffee maker, Refrigerator, Cooking basics, Free parking on premises, Smoke alarm, Microwave, Hot water. Lacking these (any) could significantly impact bookings.
Recommendations for Hosts
- Ensure your listing includes all essential amenities for Linthal: Dishes and silverware, Kitchen, Heating, Coffee maker, Refrigerator, Cooking basics, Free parking on premises, Smoke alarm, Microwave, Hot water.
- Prioritize adding missing essentials: Smoke alarm, Microwave, Hot water.
- Highlight unique or less common amenities you offer (e.g., hot tub, dedicated workspace, EV charger) in your listing description and photos.
- Regularly check competitor amenities in Linthal to stay competitive.
Linthal Airbnb Guest Demographics & Profile Analysis (2025)
Guest Profile Summary for Linthal
- The typical guest profile for Airbnb in Linthal consists of a mix of domestic (50%) and international guests, with top international origins including Germany, typically belonging to the Post-2000s (Gen Z/Alpha) group (50%), primarily speaking English or French.
- Domestic travelers account for 50.0% of guests.
- Key international markets include France (50%) and Germany (21.4%).
- Top languages spoken are English (34.2%) followed by French (33.2%).
- A significant demographic segment is the Post-2000s (Gen Z/Alpha) group, representing 50% of guests.
Recommendations for Hosts
- Balance marketing efforts between domestic and international channels based on the guest mix.
- Tailor amenities and listing descriptions to appeal to the dominant Post-2000s (Gen Z/Alpha) demographic (e.g., highlight fast WiFi, smart home features, local guides).
- Highlight unique local experiences or amenities relevant to the primary guest profile.
- Consider seasonal promotions aligned with peak travel times for key origin markets.
Nearby Short-Term Rental Market Comparison
How does the Linthal Airbnb market stack up against its neighbors? Compare key performance metrics like average monthly revenue, ADR, and occupancy rates in surrounding areas to understand the broader regional STR landscape.
| Market | Active Properties | Monthly Revenue | Daily Rate | Avg. Occupancy |
|---|---|---|---|---|
| Lauterbrunnen | 525 | $7,079 | $546.45 | 54% |
| La Rivière-Enverse | 17 | $5,972 | $624.02 | 41% |
| Matten bei Interlaken | 52 | $5,674 | $316.63 | 63% |
| Iseltwald | 14 | $5,491 | $331.95 | 58% |
| Habkern | 13 | $5,382 | $344.74 | 50% |
| Interlaken | 288 | $4,987 | $310.52 | 56% |
| Grindelwald | 489 | $4,921 | $345.40 | 57% |
| Zermatt | 734 | $4,604 | $463.00 | 46% |
| Oberhofen am Thunersee | 24 | $4,572 | $265.94 | 55% |
| Sigriswil | 99 | $4,371 | $271.90 | 58% |