Lembach Airbnb Market Analysis 2025: Short Term Rental Data & Vacation Rental Statistics in Grand Est, France
Is Airbnb profitable in Lembach in 2025? Explore comprehensive Airbnb analytics for Lembach, Grand Est, France to uncover income potential. This 2025 STR market report for Lembach, based on AirROI data from April 2024 to March 2025, reveals key trends in the niche market of 20 active listings.
Whether you're considering an Airbnb investment in Lembach, optimizing your existing vacation rental, or exploring rental arbitrage opportunities, understanding the Lembach Airbnb data is crucial. Leveraging the low regulation environment is key to maximizing your short term rental income potential. Let's dive into the specifics.
Key Lembach Airbnb Performance Metrics Overview
Monthly Airbnb Revenue Variations & Income Potential in Lembach (2025)
Understanding the monthly revenue variations for Airbnb listings in Lembach is key to maximizing your short term rental income potential. Seasonality significantly impacts earnings. Our analysis, based on data from the past 12 months, shows that the peak revenue month for STRs in Lembach is typically August, while January often presents the lowest earnings, highlighting opportunities for strategic pricing adjustments during shoulder and low seasons. Explore the typical Airbnb income in Lembach across different performance tiers:
- Best-in-class properties (Top 10%) achieve $3,804+ monthly, often utilizing dynamic pricing and superior guest experiences.
- Strong performing properties (Top 25%) earn $2,157 or more, indicating effective management and desirable locations/amenities.
- Typical properties (Median) generate around $1,336 per month, representing the average market performance.
- Entry-level properties (Bottom 25%) see earnings around $701, often with potential for optimization.
Average Monthly Airbnb Earnings Trend in Lembach
Lembach Airbnb Occupancy Rate Trends (2025)
Maximize your bookings by understanding the Lembach STR occupancy trends. Seasonal demand shifts significantly influence how often properties are booked. Typically, Augustsees the highest demand (peak season occupancy), while January experiences the lowest (low season). Effective strategies, like adjusting minimum stays or offering promotions, can boost occupancy during slower periods. Here's how different property tiers perform in Lembach:
- Best-in-class properties (Top 10%) achieve 74%+ occupancy, indicating high desirability and potentially optimized availability.
- Strong performing properties (Top 25%) maintain 58% or higher occupancy, suggesting good market fit and guest satisfaction.
- Typical properties (Median) have an occupancy rate around 40%.
- Entry-level properties (Bottom 25%) average 24% occupancy, potentially facing higher vacancy.
Average Monthly Occupancy Rate Trend in Lembach
Average Daily Rate (ADR) Airbnb Trends in Lembach (2025)
Effective short term rental pricing strategy in Lembach involves understanding monthly ADR fluctuations. The Average Daily Rate (ADR) for Airbnb in Lembach typically peaks in December and dips lowest during September. Leveraging Airbnb dynamic pricing tools or strategies based on this seasonality can significantly boost revenue. Here's a look at the typical nightly rates achieved:
- Best-in-class properties (Top 10%) command rates of $182+ per night, often due to premium features or locations.
- Strong performing properties (Top 25%) achieve nightly rates of $113 or more.
- Typical properties (Median) charge around $91 per night.
- Entry-level properties (Bottom 25%) earn around $74 per night.
Average Daily Rate (ADR) Trend by Month in Lembach
Get Live Lembach Market Intelligence 👇

Explore Real-time Analytics
Airbnb Seasonality Analysis & Trends in Lembach (2025)
Peak Season (August, December, May)
- Revenue averages $2,544 per month
- Occupancy rates average 58.6%
- Daily rates average $113
Shoulder Season
- Revenue averages $1,821 per month
- Occupancy maintains around 44.6%
- Daily rates hold near $108
Low Season (January, March, November)
- Revenue drops to average $855 per month
- Occupancy decreases to average 21.8%
- Daily rates adjust to average $115
Seasonality Insights for Lembach
- The Airbnb seasonality in Lembach shows highly seasonal trends requiring careful strategy. While the sections above show seasonal averages, it's also insightful to look at the extremes:
- During the high season, the absolute peak month showcases Lembach's highest earning potential, with monthly revenues capable of climbing to $2,651, occupancy reaching a high of 68.6%, and ADRs peaking at $125.
- Conversely, the slowest single month of the year, typically falling within the low season, marks the market's lowest point. In this month, revenue might dip to $634, occupancy could drop to 17.2%, and ADRs may adjust down to $104.
- Understanding both the seasonal averages and these monthly peaks and troughs in revenue, occupancy, and ADR is crucial for maximizing your Airbnb profit potential in Lembach.
Seasonal Strategies for Maximizing Profit
- Peak Season: Maximize revenue through premium pricing and potentially longer minimum stays. Ensure high availability.
- Low Season: Offer competitive pricing, special promotions (e.g., extended stay discounts), and flexible cancellation policies. Target off-season travelers like remote workers or budget-conscious guests.
- Shoulder Seasons: Implement dynamic pricing that balances peak and low rates. Target weekend travelers or specific events. Offer slightly more flexible terms than peak season.
- Regularly analyze your own performance against these Lembach seasonality benchmarks and adjust your pricing and availability strategy accordingly.
Best Areas for Airbnb Investment in Lembach (2025)
Exploring the top neighborhoods for short-term rentals in Lembach? This section highlights key areas, outlining why they are attractive for hosts and guests, along with notable local attractions. Consider these locations based on your target guest profile and investment strategy.
| Neighborhood / Area | Why Host Here? (Target Guests & Appeal) | Key Attractions & Landmarks |
|---|---|---|
| Historic Lembach Village | Charming village with traditional Alsace architecture and a peaceful atmosphere. Ideal for visitors seeking an authentic and tranquil experience in the heart of Alsace, surrounded by nature and history. | La Petite Pierre Regional Nature Park, Château de Lembach, local vineyards, hiking trails, traditional Alsace cuisine restaurants |
| Wissembourg | Nearby border town known for its rich history and scenic canals. Attracts visitors interested in cultural heritage and the beautiful Alsatian landscape. | Wissembourg City Hall, St. Peter and Paul Church, Old Town, Fortifications of Wissembourg, Canal de la Sauer |
| Niederbronn-les-Bains | Spa town famous for its thermal baths, making it attractive for wellness retreats and relaxation getaways. | Thermal baths, Niederbronn Castle, hiking trails, local spas, Casino de Niederbronn |
| Bitche | A historic town with a fortified citadel and scenic views. Offers a mix of history, culture, and outdoor activities. | Bitche Citadel, Fortifications, Museum of Bitche, local parks, hiking in Vosges mountains |
| La Petite Pierre | An attractive commune known for its beautiful landscapes and outdoor activities, appealing to nature lovers and hikers. | La Petite Pierre Castle, Sauer Valley, walking and biking trails, local artisan shops |
| Strasbourg | The capital of Alsace, known for its beautiful old town and European parliament. A major tourist destination that attracts visitors year-round. | La Petite France, Strasbourg Cathedral, European Parliament, Museum of Fine Arts, Botanical Garden |
| Haguenau | A large town with a vibrant cultural scene and historical significance. Great for visitors looking for a mix of city life and relaxation. | Haguenau Historical Museum, St. Georges Church, protected forest, local markets, festivals |
| Sarrebourg | Gateway to the Vosges mountains, known for its natural beauty and outdoor activities. Attracts tourists looking for adventure and nature. | Sarrebourg Green Cinema, the Palais des Congrès, nature reserves, hiking trails around the Vosges, local vineyards |
Understanding Airbnb License Requirements & STR Laws in Lembach (2025)
While Lembach, Grand Est, France currently shows low STR regulations, specific Airbnb license requirements might still exist or change. Always verify the latest short term rental regulations and Airbnb license requirements directly with local government authorities for Lembach to ensure full compliance before hosting.
(Source: AirROI data, 2025, finding no licensed listings among those analyzed)
Top Performing Airbnb Properties in Lembach (2025)
Benchmark your potential! Explore examples of top-performing Airbnb properties in Lembachbased on Trailing Twelve Month (TTM) revenue. Analyze their characteristics, revenue, occupancy rate, and ADR to understand what drives success in this market.
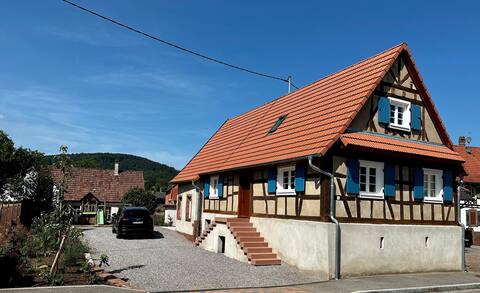
Villa "Au Jardin de Mamie"
Entire Place • 5 bedrooms

Villa des Châtaigniers
Entire Place • 5 bedrooms
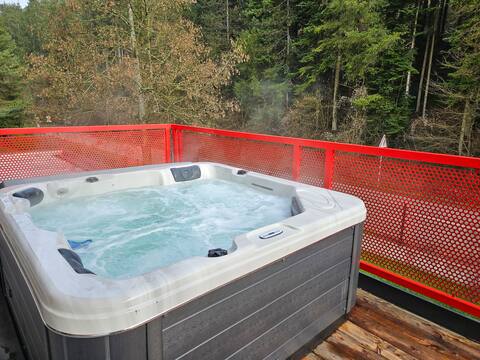
Spacious apartment with Jacuzzi and Sauna
Entire Place • 2 bedrooms
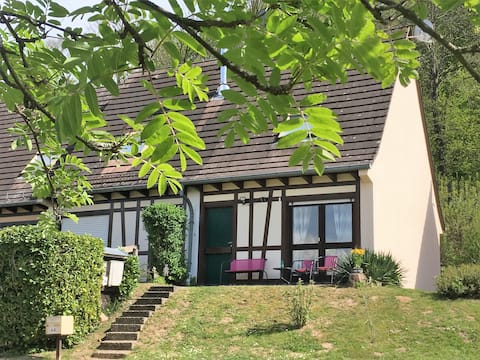
Sunset cottage, pool, Cimes, view
Entire Place • 2 bedrooms
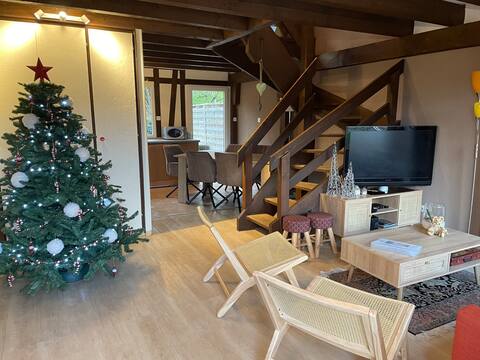
Cottage des Cimes 23-with shared swimming pool
Entire Place • 3 bedrooms

Mattstall, quiet detached house.
Entire Place • 3 bedrooms
Note: Performance varies based on location, size, amenities, seasonality, and management quality. Data reflects the past 12 months.
Top Performing Airbnb Hosts in Lembach (2025)
Learn from the best! This table showcases top-performing Airbnb hosts in Lembach based on the number of properties managed and estimated total revenue over the past year. Analyze their scale and performance metrics.
| Host Name | Properties | Grossing Revenue | Stay Reviews | Avg Rating |
|---|---|---|---|---|
| Loïc | 2 | $117,247 | 226 | 4.70/5.0 |
| Emmanuel | 1 | $27,733 | 90 | 4.93/5.0 |
| Ludovic | 3 | $23,860 | 82 | 4.91/5.0 |
| Laurent | 1 | $23,053 | 76 | 4.89/5.0 |
| Veronique | 1 | $22,362 | 12 | 4.75/5.0 |
| Anne-Catherine | 1 | $20,407 | 68 | 4.91/5.0 |
| MatElo | 1 | $18,506 | 23 | 4.87/5.0 |
| Pascal | 1 | $18,240 | 133 | 4.72/5.0 |
| Hubert | 1 | $17,588 | 23 | 4.74/5.0 |
| Stéphanie | 1 | $14,358 | 19 | 4.95/5.0 |
Analyzing the strategies of top hosts, such as their property selection, pricing, and guest communication, can offer valuable lessons for optimizing your own Airbnb operations in Lembach.
Dive Deeper: Advanced Lembach STR Market Data (2025)
Ready to unlock more insights? AirROI provides access to advanced metrics and comprehensive Airbnb data for Lembach. Explore detailed analytics beyond this report to refine your investment strategy, optimize pricing, and maximize your vacation rental profits.
Explore Advanced MetricsLembach Short-Term Rental Market Composition (2025): Property & Room Types
Room Type Distribution
Property Type Distribution
Market Composition Insights for Lembach
- The Lembach Airbnb market composition is heavily skewed towards Entire Home/Apt listings, which make up 100% of the 20 active rentals. This indicates strong guest preference for privacy and space.
- Looking at the property type distribution in Lembach, House properties are the most common (65%), reflecting the local real estate landscape.
- Houses represent a significant 65% portion, catering likely to families or larger groups.
Lembach Airbnb Room Capacity Analysis (2025): Bedroom Distribution
Distribution of Listings by Number of Bedrooms
Room Capacity Insights for Lembach
- The dominant room capacity in Lembach is 2 bedrooms listings, making up 45% of the market. This suggests a strong demand for properties suitable for couples or solo travelers.
- Together, 2 bedrooms and 1 bedroom properties represent 65.0% of the active Airbnb listings in Lembach, indicating a high concentration in these sizes.
- A significant 25.0% of listings offer 3+ bedrooms, catering to larger groups and families seeking more space in Lembach.
Lembach Vacation Rental Guest Capacity Trends (2025)
Distribution of Listings by Guest Capacity
Guest Capacity Insights for Lembach
- The most common guest capacity trend in Lembach vacation rentals is listings accommodating 6 guests (35%). This suggests the primary traveler segment is likely larger groups.
- Properties designed for 6 guests and 4 guests dominate the Lembach STR market, accounting for 55.0% of listings.
- 45.0% of properties accommodate 6+ guests, serving the market segment for larger families or group travel in Lembach.
- On average, properties in Lembach are equipped to host 4.7 guests.
Lembach Airbnb Booking Patterns (2025): Available vs. Booked Days
Available Days Distribution
Booked Days Distribution
Booking Pattern Insights for Lembach
- The most common availability pattern in Lembach falls within the 181-270 days range, representing 40% of listings. This suggests many properties have significant open periods on their calendars.
- Approximately 60.0% of listings show high availability (181+ days open annually), indicating potential for increased bookings or specific owner usage patterns.
- For booked days, the 181-270 days range is most frequent in Lembach (40%), reflecting common guest stay durations or potential owner blocking patterns.
- A notable 45.0% of properties secure long booking periods (181+ days booked per year), highlighting successful long-term rental strategies or significant owner usage.
Lembach Airbnb Minimum Stay Requirements Analysis
Distribution of Listings by Minimum Night Requirement
1 Night
2 listings
10.5% of total
2 Nights
11 listings
57.9% of total
3 Nights
3 listings
15.8% of total
4-6 Nights
1 listings
5.3% of total
30+ Nights
2 listings
10.5% of total
Key Insights
- The most prevalent minimum stay requirement in Lembach is 2 Nights, adopted by 57.9% of listings. This highlights the market's preference for shorter, flexible bookings.
- A strong majority (68.4%) of the Lembach Airbnb data shows acceptance of very short stays (1-2 nights), indicating a dynamic, high-turnover market.
- A significant segment (10.5%) caters to monthly stays (30+ nights) in Lembach, pointing to opportunities in the extended-stay market.
Recommendations
- Align with the market by considering a 2 Nights minimum stay, as 57.9% of Lembach hosts use this setting.
- If feasible, allowing 1-night stays, especially midweek or during low season, could capture last-minute bookings, as only 10.5% currently do.
- A 2-night minimum appears standard (57.9%). Consider this for weekends or peak periods.
- Explore offering discounts for stays of 30+ nights to attract the 10.5% of the market seeking extended stays.
- Adjust minimum nights based on seasonality – potentially shorter during low season and longer during peak demand periods in Lembach.
Lembach Airbnb Cancellation Policy Trends Analysis (2025)
Flexible
4 listings
20% of total
Moderate
7 listings
35% of total
Firm
4 listings
20% of total
Strict
5 listings
25% of total
Cancellation Policy Insights for Lembach
- The prevailing Airbnb cancellation policy trend in Lembach is Moderate, used by 35% of listings.
- There's a relatively balanced mix between guest-friendly (55.0%) and stricter (45.0%) policies, offering choices for different guest needs.
Recommendations for Hosts
- Consider adopting a Moderate policy to align with the 35% market standard in Lembach.
- Regularly review your cancellation policy against competitors and market demand shifts in Lembach.
Lembach STR Booking Lead Time Analysis (2025)
Average Booking Lead Time by Month
Booking Lead Time Insights for Lembach
- The overall average booking lead time for vacation rentals in Lembach is 49 days.
- Guests book furthest in advance for stays during July (average 88 days), likely coinciding with peak travel demand or local events.
- The shortest booking windows occur for stays in September (average 25 days), indicating more last-minute travel plans during this time.
- Seasonally, Summer (70 days avg.) sees the longest lead times, while Winter (37 days avg.) has the shortest, reflecting typical travel planning cycles.
Recommendations for Hosts
- Use the overall average lead time (49 days) as a baseline for your pricing and availability strategy in Lembach.
- For July stays, consider implementing length-of-stay discounts or slightly higher rates for bookings made less than 88 days out to capitalize on advance planning.
- Target marketing efforts for the Summer season well in advance (at least 70 days) to capture early planners.
- Monitor your own booking lead times against these Lembach averages to identify opportunities for dynamic pricing adjustments.
Popular & Essential Airbnb Amenities in Lembach (2025)
Amenity Prevalence
Amenity Insights for Lembach
- Essential amenities in Lembach that guests expect include: Dishes and silverware, Kitchen, TV, Refrigerator, Hot water, Heating, Coffee maker, Cooking basics. Lacking these (any) could significantly impact bookings.
- Popular amenities like Wine glasses, Baking sheet are common but not universal. Offering these can provide a competitive edge.
Recommendations for Hosts
- Ensure your listing includes all essential amenities for Lembach: Dishes and silverware, Kitchen, TV, Refrigerator, Hot water, Heating, Coffee maker, Cooking basics.
- Prioritize adding missing essentials: Hot water, Heating, Coffee maker, Cooking basics.
- Consider adding popular differentiators like Wine glasses or Baking sheet to increase appeal.
- Highlight unique or less common amenities you offer (e.g., hot tub, dedicated workspace, EV charger) in your listing description and photos.
- Regularly check competitor amenities in Lembach to stay competitive.
Lembach Airbnb Guest Demographics & Profile Analysis (2025)
Guest Profile Summary for Lembach
- The typical guest profile for Airbnb in Lembach consists of predominantly international visitors (70%), with top international origins including France, typically belonging to the Post-2000s (Gen Z/Alpha) group (50%), primarily speaking English or German.
- Domestic travelers account for 30.1% of guests.
- Key international markets include Germany (47.5%) and France (30.1%).
- Top languages spoken are English (35.7%) followed by German (27.3%).
- A significant demographic segment is the Post-2000s (Gen Z/Alpha) group, representing 50% of guests.
Recommendations for Hosts
- Focus marketing internationally, particularly towards travelers from France.
- Tailor amenities and listing descriptions to appeal to the dominant Post-2000s (Gen Z/Alpha) demographic (e.g., highlight fast WiFi, smart home features, local guides).
- Highlight unique local experiences or amenities relevant to the primary guest profile.
- Consider seasonal promotions aligned with peak travel times for key origin markets.
Nearby Short-Term Rental Market Comparison
How does the Lembach Airbnb market stack up against its neighbors? Compare key performance metrics like average monthly revenue, ADR, and occupancy rates in surrounding areas to understand the broader regional STR landscape.
| Market | Active Properties | Monthly Revenue | Daily Rate | Avg. Occupancy |
|---|---|---|---|---|
| Vitznau | 29 | $4,171 | $333.53 | 51% |
| Lucerne | 371 | $3,870 | $260.48 | 54% |
| Ittenheim | 19 | $3,672 | $228.19 | 45% |
| Furdenheim | 16 | $3,576 | $330.05 | 50% |
| Schwyz | 18 | $3,491 | $251.34 | 51% |
| Weggis | 48 | $3,444 | $251.92 | 49% |
| Meggen | 10 | $3,324 | $212.62 | 58% |
| Osenbach | 23 | $3,150 | $276.55 | 39% |
| Le Valtin | 18 | $3,072 | $289.72 | 38% |
| Griesheim-près-Molsheim | 19 | $3,065 | $263.48 | 41% |