La Chapelle-devant-Bruyères Airbnb Market Analysis 2025: Short Term Rental Data & Vacation Rental Statistics in Grand Est, France
Is Airbnb profitable in La Chapelle-devant-Bruyères in 2025? Explore comprehensive Airbnb analytics for La Chapelle-devant-Bruyères, Grand Est, France to uncover income potential. This 2025 STR market report for La Chapelle-devant-Bruyères, based on AirROI data from April 2024 to March 2025, reveals key trends in the niche market of 20 active listings.
Whether you're considering an Airbnb investment in La Chapelle-devant-Bruyères, optimizing your existing vacation rental, or exploring rental arbitrage opportunities, understanding the La Chapelle-devant-Bruyères Airbnb data is crucial. Understanding the local regulations is key to maximizing your short term rental income potential. Let's dive into the specifics.
Key La Chapelle-devant-Bruyères Airbnb Performance Metrics Overview
Monthly Airbnb Revenue Variations & Income Potential in La Chapelle-devant-Bruyères (2025)
Understanding the monthly revenue variations for Airbnb listings in La Chapelle-devant-Bruyères is key to maximizing your short term rental income potential. Seasonality significantly impacts earnings. Our analysis, based on data from the past 12 months, shows that the peak revenue month for STRs in La Chapelle-devant-Bruyères is typically August, while March often presents the lowest earnings, highlighting opportunities for strategic pricing adjustments during shoulder and low seasons. Explore the typical Airbnb income in La Chapelle-devant-Bruyères across different performance tiers:
- Best-in-class properties (Top 10%) achieve $6,745+ monthly, often utilizing dynamic pricing and superior guest experiences.
- Strong performing properties (Top 25%) earn $2,684 or more, indicating effective management and desirable locations/amenities.
- Typical properties (Median) generate around $1,514 per month, representing the average market performance.
- Entry-level properties (Bottom 25%) see earnings around $928, often with potential for optimization.
Average Monthly Airbnb Earnings Trend in La Chapelle-devant-Bruyères
La Chapelle-devant-Bruyères Airbnb Occupancy Rate Trends (2025)
Maximize your bookings by understanding the La Chapelle-devant-Bruyères STR occupancy trends. Seasonal demand shifts significantly influence how often properties are booked. Typically, Augustsees the highest demand (peak season occupancy), while March experiences the lowest (low season). Effective strategies, like adjusting minimum stays or offering promotions, can boost occupancy during slower periods. Here's how different property tiers perform in La Chapelle-devant-Bruyères:
- Best-in-class properties (Top 10%) achieve 70%+ occupancy, indicating high desirability and potentially optimized availability.
- Strong performing properties (Top 25%) maintain 57% or higher occupancy, suggesting good market fit and guest satisfaction.
- Typical properties (Median) have an occupancy rate around 37%.
- Entry-level properties (Bottom 25%) average 23% occupancy, potentially facing higher vacancy.
Average Monthly Occupancy Rate Trend in La Chapelle-devant-Bruyères
Average Daily Rate (ADR) Airbnb Trends in La Chapelle-devant-Bruyères (2025)
Effective short term rental pricing strategy in La Chapelle-devant-Bruyères involves understanding monthly ADR fluctuations. The Average Daily Rate (ADR) for Airbnb in La Chapelle-devant-Bruyères typically peaks in December and dips lowest during October. Leveraging Airbnb dynamic pricing tools or strategies based on this seasonality can significantly boost revenue. Here's a look at the typical nightly rates achieved:
- Best-in-class properties (Top 10%) command rates of $440+ per night, often due to premium features or locations.
- Strong performing properties (Top 25%) achieve nightly rates of $140 or more.
- Typical properties (Median) charge around $104 per night.
- Entry-level properties (Bottom 25%) earn around $77 per night.
Average Daily Rate (ADR) Trend by Month in La Chapelle-devant-Bruyères
Get Live La Chapelle-devant-Bruyères Market Intelligence 👇

Explore Real-time Analytics
Airbnb Seasonality Analysis & Trends in La Chapelle-devant-Bruyères (2025)
Peak Season (August, July, May)
- Revenue averages $3,968 per month
- Occupancy rates average 56.6%
- Daily rates average $177
Shoulder Season
- Revenue averages $2,740 per month
- Occupancy maintains around 38.3%
- Daily rates hold near $173
Low Season (January, March, November)
- Revenue drops to average $1,859 per month
- Occupancy decreases to average 29.3%
- Daily rates adjust to average $174
Seasonality Insights for La Chapelle-devant-Bruyères
- The Airbnb seasonality in La Chapelle-devant-Bruyères shows highly seasonal trends requiring careful strategy. While the sections above show seasonal averages, it's also insightful to look at the extremes:
- During the high season, the absolute peak month showcases La Chapelle-devant-Bruyères's highest earning potential, with monthly revenues capable of climbing to $4,089, occupancy reaching a high of 70.5%, and ADRs peaking at $181.
- Conversely, the slowest single month of the year, typically falling within the low season, marks the market's lowest point. In this month, revenue might dip to $1,707, occupancy could drop to 23.6%, and ADRs may adjust down to $165.
- Understanding both the seasonal averages and these monthly peaks and troughs in revenue, occupancy, and ADR is crucial for maximizing your Airbnb profit potential in La Chapelle-devant-Bruyères.
Seasonal Strategies for Maximizing Profit
- Peak Season: Maximize revenue through premium pricing and potentially longer minimum stays. Ensure high availability.
- Low Season: Offer competitive pricing, special promotions (e.g., extended stay discounts), and flexible cancellation policies. Target off-season travelers like remote workers or budget-conscious guests.
- Shoulder Seasons: Implement dynamic pricing that balances peak and low rates. Target weekend travelers or specific events. Offer slightly more flexible terms than peak season.
- Regularly analyze your own performance against these La Chapelle-devant-Bruyères seasonality benchmarks and adjust your pricing and availability strategy accordingly.
Best Areas for Airbnb Investment in La Chapelle-devant-Bruyères (2025)
Exploring the top neighborhoods for short-term rentals in La Chapelle-devant-Bruyères? This section highlights key areas, outlining why they are attractive for hosts and guests, along with notable local attractions. Consider these locations based on your target guest profile and investment strategy.
| Neighborhood / Area | Why Host Here? (Target Guests & Appeal) | Key Attractions & Landmarks |
|---|---|---|
| La Chapelle-devant-Bruyères Center | A charming village center with a local market and traditional French cafes. It's an inviting area for visitors seeking an authentic French countryside experience with accessibility to nature and tranquility. | Village Market, Local Cafes, Scenic Walking Trails, Historical Sites |
| Les Vosges Mountains | A stunning natural area popular for hiking, skiing, and outdoor activities. Great for nature enthusiasts and those looking for adventure, appealing to both summer and winter tourists. | Ballon d'Alsace, Lac de Gérardmer, Ski Resorts, Hiking Trails, Nature Parks |
| Saint-Dié-des-Vosges | A larger nearby town with historical significance and several amenities. Offers a variety of cultural and recreational activities, making it attractive for families and history buffs. | Saint-Dié Cathedral, Museums, Parks, Local Festivals |
| Épinal | Known for its cultural heritage and beautiful landscapes along the Moselle River. It's a great spot for visitors interested in arts and history, providing a range of experiences from museums to outdoor activities. | Épinal Castle, Imagerie d'Épinal, Art Galleries, Riverfront Parks |
| Canal de l'Est | A scenic canal route that is popular for cycling and walking. Offers a unique experience for tourists interested in combining nature and leisure activities in one journey. | Cycling Paths, Canal Boat Tours, Picnic Areas |
| Lautenbach-Zinnamt | A picturesque village surrounded by vineyards and rolling hills, making it a perfect getaway for visitors who appreciate wine and scenic views. | Local Vineyards, Wine Tasting Tours, Hiking Trails |
| Colmar | A stunning city known for its well-preserved medieval architecture and picturesque canals. It attracts a lot of tourists year-round thanks to its historical charm and fairy-tale atmosphere. | Little Venice, Colmar Museum, Christmas Markets, Historic Old Town |
| Strasbourg | As a vibrant cultural city and seat of the European Parliament, Strasbourg offers a blend of French and German cultures. It's a major draw for international travelers looking for cultural immersion. | Strasbourg Cathedral, Petite France, European Parliament, Museums and Galleries |
Understanding Airbnb License Requirements & STR Laws in La Chapelle-devant-Bruyères (2025)
With 25% of listings showing registration in 2025, understanding potential Airbnb license requirements is crucial in La Chapelle-devant-Bruyères. Always verify the latest short term rental regulations and Airbnb license requirements directly with local government authorities for La Chapelle-devant-Bruyères to ensure full compliance before hosting.
(Source: AirROI data, 2025, based on 25% licensed listings)
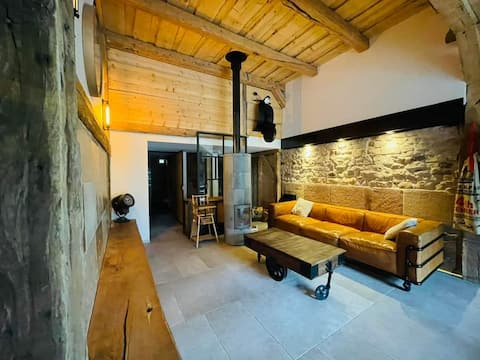
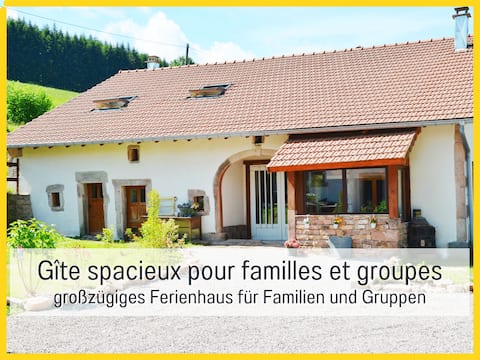
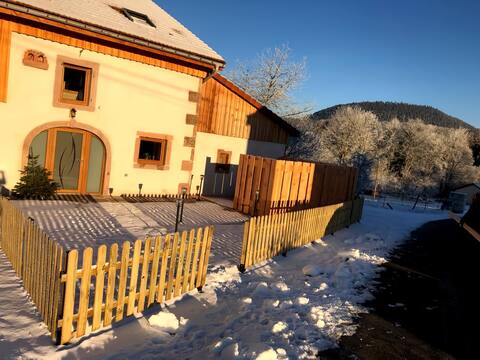
Top Performing Airbnb Properties in La Chapelle-devant-Bruyères (2025)
Benchmark your potential! Explore examples of top-performing Airbnb properties in La Chapelle-devant-Bruyèresbased on Trailing Twelve Month (TTM) revenue. Analyze their characteristics, revenue, occupancy rate, and ADR to understand what drives success in this market.
Nature property, with indoor pool,
Entire Place • 6 bedrooms

The RUIN 4*, with spa and pool .
Entire Place • 5 bedrooms
Chez Louna - Grand Gîte
Entire Place • 6 bedrooms
gîte l'harmonie spa sauna
Entire Place • 3 bedrooms

Amber cottage with private hot tub
Entire Place • 1 bedroom
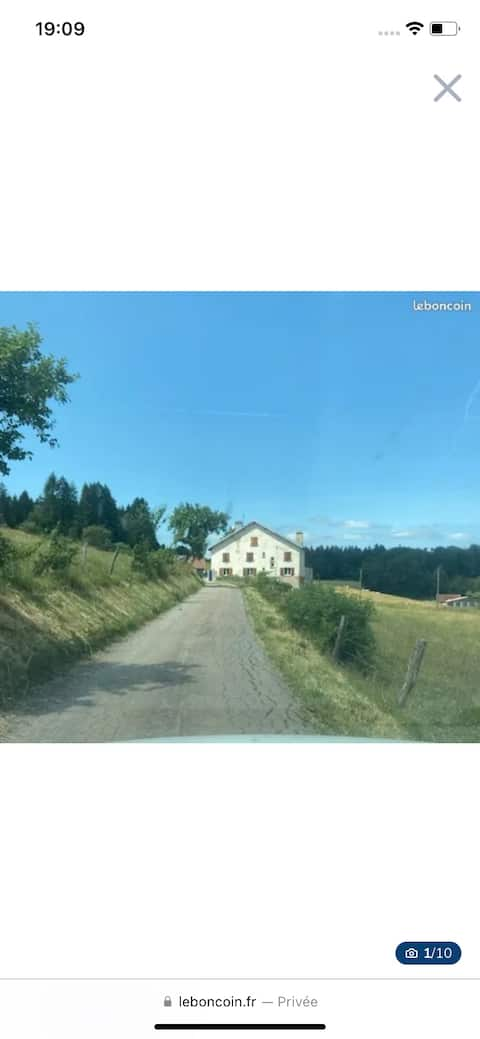
Charming mountain house
Entire Place • 4 bedrooms
Note: Performance varies based on location, size, amenities, seasonality, and management quality. Data reflects the past 12 months.
Top Performing Airbnb Hosts in La Chapelle-devant-Bruyères (2025)
Learn from the best! This table showcases top-performing Airbnb hosts in La Chapelle-devant-Bruyères based on the number of properties managed and estimated total revenue over the past year. Analyze their scale and performance metrics.
| Host Name | Properties | Grossing Revenue | Stay Reviews | Avg Rating |
|---|---|---|---|---|
| Mélanie | 1 | $223,452 | 14 | 5.00/5.0 |
| Audrey | 7 | $94,717 | 238 | 4.66/5.0 |
| AUDREY Et FRED | 1 | $73,698 | 34 | 4.94/5.0 |
| Émilie | 2 | $70,566 | 145 | 4.87/5.0 |
| Dominika | 2 | $62,278 | 87 | 4.91/5.0 |
| Johan | 1 | $24,676 | 10 | 4.90/5.0 |
| Amélie | 1 | $18,842 | 170 | 4.66/5.0 |
| Fanny | 1 | $14,635 | 16 | 4.69/5.0 |
| Annabelle Et Cyrille | 2 | $12,576 | 86 | 4.81/5.0 |
| Andrée | 1 | $10,441 | 15 | 5.00/5.0 |
Analyzing the strategies of top hosts, such as their property selection, pricing, and guest communication, can offer valuable lessons for optimizing your own Airbnb operations in La Chapelle-devant-Bruyères.
Dive Deeper: Advanced La Chapelle-devant-Bruyères STR Market Data (2025)
Ready to unlock more insights? AirROI provides access to advanced metrics and comprehensive Airbnb data for La Chapelle-devant-Bruyères. Explore detailed analytics beyond this report to refine your investment strategy, optimize pricing, and maximize your vacation rental profits.
Explore Advanced MetricsLa Chapelle-devant-Bruyères Short-Term Rental Market Composition (2025): Property & Room Types
Room Type Distribution
Property Type Distribution
Market Composition Insights for La Chapelle-devant-Bruyères
- The La Chapelle-devant-Bruyères Airbnb market composition is heavily skewed towards Entire Home/Apt listings, which make up 100% of the 20 active rentals. This indicates strong guest preference for privacy and space.
- Looking at the property type distribution in La Chapelle-devant-Bruyères, House properties are the most common (35%), reflecting the local real estate landscape.
- Houses represent a significant 35% portion, catering likely to families or larger groups.
La Chapelle-devant-Bruyères Airbnb Room Capacity Analysis (2025): Bedroom Distribution
Distribution of Listings by Number of Bedrooms
Room Capacity Insights for La Chapelle-devant-Bruyères
- The dominant room capacity in La Chapelle-devant-Bruyères is 1 bedroom listings, making up 25% of the market. This suggests a strong demand for properties suitable for couples or solo travelers.
- Together, 1 bedroom and 2 bedrooms properties represent 45.0% of the active Airbnb listings in La Chapelle-devant-Bruyères, indicating a high concentration in these sizes.
- A significant 45.0% of listings offer 3+ bedrooms, catering to larger groups and families seeking more space in La Chapelle-devant-Bruyères.
La Chapelle-devant-Bruyères Vacation Rental Guest Capacity Trends (2025)
Distribution of Listings by Guest Capacity
Guest Capacity Insights for La Chapelle-devant-Bruyères
- The most common guest capacity trend in La Chapelle-devant-Bruyères vacation rentals is listings accommodating 8+ guests (30%). This suggests the primary traveler segment is likely larger groups.
- Properties designed for 8+ guests and 4 guests dominate the La Chapelle-devant-Bruyères STR market, accounting for 50.0% of listings.
- 55.0% of properties accommodate 6+ guests, serving the market segment for larger families or group travel in La Chapelle-devant-Bruyères.
- On average, properties in La Chapelle-devant-Bruyères are equipped to host 5.4 guests.
La Chapelle-devant-Bruyères Airbnb Booking Patterns (2025): Available vs. Booked Days
Available Days Distribution
Booked Days Distribution
Booking Pattern Insights for La Chapelle-devant-Bruyères
- The most common availability pattern in La Chapelle-devant-Bruyères falls within the 181-270 days range, representing 50% of listings. This suggests many properties have significant open periods on their calendars.
- Approximately 65.0% of listings show high availability (181+ days open annually), indicating potential for increased bookings or specific owner usage patterns.
- For booked days, the 91-180 days range is most frequent in La Chapelle-devant-Bruyères (50%), reflecting common guest stay durations or potential owner blocking patterns.
- A notable 35.0% of properties secure long booking periods (181+ days booked per year), highlighting successful long-term rental strategies or significant owner usage.
La Chapelle-devant-Bruyères Airbnb Minimum Stay Requirements Analysis
Distribution of Listings by Minimum Night Requirement
1 Night
5 listings
25% of total
2 Nights
7 listings
35% of total
4-6 Nights
2 listings
10% of total
30+ Nights
6 listings
30% of total
Key Insights
- The most prevalent minimum stay requirement in La Chapelle-devant-Bruyères is 2 Nights, adopted by 35% of listings. This highlights the market's preference for shorter, flexible bookings.
- A significant segment (30%) caters to monthly stays (30+ nights) in La Chapelle-devant-Bruyères, pointing to opportunities in the extended-stay market.
Recommendations
- Align with the market by considering a 2 Nights minimum stay, as 35% of La Chapelle-devant-Bruyères hosts use this setting.
- If feasible, allowing 1-night stays, especially midweek or during low season, could capture last-minute bookings, as only 25% currently do.
- Explore offering discounts for stays of 30+ nights to attract the 30% of the market seeking extended stays.
- Adjust minimum nights based on seasonality – potentially shorter during low season and longer during peak demand periods in La Chapelle-devant-Bruyères.
La Chapelle-devant-Bruyères Airbnb Cancellation Policy Trends Analysis (2025)
Flexible
6 listings
30% of total
Moderate
2 listings
10% of total
Firm
2 listings
10% of total
Strict
10 listings
50% of total
Cancellation Policy Insights for La Chapelle-devant-Bruyères
- The prevailing Airbnb cancellation policy trend in La Chapelle-devant-Bruyères is Strict, used by 50% of listings.
- A majority (60.0%) of hosts in La Chapelle-devant-Bruyères utilize Firm or Strict policies, indicating a market where hosts prioritize booking security.
Recommendations for Hosts
- Consider adopting a Strict policy to align with the 50% market standard in La Chapelle-devant-Bruyères.
- With 50% using Strict terms, this is a viable option in La Chapelle-devant-Bruyères, particularly for high-value properties or during peak demand periods.
- Regularly review your cancellation policy against competitors and market demand shifts in La Chapelle-devant-Bruyères.
La Chapelle-devant-Bruyères STR Booking Lead Time Analysis (2025)
Average Booking Lead Time by Month
Booking Lead Time Insights for La Chapelle-devant-Bruyères
- The overall average booking lead time for vacation rentals in La Chapelle-devant-Bruyères is 67 days.
- Guests book furthest in advance for stays during June (average 162 days), likely coinciding with peak travel demand or local events.
- The shortest booking windows occur for stays in February (average 34 days), indicating more last-minute travel plans during this time.
- Seasonally, Summer (120 days avg.) sees the longest lead times, while Winter (52 days avg.) has the shortest, reflecting typical travel planning cycles.
Recommendations for Hosts
- Use the overall average lead time (67 days) as a baseline for your pricing and availability strategy in La Chapelle-devant-Bruyères.
- For June stays, consider implementing length-of-stay discounts or slightly higher rates for bookings made less than 162 days out to capitalize on advance planning.
- Target marketing efforts for the Summer season well in advance (at least 120 days) to capture early planners.
- Monitor your own booking lead times against these La Chapelle-devant-Bruyères averages to identify opportunities for dynamic pricing adjustments.
Popular & Essential Airbnb Amenities in La Chapelle-devant-Bruyères (2025)
Amenity Prevalence
Amenity Insights for La Chapelle-devant-Bruyères
- Essential amenities in La Chapelle-devant-Bruyères that guests expect include: Coffee maker, Hot water, Kitchen, Outdoor dining area, Heating, Refrigerator, Dishes and silverware, Free parking on premises, Pack ’n play/Travel crib, Dining table. Lacking these (any) could significantly impact bookings.
Recommendations for Hosts
- Ensure your listing includes all essential amenities for La Chapelle-devant-Bruyères: Coffee maker, Hot water, Kitchen, Outdoor dining area, Heating, Refrigerator, Dishes and silverware, Free parking on premises, Pack ’n play/Travel crib, Dining table.
- Prioritize adding missing essentials: Pack ’n play/Travel crib, Dining table.
- Highlight unique or less common amenities you offer (e.g., hot tub, dedicated workspace, EV charger) in your listing description and photos.
- Regularly check competitor amenities in La Chapelle-devant-Bruyères to stay competitive.
La Chapelle-devant-Bruyères Airbnb Guest Demographics & Profile Analysis (2025)
Guest Profile Summary for La Chapelle-devant-Bruyères
- The typical guest profile for Airbnb in La Chapelle-devant-Bruyères consists of primarily domestic travelers (74%), often arriving from nearby Strasbourg, typically belonging to the Post-2000s (Gen Z/Alpha) group (50%), primarily speaking French or English.
- Domestic travelers account for 73.7% of guests.
- Key international markets include France (73.7%) and Germany (11.3%).
- Top languages spoken are French (45.5%) followed by English (33.2%).
- A significant demographic segment is the Post-2000s (Gen Z/Alpha) group, representing 50% of guests.
Recommendations for Hosts
- Target domestic marketing efforts towards travelers from Strasbourg and Metz.
- Tailor amenities and listing descriptions to appeal to the dominant Post-2000s (Gen Z/Alpha) demographic (e.g., highlight fast WiFi, smart home features, local guides).
- Highlight unique local experiences or amenities relevant to the primary guest profile.
- Consider seasonal promotions aligned with peak travel times for key origin markets.
Nearby Short-Term Rental Market Comparison
How does the La Chapelle-devant-Bruyères Airbnb market stack up against its neighbors? Compare key performance metrics like average monthly revenue, ADR, and occupancy rates in surrounding areas to understand the broader regional STR landscape.
| Market | Active Properties | Monthly Revenue | Daily Rate | Avg. Occupancy |
|---|---|---|---|---|
| Ittenheim | 19 | $3,672 | $228.19 | 45% |
| Furdenheim | 16 | $3,576 | $330.05 | 50% |
| Osenbach | 23 | $3,150 | $276.55 | 39% |
| Le Valtin | 18 | $3,072 | $289.72 | 38% |
| Griesheim-près-Molsheim | 19 | $3,065 | $263.48 | 41% |
| Belmont | 13 | $2,931 | $260.89 | 36% |
| Ventron | 82 | $2,809 | $278.41 | 36% |
| Léglise | 21 | $2,804 | $259.32 | 38% |
| Rust | 160 | $2,750 | $187.61 | 52% |
| Libin | 46 | $2,632 | $218.34 | 42% |