Fraize Airbnb Market Analysis 2025: Short Term Rental Data & Vacation Rental Statistics in Grand Est, France
Is Airbnb profitable in Fraize in 2025? Explore comprehensive Airbnb analytics for Fraize, Grand Est, France to uncover income potential. This 2025 STR market report for Fraize, based on AirROI data from April 2024 to March 2025, reveals key trends in the niche market of 31 active listings.
Whether you're considering an Airbnb investment in Fraize, optimizing your existing vacation rental, or exploring rental arbitrage opportunities, understanding the Fraize Airbnb data is crucial. Leveraging the low regulation environment is key to maximizing your short term rental income potential. Let's dive into the specifics.
Key Fraize Airbnb Performance Metrics Overview
Monthly Airbnb Revenue Variations & Income Potential in Fraize (2025)
Understanding the monthly revenue variations for Airbnb listings in Fraize is key to maximizing your short term rental income potential. Seasonality significantly impacts earnings. Our analysis, based on data from the past 12 months, shows that the peak revenue month for STRs in Fraize is typically August, while March often presents the lowest earnings, highlighting opportunities for strategic pricing adjustments during shoulder and low seasons. Explore the typical Airbnb income in Fraize across different performance tiers:
- Best-in-class properties (Top 10%) achieve $2,928+ monthly, often utilizing dynamic pricing and superior guest experiences.
- Strong performing properties (Top 25%) earn $1,862 or more, indicating effective management and desirable locations/amenities.
- Typical properties (Median) generate around $1,114 per month, representing the average market performance.
- Entry-level properties (Bottom 25%) see earnings around $588, often with potential for optimization.
Average Monthly Airbnb Earnings Trend in Fraize
Fraize Airbnb Occupancy Rate Trends (2025)
Maximize your bookings by understanding the Fraize STR occupancy trends. Seasonal demand shifts significantly influence how often properties are booked. Typically, Augustsees the highest demand (peak season occupancy), while January experiences the lowest (low season). Effective strategies, like adjusting minimum stays or offering promotions, can boost occupancy during slower periods. Here's how different property tiers perform in Fraize:
- Best-in-class properties (Top 10%) achieve 68%+ occupancy, indicating high desirability and potentially optimized availability.
- Strong performing properties (Top 25%) maintain 55% or higher occupancy, suggesting good market fit and guest satisfaction.
- Typical properties (Median) have an occupancy rate around 37%.
- Entry-level properties (Bottom 25%) average 22% occupancy, potentially facing higher vacancy.
Average Monthly Occupancy Rate Trend in Fraize
Average Daily Rate (ADR) Airbnb Trends in Fraize (2025)
Effective short term rental pricing strategy in Fraize involves understanding monthly ADR fluctuations. The Average Daily Rate (ADR) for Airbnb in Fraize typically peaks in November and dips lowest during March. Leveraging Airbnb dynamic pricing tools or strategies based on this seasonality can significantly boost revenue. Here's a look at the typical nightly rates achieved:
- Best-in-class properties (Top 10%) command rates of $287+ per night, often due to premium features or locations.
- Strong performing properties (Top 25%) achieve nightly rates of $111 or more.
- Typical properties (Median) charge around $94 per night.
- Entry-level properties (Bottom 25%) earn around $67 per night.
Average Daily Rate (ADR) Trend by Month in Fraize
Get Live Fraize Market Intelligence 👇

Explore Real-time Analytics
Airbnb Seasonality Analysis & Trends in Fraize (2025)
Peak Season (August, July, December)
- Revenue averages $2,055 per month
- Occupancy rates average 58.0%
- Daily rates average $144
Shoulder Season
- Revenue averages $1,493 per month
- Occupancy maintains around 37.5%
- Daily rates hold near $141
Low Season (January, March, November)
- Revenue drops to average $790 per month
- Occupancy decreases to average 23.1%
- Daily rates adjust to average $141
Seasonality Insights for Fraize
- The Airbnb seasonality in Fraize shows highly seasonal trends requiring careful strategy. While the sections above show seasonal averages, it's also insightful to look at the extremes:
- During the high season, the absolute peak month showcases Fraize's highest earning potential, with monthly revenues capable of climbing to $2,252, occupancy reaching a high of 65.5%, and ADRs peaking at $151.
- Conversely, the slowest single month of the year, typically falling within the low season, marks the market's lowest point. In this month, revenue might dip to $573, occupancy could drop to 21.3%, and ADRs may adjust down to $135.
- Understanding both the seasonal averages and these monthly peaks and troughs in revenue, occupancy, and ADR is crucial for maximizing your Airbnb profit potential in Fraize.
Seasonal Strategies for Maximizing Profit
- Peak Season: Maximize revenue through premium pricing and potentially longer minimum stays. Ensure high availability.
- Low Season: Offer competitive pricing, special promotions (e.g., extended stay discounts), and flexible cancellation policies. Target off-season travelers like remote workers or budget-conscious guests.
- Shoulder Seasons: Implement dynamic pricing that balances peak and low rates. Target weekend travelers or specific events. Offer slightly more flexible terms than peak season.
- Regularly analyze your own performance against these Fraize seasonality benchmarks and adjust your pricing and availability strategy accordingly.
Best Areas for Airbnb Investment in Fraize (2025)
Exploring the top neighborhoods for short-term rentals in Fraize? This section highlights key areas, outlining why they are attractive for hosts and guests, along with notable local attractions. Consider these locations based on your target guest profile and investment strategy.
| Neighborhood / Area | Why Host Here? (Target Guests & Appeal) | Key Attractions & Landmarks |
|---|---|---|
| Fraize Village | Charming village in the Vosges mountains, ideal for visitors looking for nature, hiking, and outdoor activities. Great for families and couples seeking a tranquil getaway. | La Route des Crêtes, Parc Naturel Régional des Ballons des Vosges, Chalet de Fraize, Les Champignons du Cyclop, Cascades de Tendon |
| Plombières-les-Bains | Known for its thermal spa and wellness offerings, this location attracts visitors looking for relaxation and health retreats throughout the year. | Thermes de Plombières, Casino de Plombières, Parc Thermal, Tour de l'Horloge, Chapelle de la Vierge |
| Gerardmer | A popular alpine town known for its stunning lake and ski resorts, attracting both summer and winter tourists, especially outdoor enthusiasts. | Lac de Gérardmer, Station de Ski de Gérardmer, Trail des Cascades, Les Jardins de Berchigranges, La Mausolée |
| Saint-Dié-des-Vosges | A vibrant town with significant cultural heritage and history, perfect for tourists interested in local art, architecture, and history. | Musée Pierre-Noël, Cathedral of Saint-Dié, Parc de l'Etang, La Petite France, Les Vosges |
| Rupt-sur-Moselle | A picturesque village nestled in the mountains, ideal for nature lovers and those interested in hiking, fishing, and skiing in the winter. | Cascades de la Pissoire, Gorges de la Moselle, Ski Resort of La Bresse, Lac de L'Esch, Les Venansault |
| Le Thillot | Known for its beautiful landscapes and outdoor activities, this area brings tourists for hiking, cycling, and enjoying natural beauty. | La Petite Gelmer, Parc d'Aventure, Musée de la Montagne, Eglise Saint-Étienne, Station de Ski de Le Thillot |
| La Bresse | A prime ski destination in the Vosges, popular in winter, but also attracts summer visitors for biking and hiking, making it a versatile investment. | La Bresse-Hohneck, Lac de La Bresse, Sentiers de Randonnée, Parc de La Bresse, Cascades du Hohneck |
| Bourg-d'Oisans | Gateway to the Alpes, this area attracts tourists looking to explore the mountains, perfect for both summer climbing and winter sports. | Alpe d'Huez, Barrage du Verney, Massif de l'Oisans, VTT descente de Bourg d'Oisans, La Station de ski |
Understanding Airbnb License Requirements & STR Laws in Fraize (2025)
While Fraize, Grand Est, France currently shows low STR regulations, specific Airbnb license requirements might still exist or change. Always verify the latest short term rental regulations and Airbnb license requirements directly with local government authorities for Fraize to ensure full compliance before hosting.
(Source: AirROI data, 2025, based on 6% licensed listings)
Top Performing Airbnb Properties in Fraize (2025)
Benchmark your potential! Explore examples of top-performing Airbnb properties in Fraizebased on Trailing Twelve Month (TTM) revenue. Analyze their characteristics, revenue, occupancy rate, and ADR to understand what drives success in this market.
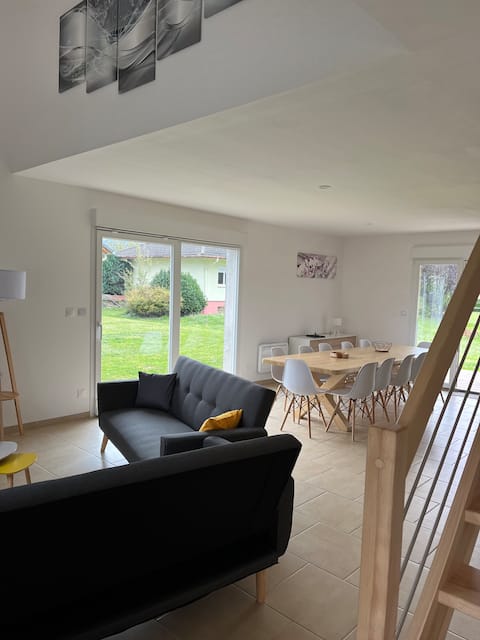
Le gîte des Vosges II
Entire Place • 4 bedrooms
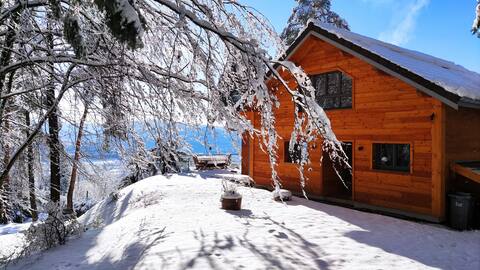
Large cottage with terrace 60 sqm , stunning views
Entire Place • 3 bedrooms
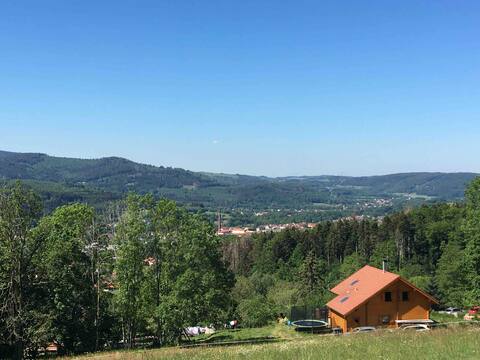
Le chalet de Mimosa
Entire Place • 3 bedrooms
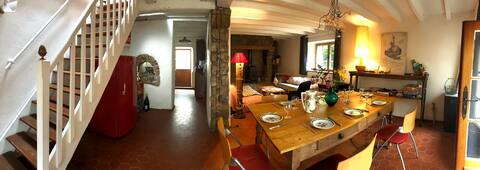
The farmhouse in the heart of the Vosges forest
Entire Place • 3 bedrooms
Chalet Les Boudières near Gérardmer Cosy Billard
Entire Place • 3 bedrooms
Les Ebeteux/Hautes-Vosges cottage
Entire Place • 2 bedrooms
Note: Performance varies based on location, size, amenities, seasonality, and management quality. Data reflects the past 12 months.
Top Performing Airbnb Hosts in Fraize (2025)
Learn from the best! This table showcases top-performing Airbnb hosts in Fraize based on the number of properties managed and estimated total revenue over the past year. Analyze their scale and performance metrics.
| Host Name | Properties | Grossing Revenue | Stay Reviews | Avg Rating |
|---|---|---|---|---|
| Sandy | 3 | $66,786 | 34 | 4.73/5.0 |
| Jean | 1 | $45,947 | 42 | 4.90/5.0 |
| Sonia | 1 | $35,868 | 125 | 4.92/5.0 |
| Lionel | 2 | $34,090 | 207 | 4.92/5.0 |
| Nathalie | 1 | $32,837 | 82 | 4.90/5.0 |
| Aurélie | 1 | $27,385 | 37 | 4.86/5.0 |
| Estelle | 1 | $26,419 | 70 | 4.97/5.0 |
| Camille | 1 | $20,254 | 4 | 5.00/5.0 |
| Corentin | 1 | $14,402 | 33 | 4.94/5.0 |
| Anne | 1 | $12,128 | 19 | 4.89/5.0 |
Analyzing the strategies of top hosts, such as their property selection, pricing, and guest communication, can offer valuable lessons for optimizing your own Airbnb operations in Fraize.
Dive Deeper: Advanced Fraize STR Market Data (2025)
Ready to unlock more insights? AirROI provides access to advanced metrics and comprehensive Airbnb data for Fraize. Explore detailed analytics beyond this report to refine your investment strategy, optimize pricing, and maximize your vacation rental profits.
Explore Advanced MetricsFraize Short-Term Rental Market Composition (2025): Property & Room Types
Room Type Distribution
Property Type Distribution
Market Composition Insights for Fraize
- The Fraize Airbnb market composition is heavily skewed towards Entire Home/Apt listings, which make up 93.5% of the 31 active rentals. This indicates strong guest preference for privacy and space.
- Looking at the property type distribution in Fraize, House properties are the most common (58.1%), reflecting the local real estate landscape.
- Houses represent a significant 58.1% portion, catering likely to families or larger groups.
- The presence of 6.5% Hotel/Boutique listings indicates integration with traditional hospitality.
- Smaller segments like outdoor/unique (combined 3.2%) offer potential for unique stay experiences.
Fraize Airbnb Room Capacity Analysis (2025): Bedroom Distribution
Distribution of Listings by Number of Bedrooms
Room Capacity Insights for Fraize
- The dominant room capacity in Fraize is 3 bedrooms listings, making up 35.5% of the market. This suggests a strong demand for properties suitable for families or small groups.
- Together, 3 bedrooms and 2 bedrooms properties represent 61.3% of the active Airbnb listings in Fraize, indicating a high concentration in these sizes.
- A significant 51.6% of listings offer 3+ bedrooms, catering to larger groups and families seeking more space in Fraize.
Fraize Vacation Rental Guest Capacity Trends (2025)
Distribution of Listings by Guest Capacity
Guest Capacity Insights for Fraize
- The most common guest capacity trend in Fraize vacation rentals is listings accommodating 8+ guests (29%). This suggests the primary traveler segment is likely larger groups.
- Properties designed for 8+ guests and 6 guests dominate the Fraize STR market, accounting for 58.0% of listings.
- 58.0% of properties accommodate 6+ guests, serving the market segment for larger families or group travel in Fraize.
- On average, properties in Fraize are equipped to host 5.5 guests.
Fraize Airbnb Booking Patterns (2025): Available vs. Booked Days
Available Days Distribution
Booked Days Distribution
Booking Pattern Insights for Fraize
- The most common availability pattern in Fraize falls within the 181-270 days range, representing 41.9% of listings. This suggests many properties have significant open periods on their calendars.
- Approximately 77.4% of listings show high availability (181+ days open annually), indicating potential for increased bookings or specific owner usage patterns.
- For booked days, the 91-180 days range is most frequent in Fraize (45.2%), reflecting common guest stay durations or potential owner blocking patterns.
- A notable 25.9% of properties secure long booking periods (181+ days booked per year), highlighting successful long-term rental strategies or significant owner usage.
Fraize Airbnb Minimum Stay Requirements Analysis
Distribution of Listings by Minimum Night Requirement
1 Night
4 listings
12.9% of total
2 Nights
18 listings
58.1% of total
3 Nights
1 listings
3.2% of total
4-6 Nights
2 listings
6.5% of total
7-29 Nights
2 listings
6.5% of total
30+ Nights
4 listings
12.9% of total
Key Insights
- The most prevalent minimum stay requirement in Fraize is 2 Nights, adopted by 58.1% of listings. This highlights the market's preference for shorter, flexible bookings.
- A strong majority (71.0%) of the Fraize Airbnb data shows acceptance of very short stays (1-2 nights), indicating a dynamic, high-turnover market.
- A significant segment (12.9%) caters to monthly stays (30+ nights) in Fraize, pointing to opportunities in the extended-stay market.
Recommendations
- Align with the market by considering a 2 Nights minimum stay, as 58.1% of Fraize hosts use this setting.
- If feasible, allowing 1-night stays, especially midweek or during low season, could capture last-minute bookings, as only 12.9% currently do.
- A 2-night minimum appears standard (58.1%). Consider this for weekends or peak periods.
- Explore offering discounts for stays of 30+ nights to attract the 12.9% of the market seeking extended stays.
- Adjust minimum nights based on seasonality – potentially shorter during low season and longer during peak demand periods in Fraize.
Fraize Airbnb Cancellation Policy Trends Analysis (2025)
Flexible
10 listings
32.3% of total
Moderate
7 listings
22.6% of total
Firm
7 listings
22.6% of total
Strict
7 listings
22.6% of total
Cancellation Policy Insights for Fraize
- The prevailing Airbnb cancellation policy trend in Fraize is Flexible, used by 32.3% of listings.
- There's a relatively balanced mix between guest-friendly (54.9%) and stricter (45.2%) policies, offering choices for different guest needs.
Recommendations for Hosts
- Consider adopting a Flexible policy to align with the 32.3% market standard in Fraize.
- Regularly review your cancellation policy against competitors and market demand shifts in Fraize.
Fraize STR Booking Lead Time Analysis (2025)
Average Booking Lead Time by Month
Booking Lead Time Insights for Fraize
- The overall average booking lead time for vacation rentals in Fraize is 47 days.
- Guests book furthest in advance for stays during July (average 76 days), likely coinciding with peak travel demand or local events.
- The shortest booking windows occur for stays in November (average 31 days), indicating more last-minute travel plans during this time.
- Seasonally, Summer (75 days avg.) sees the longest lead times, while Winter (49 days avg.) has the shortest, reflecting typical travel planning cycles.
Recommendations for Hosts
- Use the overall average lead time (47 days) as a baseline for your pricing and availability strategy in Fraize.
- For July stays, consider implementing length-of-stay discounts or slightly higher rates for bookings made less than 76 days out to capitalize on advance planning.
- Target marketing efforts for the Summer season well in advance (at least 75 days) to capture early planners.
- Monitor your own booking lead times against these Fraize averages to identify opportunities for dynamic pricing adjustments.
Popular & Essential Airbnb Amenities in Fraize (2025)
Amenity Prevalence
Amenity Insights for Fraize
- Essential amenities in Fraize that guests expect include: Kitchen. Lacking these (this) could significantly impact bookings.
- Popular amenities like Free parking on premises, TV, Smoke alarm are common but not universal. Offering these can provide a competitive edge.
Recommendations for Hosts
- Ensure your listing includes all essential amenities for Fraize: Kitchen.
- Prioritize adding missing essentials: Kitchen.
- Consider adding popular differentiators like Free parking on premises or TV to increase appeal.
- Highlight unique or less common amenities you offer (e.g., hot tub, dedicated workspace, EV charger) in your listing description and photos.
- Regularly check competitor amenities in Fraize to stay competitive.
Fraize Airbnb Guest Demographics & Profile Analysis (2025)
Guest Profile Summary for Fraize
- The typical guest profile for Airbnb in Fraize consists of a mix of domestic (60%) and international guests, often arriving from nearby Strasbourg, typically belonging to the Post-2000s (Gen Z/Alpha) group (50%), primarily speaking English or French.
- Domestic travelers account for 59.9% of guests.
- Key international markets include France (59.9%) and Germany (16%).
- Top languages spoken are English (33.5%) followed by French (32.1%).
- A significant demographic segment is the Post-2000s (Gen Z/Alpha) group, representing 50% of guests.
Recommendations for Hosts
- Balance marketing efforts between domestic and international channels based on the guest mix.
- Tailor amenities and listing descriptions to appeal to the dominant Post-2000s (Gen Z/Alpha) demographic (e.g., highlight fast WiFi, smart home features, local guides).
- Highlight unique local experiences or amenities relevant to the primary guest profile.
- Consider seasonal promotions aligned with peak travel times for key origin markets.
Nearby Short-Term Rental Market Comparison
How does the Fraize Airbnb market stack up against its neighbors? Compare key performance metrics like average monthly revenue, ADR, and occupancy rates in surrounding areas to understand the broader regional STR landscape.
| Market | Active Properties | Monthly Revenue | Daily Rate | Avg. Occupancy |
|---|---|---|---|---|
| Ittenheim | 19 | $3,672 | $228.19 | 45% |
| Furdenheim | 16 | $3,576 | $330.05 | 50% |
| Osenbach | 23 | $3,150 | $276.55 | 39% |
| Le Valtin | 18 | $3,072 | $289.72 | 38% |
| Griesheim-près-Molsheim | 19 | $3,065 | $263.48 | 41% |
| Belmont | 13 | $2,931 | $260.89 | 36% |
| Ventron | 82 | $2,809 | $278.41 | 36% |
| Léglise | 21 | $2,804 | $259.32 | 38% |
| Rust | 160 | $2,750 | $187.61 | 52% |
| Libin | 46 | $2,632 | $218.34 | 42% |