Colmar Airbnb Market Analysis 2025: Short Term Rental Data & Vacation Rental Statistics in Grand Est, France
Is Airbnb profitable in Colmar in 2025? Explore comprehensive Airbnb analytics for Colmar, Grand Est, France to uncover income potential. This 2025 STR market report for Colmar, based on AirROI data from April 2024 to March 2025, reveals key trends in the bustling market of 1,079 active listings.
Whether you're considering an Airbnb investment in Colmar, optimizing your existing vacation rental, or exploring rental arbitrage opportunities, understanding the Colmar Airbnb data is crucial. Navigating the high regulation landscape is key to maximizing your short term rental income potential. Let's dive into the specifics.
Key Colmar Airbnb Performance Metrics Overview
Monthly Airbnb Revenue Variations & Income Potential in Colmar (2025)
Understanding the monthly revenue variations for Airbnb listings in Colmar is key to maximizing your short term rental income potential. Seasonality significantly impacts earnings. Our analysis, based on data from the past 12 months, shows that the peak revenue month for STRs in Colmar is typically December, while February often presents the lowest earnings, highlighting opportunities for strategic pricing adjustments during shoulder and low seasons. Explore the typical Airbnb income in Colmar across different performance tiers:
- Best-in-class properties (Top 10%) achieve $4,132+ monthly, often utilizing dynamic pricing and superior guest experiences.
- Strong performing properties (Top 25%) earn $2,774 or more, indicating effective management and desirable locations/amenities.
- Typical properties (Median) generate around $1,792 per month, representing the average market performance.
- Entry-level properties (Bottom 25%) see earnings around $1,024, often with potential for optimization.
Average Monthly Airbnb Earnings Trend in Colmar
Colmar Airbnb Occupancy Rate Trends (2025)
Maximize your bookings by understanding the Colmar STR occupancy trends. Seasonal demand shifts significantly influence how often properties are booked. Typically, Decembersees the highest demand (peak season occupancy), while March experiences the lowest (low season). Effective strategies, like adjusting minimum stays or offering promotions, can boost occupancy during slower periods. Here's how different property tiers perform in Colmar:
- Best-in-class properties (Top 10%) achieve 83%+ occupancy, indicating high desirability and potentially optimized availability.
- Strong performing properties (Top 25%) maintain 68% or higher occupancy, suggesting good market fit and guest satisfaction.
- Typical properties (Median) have an occupancy rate around 48%.
- Entry-level properties (Bottom 25%) average 26% occupancy, potentially facing higher vacancy.
Average Monthly Occupancy Rate Trend in Colmar
Average Daily Rate (ADR) Airbnb Trends in Colmar (2025)
Effective short term rental pricing strategy in Colmar involves understanding monthly ADR fluctuations. The Average Daily Rate (ADR) for Airbnb in Colmar typically peaks in December and dips lowest during March. Leveraging Airbnb dynamic pricing tools or strategies based on this seasonality can significantly boost revenue. Here's a look at the typical nightly rates achieved:
- Best-in-class properties (Top 10%) command rates of $247+ per night, often due to premium features or locations.
- Strong performing properties (Top 25%) achieve nightly rates of $164 or more.
- Typical properties (Median) charge around $114 per night.
- Entry-level properties (Bottom 25%) earn around $81 per night.
Average Daily Rate (ADR) Trend by Month in Colmar
Get Live Colmar Market Intelligence 👇

Explore Real-time Analytics
Airbnb Seasonality Analysis & Trends in Colmar (2025)
Peak Season (December, May, August)
- Revenue averages $3,385 per month
- Occupancy rates average 61.2%
- Daily rates average $168
Shoulder Season
- Revenue averages $2,082 per month
- Occupancy maintains around 48.7%
- Daily rates hold near $139
Low Season (January, February, March)
- Revenue drops to average $1,044 per month
- Occupancy decreases to average 30.9%
- Daily rates adjust to average $126
Seasonality Insights for Colmar
- The Airbnb seasonality in Colmar shows highly seasonal trends requiring careful strategy. While the sections above show seasonal averages, it's also insightful to look at the extremes:
- During the high season, the absolute peak month showcases Colmar's highest earning potential, with monthly revenues capable of climbing to $5,233, occupancy reaching a high of 71.1%, and ADRs peaking at $228.
- Conversely, the slowest single month of the year, typically falling within the low season, marks the market's lowest point. In this month, revenue might dip to $884, occupancy could drop to 30.8%, and ADRs may adjust down to $122.
- Understanding both the seasonal averages and these monthly peaks and troughs in revenue, occupancy, and ADR is crucial for maximizing your Airbnb profit potential in Colmar.
Seasonal Strategies for Maximizing Profit
- Peak Season: Maximize revenue through premium pricing and potentially longer minimum stays. Ensure high availability.
- Low Season: Offer competitive pricing, special promotions (e.g., extended stay discounts), and flexible cancellation policies. Target off-season travelers like remote workers or budget-conscious guests.
- Shoulder Seasons: Implement dynamic pricing that balances peak and low rates. Target weekend travelers or specific events. Offer slightly more flexible terms than peak season.
- Regularly analyze your own performance against these Colmar seasonality benchmarks and adjust your pricing and availability strategy accordingly.
Best Areas for Airbnb Investment in Colmar (2025)
Exploring the top neighborhoods for short-term rentals in Colmar? This section highlights key areas, outlining why they are attractive for hosts and guests, along with notable local attractions. Consider these locations based on your target guest profile and investment strategy.
| Neighborhood / Area | Why Host Here? (Target Guests & Appeal) | Key Attractions & Landmarks |
|---|---|---|
| Old Town | Charming historic area with beautiful Alsatian architecture and picturesque streets. It's a popular spot for tourists who want to explore the rich history and culture of Colmar. | Little Venice, Saint-Martin Collegiate Church, Unterlinden Museum, Koïfhus, Tanneurs Street |
| Little Venice | A picturesque neighborhood known for its canals and colorful houses. It offers a romantic atmosphere and is great for scenic walks and boat rides, attracting couples and families. | Canal tours, Covered Market, Ethnographic Museum, Street food stalls |
| Museum District | Home to several renowned museums and galleries, this area attracts art lovers and those interested in history, making it ideal for cultural tourism. | Unterlinden Museum, Bartholdi Museum, Museum of Toys and Little Trains, Natural History Museum |
| Tanneurs Street | This vibrant street features shops, cafes, and local artisans, making it a perfect spot for visitors wanting to experience local culture and cuisine. | Local boutiques, Cafés, Street art sites, Event venues |
| Colmar Independence | A residential area that offers a more local experience, with access to parks and local amenities, appealing to families and longer-term visitors. | Local parks, Shopping areas, Family-friendly restaurants |
| Colmar Train Station Area | Convenient for travelers arriving by train, this area has easy access to transportation and is often budget-friendly for tourists on the go. | Train services to Strasbourg and Mulhouse, Nearby cafes and bakeries |
| Champ de Mars | A family-friendly park area that hosts events and has a playground, attractive to families visiting Colmar. | Champ de Mars Park, Playgrounds, Walking paths |
| Wine Route | Located near the famous Alsace Wine Route, this area is ideal for wine lovers and tourists looking to explore wineries and vineyards. | Wine tastings, Scenic vineyard tours, Local wine shops, Traditional wine festivals |
Understanding Airbnb License Requirements & STR Laws in Colmar (2025)
Yes, Colmar, Grand Est, France enforces high STR regulations. Obtaining a license and ensuring compliance is almost certainly required according to current 2025 STR laws. Always verify the latest short term rental regulations and Airbnb license requirements directly with local government authorities for Colmar to ensure full compliance before hosting.
(Source: AirROI data, 2025, based on 88% licensed listings)
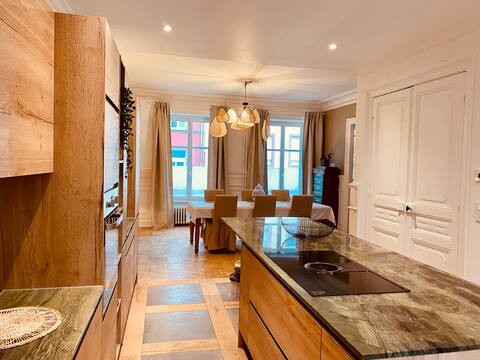
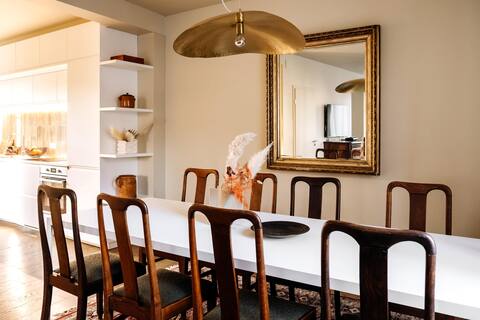
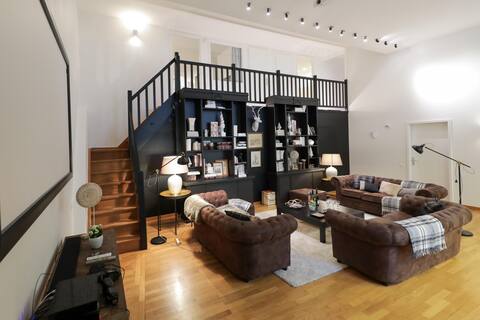
Top Performing Airbnb Properties in Colmar (2025)
Benchmark your potential! Explore examples of top-performing Airbnb properties in Colmarbased on Trailing Twelve Month (TTM) revenue. Analyze their characteristics, revenue, occupancy rate, and ADR to understand what drives success in this market.
Villa Alma
Entire Place • 4 bedrooms

Along the water, in the heart of Little Venice
Entire Place • 4 bedrooms
Large Townhouse in Colmar
Entire Place • 5 bedrooms
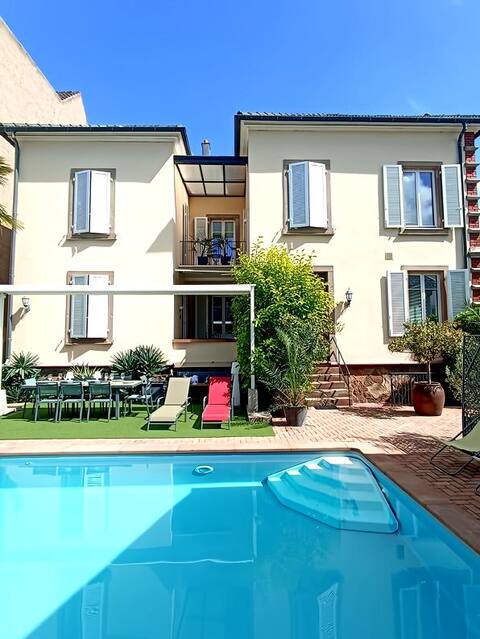
Luxury House with Pool
Entire Place • 4 bedrooms
haussmann duplex 5br 3bth city center 225m2
Entire Place • 5 bedrooms
Charming house - Downtown Colmar
Entire Place • 5 bedrooms
Note: Performance varies based on location, size, amenities, seasonality, and management quality. Data reflects the past 12 months.
Top Performing Airbnb Hosts in Colmar (2025)
Learn from the best! This table showcases top-performing Airbnb hosts in Colmar based on the number of properties managed and estimated total revenue over the past year. Analyze their scale and performance metrics.
| Host Name | Properties | Grossing Revenue | Stay Reviews | Avg Rating |
|---|---|---|---|---|
| Marie Et Son Équipe | 54 | $1,628,121 | 2121 | 4.42/5.0 |
| Travel Homes | 19 | $569,719 | 1491 | 4.56/5.0 |
| Ghi | 19 | $421,140 | 289 | 3.76/5.0 |
| BookingAlsace | 19 | $280,438 | 458 | 4.13/5.0 |
| Marie-Judith | 5 | $267,356 | 219 | 3.99/5.0 |
| Michel & Cathy | 5 | $250,329 | 581 | 4.88/5.0 |
| Kamila | 9 | $226,817 | 327 | 4.75/5.0 |
| Lison Et Jean | 6 | $204,874 | 403 | 4.91/5.0 |
| Delphine | 10 | $201,051 | 772 | 4.71/5.0 |
| Frédéric Italiano | 9 | $197,262 | 377 | 4.51/5.0 |
Analyzing the strategies of top hosts, such as their property selection, pricing, and guest communication, can offer valuable lessons for optimizing your own Airbnb operations in Colmar.
Dive Deeper: Advanced Colmar STR Market Data (2025)
Ready to unlock more insights? AirROI provides access to advanced metrics and comprehensive Airbnb data for Colmar. Explore detailed analytics beyond this report to refine your investment strategy, optimize pricing, and maximize your vacation rental profits.
Explore Advanced MetricsColmar Short-Term Rental Market Composition (2025): Property & Room Types
Room Type Distribution
Property Type Distribution
Market Composition Insights for Colmar
- The Colmar Airbnb market composition is heavily skewed towards Entire Home/Apt listings, which make up 92.8% of the 1,079 active rentals. This indicates strong guest preference for privacy and space.
- Looking at the property type distribution in Colmar, Apartment/Condo properties are the most common (87.3%), reflecting the local real estate landscape.
- Smaller segments like hotel/boutique, others, unique stays (combined 2.9%) offer potential for unique stay experiences.
Colmar Airbnb Room Capacity Analysis (2025): Bedroom Distribution
Distribution of Listings by Number of Bedrooms
Room Capacity Insights for Colmar
- The dominant room capacity in Colmar is 1 bedroom listings, making up 46.6% of the market. This suggests a strong demand for properties suitable for couples or solo travelers.
- Together, 1 bedroom and 2 bedrooms properties represent 74.9% of the active Airbnb listings in Colmar, indicating a high concentration in these sizes.
Colmar Vacation Rental Guest Capacity Trends (2025)
Distribution of Listings by Guest Capacity
Guest Capacity Insights for Colmar
- The most common guest capacity trend in Colmar vacation rentals is listings accommodating 4 guests (34.1%). This suggests the primary traveler segment is likely small families or groups.
- Properties designed for 4 guests and 2 guests dominate the Colmar STR market, accounting for 59.3% of listings.
- 23.7% of properties accommodate 6+ guests, serving the market segment for larger families or group travel in Colmar.
- On average, properties in Colmar are equipped to host 3.9 guests.
Colmar Airbnb Booking Patterns (2025): Available vs. Booked Days
Available Days Distribution
Booked Days Distribution
Booking Pattern Insights for Colmar
- The most common availability pattern in Colmar falls within the 91-180 days range, representing 31.3% of listings. This suggests many properties have significant open periods on their calendars.
- Approximately 60.3% of listings show high availability (181+ days open annually), indicating potential for increased bookings or specific owner usage patterns.
- For booked days, the 181-270 days range is most frequent in Colmar (32%), reflecting common guest stay durations or potential owner blocking patterns.
- A notable 41.5% of properties secure long booking periods (181+ days booked per year), highlighting successful long-term rental strategies or significant owner usage.
Colmar Airbnb Minimum Stay Requirements Analysis
Distribution of Listings by Minimum Night Requirement
1 Night
204 listings
19.4% of total
2 Nights
443 listings
42.1% of total
3 Nights
110 listings
10.5% of total
4-6 Nights
26 listings
2.5% of total
7-29 Nights
6 listings
0.6% of total
30+ Nights
263 listings
25% of total
Key Insights
- The most prevalent minimum stay requirement in Colmar is 2 Nights, adopted by 42.1% of listings. This highlights the market's preference for shorter, flexible bookings.
- A strong majority (61.5%) of the Colmar Airbnb data shows acceptance of very short stays (1-2 nights), indicating a dynamic, high-turnover market.
- A significant segment (25%) caters to monthly stays (30+ nights) in Colmar, pointing to opportunities in the extended-stay market.
Recommendations
- Align with the market by considering a 2 Nights minimum stay, as 42.1% of Colmar hosts use this setting.
- If feasible, allowing 1-night stays, especially midweek or during low season, could capture last-minute bookings, as only 19.4% currently do.
- A 2-night minimum appears standard (42.1%). Consider this for weekends or peak periods.
- Explore offering discounts for stays of 30+ nights to attract the 25% of the market seeking extended stays.
- Adjust minimum nights based on seasonality – potentially shorter during low season and longer during peak demand periods in Colmar.
Colmar Airbnb Cancellation Policy Trends Analysis (2025)
Super Strict 30 Days
8 listings
0.8% of total
Super Strict 60 Days
6 listings
0.6% of total
Refundable
3 listings
0.3% of total
Non-refundable
2 listings
0.2% of total
Flexible
205 listings
19.9% of total
Moderate
344 listings
33.3% of total
Firm
254 listings
24.6% of total
Strict
210 listings
20.3% of total
Cancellation Policy Insights for Colmar
- The prevailing Airbnb cancellation policy trend in Colmar is Moderate, used by 33.3% of listings.
- There's a relatively balanced mix between guest-friendly (53.2%) and stricter (44.9%) policies, offering choices for different guest needs.
Recommendations for Hosts
- Consider adopting a Moderate policy to align with the 33.3% market standard in Colmar.
- Regularly review your cancellation policy against competitors and market demand shifts in Colmar.
Colmar STR Booking Lead Time Analysis (2025)
Average Booking Lead Time by Month
Booking Lead Time Insights for Colmar
- The overall average booking lead time for vacation rentals in Colmar is 61 days.
- Guests book furthest in advance for stays during December (average 101 days), likely coinciding with peak travel demand or local events.
- The shortest booking windows occur for stays in February (average 39 days), indicating more last-minute travel plans during this time.
- Seasonally, Summer (69 days avg.) sees the longest lead times, while Spring (58 days avg.) has the shortest, reflecting typical travel planning cycles.
Recommendations for Hosts
- Use the overall average lead time (61 days) as a baseline for your pricing and availability strategy in Colmar.
- For December stays, consider implementing length-of-stay discounts or slightly higher rates for bookings made less than 101 days out to capitalize on advance planning.
- Target marketing efforts for the Summer season well in advance (at least 69 days) to capture early planners.
- Monitor your own booking lead times against these Colmar averages to identify opportunities for dynamic pricing adjustments.
Popular & Essential Airbnb Amenities in Colmar (2025)
Amenity Prevalence
Amenity Insights for Colmar
- Essential amenities in Colmar that guests expect include: Heating, Wifi. Lacking these (any) could significantly impact bookings.
- Popular amenities like Kitchen, Smoke alarm, TV are common but not universal. Offering these can provide a competitive edge.
Recommendations for Hosts
- Ensure your listing includes all essential amenities for Colmar: Heating, Wifi.
- Prioritize adding missing essentials: Heating, Wifi.
- Consider adding popular differentiators like Kitchen or Smoke alarm to increase appeal.
- Highlight unique or less common amenities you offer (e.g., hot tub, dedicated workspace, EV charger) in your listing description and photos.
- Regularly check competitor amenities in Colmar to stay competitive.
Colmar Airbnb Guest Demographics & Profile Analysis (2025)
Guest Profile Summary for Colmar
- The typical guest profile for Airbnb in Colmar consists of predominantly international visitors (70%), with top international origins including Germany, typically belonging to the Post-2000s (Gen Z/Alpha) group (50%), primarily speaking English or French.
- Domestic travelers account for 30.3% of guests.
- Key international markets include France (30.3%) and Germany (12.9%).
- Top languages spoken are English (39.9%) followed by French (20.9%).
- A significant demographic segment is the Post-2000s (Gen Z/Alpha) group, representing 50% of guests.
Recommendations for Hosts
- Focus marketing internationally, particularly towards travelers from Germany.
- Tailor amenities and listing descriptions to appeal to the dominant Post-2000s (Gen Z/Alpha) demographic (e.g., highlight fast WiFi, smart home features, local guides).
- Highlight unique local experiences or amenities relevant to the primary guest profile.
- Consider seasonal promotions aligned with peak travel times for key origin markets.
Nearby Short-Term Rental Market Comparison
How does the Colmar Airbnb market stack up against its neighbors? Compare key performance metrics like average monthly revenue, ADR, and occupancy rates in surrounding areas to understand the broader regional STR landscape.
| Market | Active Properties | Monthly Revenue | Daily Rate | Avg. Occupancy |
|---|---|---|---|---|
| Vitznau | 29 | $4,171 | $333.53 | 51% |
| Lucerne | 371 | $3,870 | $260.48 | 54% |
| Ittenheim | 19 | $3,672 | $228.19 | 45% |
| Furdenheim | 16 | $3,576 | $330.05 | 50% |
| Schwyz | 18 | $3,491 | $251.34 | 51% |
| Weggis | 48 | $3,444 | $251.92 | 49% |
| Meggen | 10 | $3,324 | $212.62 | 58% |
| Osenbach | 23 | $3,150 | $276.55 | 39% |
| Le Valtin | 18 | $3,072 | $289.72 | 38% |
| Griesheim-près-Molsheim | 19 | $3,065 | $263.48 | 41% |