ʻĀrue Airbnb Market Analysis 2025: Short Term Rental Data & Vacation Rental Statistics in French Polynesia, France
Is Airbnb profitable in ʻĀrue in 2025? Explore comprehensive Airbnb analytics for ʻĀrue, French Polynesia, France to uncover income potential. This 2025 STR market report for ʻĀrue, based on AirROI data from April 2024 to March 2025, reveals key trends in the niche market of 47 active listings.
Whether you're considering an Airbnb investment in ʻĀrue, optimizing your existing vacation rental, or exploring rental arbitrage opportunities, understanding the ʻĀrue Airbnb data is crucial. Navigating the high regulation landscape is key to maximizing your short term rental income potential. Let's dive into the specifics.
Key ʻĀrue Airbnb Performance Metrics Overview
Monthly Airbnb Revenue Variations & Income Potential in ʻĀrue (2025)
Understanding the monthly revenue variations for Airbnb listings in ʻĀrue is key to maximizing your short term rental income potential. Seasonality significantly impacts earnings. Our analysis, based on data from the past 12 months, shows that the peak revenue month for STRs in ʻĀrue is typically June, while March often presents the lowest earnings, highlighting opportunities for strategic pricing adjustments during shoulder and low seasons. Explore the typical Airbnb income in ʻĀrue across different performance tiers:
- Best-in-class properties (Top 10%) achieve $5,171+ monthly, often utilizing dynamic pricing and superior guest experiences.
- Strong performing properties (Top 25%) earn $3,938 or more, indicating effective management and desirable locations/amenities.
- Typical properties (Median) generate around $2,590 per month, representing the average market performance.
- Entry-level properties (Bottom 25%) see earnings around $1,405, often with potential for optimization.
Average Monthly Airbnb Earnings Trend in ʻĀrue
ʻĀrue Airbnb Occupancy Rate Trends (2025)
Maximize your bookings by understanding the ʻĀrue STR occupancy trends. Seasonal demand shifts significantly influence how often properties are booked. Typically, Octobersees the highest demand (peak season occupancy), while March experiences the lowest (low season). Effective strategies, like adjusting minimum stays or offering promotions, can boost occupancy during slower periods. Here's how different property tiers perform in ʻĀrue:
- Best-in-class properties (Top 10%) achieve 85%+ occupancy, indicating high desirability and potentially optimized availability.
- Strong performing properties (Top 25%) maintain 75% or higher occupancy, suggesting good market fit and guest satisfaction.
- Typical properties (Median) have an occupancy rate around 57%.
- Entry-level properties (Bottom 25%) average 32% occupancy, potentially facing higher vacancy.
Average Monthly Occupancy Rate Trend in ʻĀrue
Average Daily Rate (ADR) Airbnb Trends in ʻĀrue (2025)
Effective short term rental pricing strategy in ʻĀrue involves understanding monthly ADR fluctuations. The Average Daily Rate (ADR) for Airbnb in ʻĀrue typically peaks in July and dips lowest during March. Leveraging Airbnb dynamic pricing tools or strategies based on this seasonality can significantly boost revenue. Here's a look at the typical nightly rates achieved:
- Best-in-class properties (Top 10%) command rates of $276+ per night, often due to premium features or locations.
- Strong performing properties (Top 25%) achieve nightly rates of $193 or more.
- Typical properties (Median) charge around $146 per night.
- Entry-level properties (Bottom 25%) earn around $103 per night.
Average Daily Rate (ADR) Trend by Month in ʻĀrue
Get Live ʻĀrue Market Intelligence 👇

Explore Real-time Analytics
Airbnb Seasonality Analysis & Trends in ʻĀrue (2025)
Peak Season (June, May, October)
- Revenue averages $3,457 per month
- Occupancy rates average 56.7%
- Daily rates average $175
Shoulder Season
- Revenue averages $2,912 per month
- Occupancy maintains around 54.6%
- Daily rates hold near $173
Low Season (January, February, March)
- Revenue drops to average $2,260 per month
- Occupancy decreases to average 47.2%
- Daily rates adjust to average $162
Seasonality Insights for ʻĀrue
- The Airbnb seasonality in ʻĀrue shows moderate seasonality with distinct peak and low periods. While the sections above show seasonal averages, it's also insightful to look at the extremes:
- During the high season, the absolute peak month showcases ʻĀrue's highest earning potential, with monthly revenues capable of climbing to $3,511, occupancy reaching a high of 63.1%, and ADRs peaking at $177.
- Conversely, the slowest single month of the year, typically falling within the low season, marks the market's lowest point. In this month, revenue might dip to $1,932, occupancy could drop to 36.6%, and ADRs may adjust down to $161.
- Understanding both the seasonal averages and these monthly peaks and troughs in revenue, occupancy, and ADR is crucial for maximizing your Airbnb profit potential in ʻĀrue.
Seasonal Strategies for Maximizing Profit
- Peak Season: Maximize revenue through premium pricing and potentially longer minimum stays. Ensure high availability.
- Low Season: Offer competitive pricing, special promotions (e.g., extended stay discounts), and flexible cancellation policies. Target off-season travelers like remote workers or budget-conscious guests.
- Shoulder Seasons: Implement dynamic pricing that balances peak and low rates. Target weekend travelers or specific events. Offer slightly more flexible terms than peak season.
- Regularly analyze your own performance against these ʻĀrue seasonality benchmarks and adjust your pricing and availability strategy accordingly.
Best Areas for Airbnb Investment in ʻĀrue (2025)
Exploring the top neighborhoods for short-term rentals in ʻĀrue? This section highlights key areas, outlining why they are attractive for hosts and guests, along with notable local attractions. Consider these locations based on your target guest profile and investment strategy.
| Neighborhood / Area | Why Host Here? (Target Guests & Appeal) | Key Attractions & Landmarks |
|---|---|---|
| Papeete | The capital city of French Polynesia, Papeete is a bustling hub of activity with vibrant markets, restaurants, and nightlife. It's the gateway for travelers heading to other islands, making it an ideal location for Airbnb hosts. | Municipal Market, Papeete Harbour, Bougainville Park, Museum of Tahiti and the Islands, Cathedral of Our Lady of Papeete |
| Bora Bora | Renowned for its stunning lagoon and luxury resorts, Bora Bora is a top destination for romantic getaways and honeymoons. It's perfect for hosts catering to high-end travelers seeking a tropical paradise experience. | Mount Otemanu, Matira Beach, Coral Gardens, Lagoonarium, Bora Bora Turtle Centre |
| Moorea | Known for its striking landscapes and outdoor activities, Moorea is popular with visitors who want to explore nature, enjoy beaches, and partake in water sports. It appeals to families and adventure seekers. | Belvedere Lookout, Temae Beach, Moorea Tropical Garden, Lagoon Tours, Hiking Trails |
| Raiatea | Often referred to as the sacred island, Raiatea is rich in Polynesian culture and history. It's an ideal spot for guests looking for a more authentic and less touristy experience amidst nature. | Mount Temehani, Taputapuātea, Raiatea Botanical Gardens, Lagoon Tours, Cultural Sites |
| Huahine | Known for its authentic Polynesian culture and beautiful landscapes, Huahine provides a serene getaway for tourists looking to escape the hustle and bustle. Great for eco-tourism and cultural experiences. | Huahine Coral Gardens, Fare Beach, Maroe Bay, Cultural Plantations, Archaeological Sites |
| Taha'a | Famous for its vanilla plantations, Taha'a offers a unique and tranquil experience for travelers. It's perfect for anyone seeking relaxation and connection with nature away from crowded tourist spots. | Vanilla Plantations, Coral Garden, Raiatea Island Views, Snorkeling Spots, Sunset Views |
| Tetiaroa | A private island paradise that was once the retreat of Marlon Brando, Tetiaroa is now a luxury destination known for its exclusivity. It's ideal for Airbnb hosts offering unique high-end experiences. | Tetiaroa Eco Resort, Pristine Beaches, Marine Life, Tropical Flora, Historical Significance |
| Tikehau | A hidden gem in French Polynesia renowned for its pink sand beaches and rich marine life, Tikehau is ideal for eco-tourists and beach lovers. Perfect for small-scale, environmental-conscious stays. | Pink Sand Beaches, Tikehau Lagoon, Bird Watching, Diving and Snorkeling, Marine Conservation |
Understanding Airbnb License Requirements & STR Laws in ʻĀrue (2025)
Yes, ʻĀrue, French Polynesia, France enforces high STR regulations. Obtaining a license and ensuring compliance is almost certainly required according to current 2025 STR laws. Always verify the latest short term rental regulations and Airbnb license requirements directly with local government authorities for ʻĀrue to ensure full compliance before hosting.
(Source: AirROI data, 2025, based on 81% licensed listings)
Top Performing Airbnb Properties in ʻĀrue (2025)
Benchmark your potential! Explore examples of top-performing Airbnb properties in ʻĀruebased on Trailing Twelve Month (TTM) revenue. Analyze their characteristics, revenue, occupancy rate, and ADR to understand what drives success in this market.

Tahiti beach house your Bnb on the beach
Entire Place • 3 bedrooms
Villa Te Torea
Entire Place • 3 bedrooms
NEW Luxury & Modern FARE MAOTI
Entire Place • 2 bedrooms

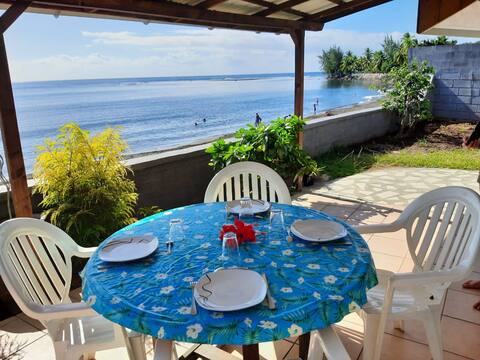
Seaside Apartment F2 luxury .
Entire Place • 1 bedroom

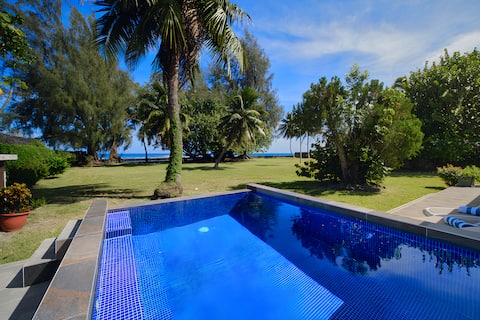
On the beach, comfortable, with pool
Entire Place • 1 bedroom
Beach access bungalow with on-site parking
Entire Place • 1 bedroom
Note: Performance varies based on location, size, amenities, seasonality, and management quality. Data reflects the past 12 months.
Top Performing Airbnb Hosts in ʻĀrue (2025)
Learn from the best! This table showcases top-performing Airbnb hosts in ʻĀrue based on the number of properties managed and estimated total revenue over the past year. Analyze their scale and performance metrics.
| Host Name | Properties | Grossing Revenue | Stay Reviews | Avg Rating |
|---|---|---|---|---|
| Jim | 3 | $101,902 | 238 | 4.89/5.0 |
| Bea | 2 | $100,148 | 133 | 4.82/5.0 |
| Lovina | 1 | $78,260 | 193 | 4.85/5.0 |
| Christophe | 1 | $68,184 | 3 | 5.00/5.0 |
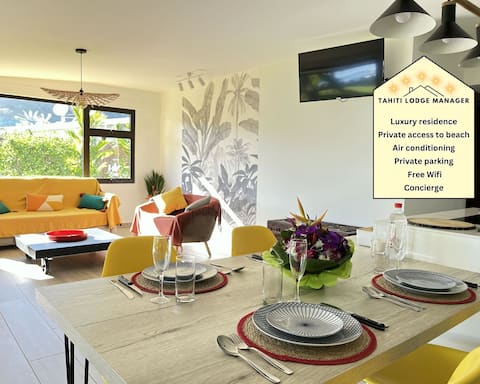
| Tahiti Lodge Manager | 1 | $63,952 | 25 | 4.88/5.0 |
| Jean-Pierre | 1 | $61,426 | 21 | 4.90/5.0 |
| Pascal | 2 | $58,085 | 16 | 4.55/5.0 |
| Teiva | 2 | $50,581 | 125 | 4.98/5.0 |
| Bruno | 1 | $46,321 | 49 | 4.94/5.0 |
| Jacques | 1 | $45,732 | 59 | 4.98/5.0 |
Analyzing the strategies of top hosts, such as their property selection, pricing, and guest communication, can offer valuable lessons for optimizing your own Airbnb operations in ʻĀrue.
Dive Deeper: Advanced ʻĀrue STR Market Data (2025)
Ready to unlock more insights? AirROI provides access to advanced metrics and comprehensive Airbnb data for ʻĀrue. Explore detailed analytics beyond this report to refine your investment strategy, optimize pricing, and maximize your vacation rental profits.
Explore Advanced MetricsʻĀrue Short-Term Rental Market Composition (2025): Property & Room Types
Room Type Distribution
Property Type Distribution
Market Composition Insights for ʻĀrue
- The ʻĀrue Airbnb market composition is heavily skewed towards Entire Home/Apt listings, which make up 89.4% of the 47 active rentals. This indicates strong guest preference for privacy and space.
- Looking at the property type distribution in ʻĀrue, Apartment/Condo properties are the most common (55.3%), reflecting the local real estate landscape.
- Houses represent a significant 31.9% portion, catering likely to families or larger groups.
- The presence of 6.4% Hotel/Boutique listings indicates integration with traditional hospitality.
- Smaller segments like others, unique stays (combined 6.4%) offer potential for unique stay experiences.
ʻĀrue Airbnb Room Capacity Analysis (2025): Bedroom Distribution
Distribution of Listings by Number of Bedrooms
Room Capacity Insights for ʻĀrue
- The dominant room capacity in ʻĀrue is 1 bedroom listings, making up 70.2% of the market. This suggests a strong demand for properties suitable for couples or solo travelers.
- Together, 1 bedroom and 2 bedrooms properties represent 80.8% of the active Airbnb listings in ʻĀrue, indicating a high concentration in these sizes.
- With over half the market (70.2%) consisting of studios or 1-bedroom units, ʻĀrue is particularly well-suited for individuals or couples.
- Listings with 3+ bedrooms (8.5%) represent a smaller niche, potentially indicating an underserved market for larger group accommodations in ʻĀrue.
ʻĀrue Vacation Rental Guest Capacity Trends (2025)
Distribution of Listings by Guest Capacity
Guest Capacity Insights for ʻĀrue
- The most common guest capacity trend in ʻĀrue vacation rentals is listings accommodating 2 guests (40.4%). This suggests the primary traveler segment is likely couples or solo travelers.
- Properties designed for 2 guests and 4 guests dominate the ʻĀrue STR market, accounting for 61.7% of listings.
- A significant 42.5% of listings cater specifically to 1-2 guests, highlighting strong demand from couples and solo travelers in ʻĀrue.
- 10.7% of properties accommodate 6+ guests, serving the market segment for larger families or group travel in ʻĀrue.
- On average, properties in ʻĀrue are equipped to host 3.2 guests.
ʻĀrue Airbnb Booking Patterns (2025): Available vs. Booked Days
Available Days Distribution
Booked Days Distribution
Booking Pattern Insights for ʻĀrue
- The most common availability pattern in ʻĀrue falls within the 91-180 days range, representing 38.3% of listings. This suggests many properties have significant open periods on their calendars.
- Approximately 55.3% of listings show high availability (181+ days open annually), indicating potential for increased bookings or specific owner usage patterns.
- For booked days, the 181-270 days range is most frequent in ʻĀrue (36.2%), reflecting common guest stay durations or potential owner blocking patterns.
- A notable 44.7% of properties secure long booking periods (181+ days booked per year), highlighting successful long-term rental strategies or significant owner usage.
ʻĀrue Airbnb Minimum Stay Requirements Analysis
Distribution of Listings by Minimum Night Requirement
1 Night
7 listings
16.3% of total
2 Nights
15 listings
34.9% of total
3 Nights
14 listings
32.6% of total
4-6 Nights
1 listings
2.3% of total
7-29 Nights
2 listings
4.7% of total
30+ Nights
4 listings
9.3% of total
Key Insights
- The most prevalent minimum stay requirement in ʻĀrue is 2 Nights, adopted by 34.9% of listings. This highlights the market's preference for shorter, flexible bookings.
Recommendations
- Align with the market by considering a 2 Nights minimum stay, as 34.9% of ʻĀrue hosts use this setting.
- If feasible, allowing 1-night stays, especially midweek or during low season, could capture last-minute bookings, as only 16.3% currently do.
- A 2-night minimum appears standard (34.9%). Consider this for weekends or peak periods.
- Explore offering discounts for stays of 30+ nights to attract the 9.3% of the market seeking extended stays.
- Adjust minimum nights based on seasonality – potentially shorter during low season and longer during peak demand periods in ʻĀrue.
ʻĀrue Airbnb Cancellation Policy Trends Analysis (2025)
Super Strict 30 Days
1 listings
2.6% of total
Flexible
7 listings
17.9% of total
Moderate
13 listings
33.3% of total
Firm
10 listings
25.6% of total
Strict
8 listings
20.5% of total
Cancellation Policy Insights for ʻĀrue
- The prevailing Airbnb cancellation policy trend in ʻĀrue is Moderate, used by 33.3% of listings.
- There's a relatively balanced mix between guest-friendly (51.2%) and stricter (46.1%) policies, offering choices for different guest needs.
Recommendations for Hosts
- Consider adopting a Moderate policy to align with the 33.3% market standard in ʻĀrue.
- Regularly review your cancellation policy against competitors and market demand shifts in ʻĀrue.
ʻĀrue STR Booking Lead Time Analysis (2025)
Average Booking Lead Time by Month
Booking Lead Time Insights for ʻĀrue
- The overall average booking lead time for vacation rentals in ʻĀrue is 71 days.
- Guests book furthest in advance for stays during July (average 136 days), likely coinciding with peak travel demand or local events.
- The shortest booking windows occur for stays in February (average 47 days), indicating more last-minute travel plans during this time.
- Seasonally, Summer (108 days avg.) sees the longest lead times, while Winter (57 days avg.) has the shortest, reflecting typical travel planning cycles.
Recommendations for Hosts
- Use the overall average lead time (71 days) as a baseline for your pricing and availability strategy in ʻĀrue.
- For July stays, consider implementing length-of-stay discounts or slightly higher rates for bookings made less than 136 days out to capitalize on advance planning.
- Target marketing efforts for the Summer season well in advance (at least 108 days) to capture early planners.
- Monitor your own booking lead times against these ʻĀrue averages to identify opportunities for dynamic pricing adjustments.
Popular & Essential Airbnb Amenities in ʻĀrue (2025)
Amenity Prevalence
Amenity Insights for ʻĀrue
- Essential amenities in ʻĀrue that guests expect include: Wifi, Free parking on premises, Dishes and silverware, Essentials. Lacking these (any) could significantly impact bookings.
- Popular amenities like TV, Hot water, Kitchen are common but not universal. Offering these can provide a competitive edge.
Recommendations for Hosts
- Ensure your listing includes all essential amenities for ʻĀrue: Wifi, Free parking on premises, Dishes and silverware, Essentials.
- Prioritize adding missing essentials: Free parking on premises, Dishes and silverware, Essentials.
- Consider adding popular differentiators like TV or Hot water to increase appeal.
- Highlight unique or less common amenities you offer (e.g., hot tub, dedicated workspace, EV charger) in your listing description and photos.
- Regularly check competitor amenities in ʻĀrue to stay competitive.
ʻĀrue Airbnb Guest Demographics & Profile Analysis (2025)
Guest Profile Summary for ʻĀrue
- The typical guest profile for Airbnb in ʻĀrue consists of predominantly international visitors (77%), with top international origins including France, typically belonging to the Post-2000s (Gen Z/Alpha) group (50%), primarily speaking English or French.
- Domestic travelers account for 23.4% of guests.
- Key international markets include United States (40%) and France (23.4%).
- Top languages spoken are English (43.4%) followed by French (26.9%).
- A significant demographic segment is the Post-2000s (Gen Z/Alpha) group, representing 50% of guests.
Recommendations for Hosts
- Focus marketing internationally, particularly towards travelers from France.
- Tailor amenities and listing descriptions to appeal to the dominant Post-2000s (Gen Z/Alpha) demographic (e.g., highlight fast WiFi, smart home features, local guides).
- Highlight unique local experiences or amenities relevant to the primary guest profile.
- Consider seasonal promotions aligned with peak travel times for key origin markets.
Nearby Short-Term Rental Market Comparison
How does the ʻĀrue Airbnb market stack up against its neighbors? Compare key performance metrics like average monthly revenue, ADR, and occupancy rates in surrounding areas to understand the broader regional STR landscape.
| Market | Active Properties | Monthly Revenue | Daily Rate | Avg. Occupancy |
|---|---|---|---|---|
| Moorea-Maiao | 580 | $3,415 | $247.46 | 49% |
| Pāʻea | 72 | $2,606 | $198.95 | 50% |
| Punaʻauiʻa | 300 | $2,424 | $205.07 | 48% |
| Papara | 36 | $1,649 | $210.49 | 29% |
| Faʻaʻā | 120 | $1,509 | $122.99 | 46% |
| Papeete | 241 | $1,502 | $132.20 | 47% |
| Teva I Uta | 20 | $1,468 | $224.39 | 31% |
| Taiarapu-Est | 71 | $1,385 | $174.49 | 35% |
| Taiarapu-Ouest | 78 | $1,345 | $217.29 | 34% |
| Pīraʻe | 33 | $1,342 | $147.45 | 40% |