Taputapuatea Airbnb Market Analysis 2025: Short Term Rental Data & Vacation Rental Statistics in French Polynesia, France
Is Airbnb profitable in Taputapuatea in 2025? Explore comprehensive Airbnb analytics for Taputapuatea, French Polynesia, France to uncover income potential. This 2025 STR market report for Taputapuatea, based on AirROI data from April 2024 to March 2025, reveals key trends in the niche market of 52 active listings.
Whether you're considering an Airbnb investment in Taputapuatea, optimizing your existing vacation rental, or exploring rental arbitrage opportunities, understanding the Taputapuatea Airbnb data is crucial. Navigating the high regulation landscape is key to maximizing your short term rental income potential. Let's dive into the specifics.
Key Taputapuatea Airbnb Performance Metrics Overview
Monthly Airbnb Revenue Variations & Income Potential in Taputapuatea (2025)
Understanding the monthly revenue variations for Airbnb listings in Taputapuatea is key to maximizing your short term rental income potential. Seasonality significantly impacts earnings. Our analysis, based on data from the past 12 months, shows that the peak revenue month for STRs in Taputapuatea is typically May, while December often presents the lowest earnings, highlighting opportunities for strategic pricing adjustments during shoulder and low seasons. Explore the typical Airbnb income in Taputapuatea across different performance tiers:
- Best-in-class properties (Top 10%) achieve $5,128+ monthly, often utilizing dynamic pricing and superior guest experiences.
- Strong performing properties (Top 25%) earn $3,331 or more, indicating effective management and desirable locations/amenities.
- Typical properties (Median) generate around $2,045 per month, representing the average market performance.
- Entry-level properties (Bottom 25%) see earnings around $1,079, often with potential for optimization.
Average Monthly Airbnb Earnings Trend in Taputapuatea
Taputapuatea Airbnb Occupancy Rate Trends (2025)
Maximize your bookings by understanding the Taputapuatea STR occupancy trends. Seasonal demand shifts significantly influence how often properties are booked. Typically, Maysees the highest demand (peak season occupancy), while January experiences the lowest (low season). Effective strategies, like adjusting minimum stays or offering promotions, can boost occupancy during slower periods. Here's how different property tiers perform in Taputapuatea:
- Best-in-class properties (Top 10%) achieve 80%+ occupancy, indicating high desirability and potentially optimized availability.
- Strong performing properties (Top 25%) maintain 62% or higher occupancy, suggesting good market fit and guest satisfaction.
- Typical properties (Median) have an occupancy rate around 39%.
- Entry-level properties (Bottom 25%) average 20% occupancy, potentially facing higher vacancy.
Average Monthly Occupancy Rate Trend in Taputapuatea
Average Daily Rate (ADR) Airbnb Trends in Taputapuatea (2025)
Effective short term rental pricing strategy in Taputapuatea involves understanding monthly ADR fluctuations. The Average Daily Rate (ADR) for Airbnb in Taputapuatea typically peaks in November and dips lowest during March. Leveraging Airbnb dynamic pricing tools or strategies based on this seasonality can significantly boost revenue. Here's a look at the typical nightly rates achieved:
- Best-in-class properties (Top 10%) command rates of $283+ per night, often due to premium features or locations.
- Strong performing properties (Top 25%) achieve nightly rates of $232 or more.
- Typical properties (Median) charge around $145 per night.
- Entry-level properties (Bottom 25%) earn around $106 per night.
Average Daily Rate (ADR) Trend by Month in Taputapuatea
Get Live Taputapuatea Market Intelligence 👇

Explore Real-time Analytics
Airbnb Seasonality Analysis & Trends in Taputapuatea (2025)
Peak Season (May, April, June)
- Revenue averages $3,342 per month
- Occupancy rates average 45.5%
- Daily rates average $172
Shoulder Season
- Revenue averages $2,519 per month
- Occupancy maintains around 45.1%
- Daily rates hold near $175
Low Season (January, February, December)
- Revenue drops to average $1,608 per month
- Occupancy decreases to average 32.4%
- Daily rates adjust to average $175
Seasonality Insights for Taputapuatea
- The Airbnb seasonality in Taputapuatea shows highly seasonal trends requiring careful strategy. While the sections above show seasonal averages, it's also insightful to look at the extremes:
- During the high season, the absolute peak month showcases Taputapuatea's highest earning potential, with monthly revenues capable of climbing to $3,390, occupancy reaching a high of 51.3%, and ADRs peaking at $190.
- Conversely, the slowest single month of the year, typically falling within the low season, marks the market's lowest point. In this month, revenue might dip to $1,557, occupancy could drop to 29.4%, and ADRs may adjust down to $169.
- Understanding both the seasonal averages and these monthly peaks and troughs in revenue, occupancy, and ADR is crucial for maximizing your Airbnb profit potential in Taputapuatea.
Seasonal Strategies for Maximizing Profit
- Peak Season: Maximize revenue through premium pricing and potentially longer minimum stays. Ensure high availability.
- Low Season: Offer competitive pricing, special promotions (e.g., extended stay discounts), and flexible cancellation policies. Target off-season travelers like remote workers or budget-conscious guests.
- Shoulder Seasons: Implement dynamic pricing that balances peak and low rates. Target weekend travelers or specific events. Offer slightly more flexible terms than peak season.
- Regularly analyze your own performance against these Taputapuatea seasonality benchmarks and adjust your pricing and availability strategy accordingly.
Best Areas for Airbnb Investment in Taputapuatea (2025)
Exploring the top neighborhoods for short-term rentals in Taputapuatea? This section highlights key areas, outlining why they are attractive for hosts and guests, along with notable local attractions. Consider these locations based on your target guest profile and investment strategy.
| Neighborhood / Area | Why Host Here? (Target Guests & Appeal) | Key Attractions & Landmarks |
|---|---|---|
| Taputapuatea | Known for its historical significance and stunning landscapes, Taputapuatea is a UNESCO World Heritage site that attracts visitors interested in culture and natural beauty. Its scenic views and peaceful atmosphere make it an ideal location for vacation rentals. | Taputapuatea Marae, St. Joseph's Church, Motu One, The ancient stone structures, Cultural festivals |
| Bora Bora | Famous for its breathtaking lagoons and luxury resorts, Bora Bora is a top destination for honeymooners and travelers seeking luxury and relaxation. This iconic island offers pristine beaches and stunning resort experiences. | Mount Otemanu, Bora Bora Coral Gardens, Matira Beach, Vaitape, Lagoon tours |
| Moorea | Known for its lush landscapes and proximity to Tahiti, Moorea is a paradise for nature lovers and adventurers. With its rich marine life and scenic hikes, it draws visitors looking for outdoor activities and relaxation. | Belvedere Lookout, Moorea Tiki Theatre, Lagoon activities, Opunohu Bay, Snorkeling spots |
| Tahiti | As the largest island in French Polynesia, Tahiti offers a mix of culture, beaches, and urban experiences. It's an ideal base for travelers exploring the region and has vibrant markets and nightlife. | Papeete Market, Point Venus, Museum of Tahiti, Fautaua Waterfall, Black sand beaches |
| Huahine | Often referred to as the 'Garden Island', Huahine is less touristy and offers a more authentic Polynesian experience. Its natural beauty and cultural significance attract those looking for tranquility and local culture. | Maeva's ancient fish traps, Huahine Nui and Huahine Iti, Beautiful beaches, Cultural excursions, Lagoon exploration |
| Rangiroa | One of the largest atolls in the world, Rangiroa is renowned for its spectacular scuba diving and marine life. It attracts divers and ocean enthusiasts looking for unforgettable underwater experiences. | Rangiroa Lagoon, Diving spots, Pink sand beaches, Birdwatching at bird sanctuary, Vin de Tahiti tours |
| Taha'a | Known for its vanilla plantations and stunning landscapes, Taha'a offers a more intimate glimpse of island life in French Polynesia. It’s an excellent choice for those seeking romance and relaxation. | Vanilla plantations, Fa'a'ahopu Bay, Raitea regard, Coral gardens, Cultural experiences |
| Fakarava | Designated a UNESCO Biosphere Reserve, Fakarava is famous for its biodiversity and excellent diving conditions. It is perfect for eco-tourists and those seeking an off-the-beaten-path experience. | Diving spots, Rural villages, Biodiversity tours, Nature trails, Beautiful beaches |
Understanding Airbnb License Requirements & STR Laws in Taputapuatea (2025)
Yes, Taputapuatea, French Polynesia, France enforces high STR regulations. Obtaining a license and ensuring compliance is almost certainly required according to current 2025 STR laws. Always verify the latest short term rental regulations and Airbnb license requirements directly with local government authorities for Taputapuatea to ensure full compliance before hosting.
(Source: AirROI data, 2025, based on 63% licensed listings)
Top Performing Airbnb Properties in Taputapuatea (2025)
Benchmark your potential! Explore examples of top-performing Airbnb properties in Taputapuateabased on Trailing Twelve Month (TTM) revenue. Analyze their characteristics, revenue, occupancy rate, and ADR to understand what drives success in this market.

Hokulea
Entire Place • 4 bedrooms

Villa Nina - Air-conditioned holiday home
Entire Place • 2 bedrooms
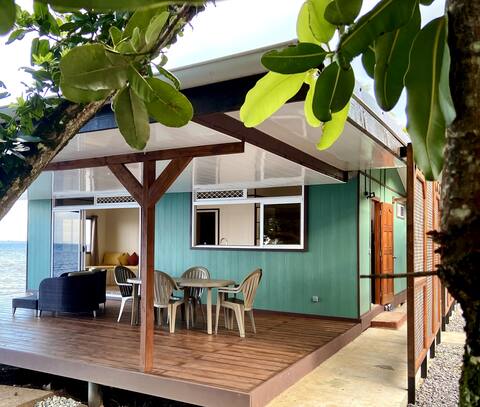
"Fare Naki Nui" house at the edge of the water
Entire Place • 1 bedroom

Sea house, private beach
Entire Place • 2 bedrooms
Maisons en Bord de mer groupe 12
Entire Place • 4 bedrooms

Raiatea Opoa in Fare Rêvé and its seaside
Entire Place • 2 bedrooms
Note: Performance varies based on location, size, amenities, seasonality, and management quality. Data reflects the past 12 months.
Top Performing Airbnb Hosts in Taputapuatea (2025)
Learn from the best! This table showcases top-performing Airbnb hosts in Taputapuatea based on the number of properties managed and estimated total revenue over the past year. Analyze their scale and performance metrics.
| Host Name | Properties | Grossing Revenue | Stay Reviews | Avg Rating |
|---|---|---|---|---|
| Benjamin | 7 | $138,844 | 19 | 2.49/5.0 |
| Fare Tepua Lodge | 4 | $100,277 | 13 | 2.50/5.0 |
| Le Noha | 2 | $72,257 | 101 | 4.99/5.0 |
| Pat | 2 | $69,985 | 27 | 5.00/5.0 |
| Hokulea | 1 | $66,437 | 3 | 5.00/5.0 |
| Stéphanie | 2 | $64,190 | 65 | 4.98/5.0 |
| Host #157810868 | 4 | $63,753 | 0 | 0.00/5.0 |
| Laure | 1 | $55,654 | 23 | 4.91/5.0 |
| Torea Et Nuutea | 1 | $53,923 | 70 | 5.00/5.0 |
| Maeva | 2 | $47,887 | 20 | 2.44/5.0 |
Analyzing the strategies of top hosts, such as their property selection, pricing, and guest communication, can offer valuable lessons for optimizing your own Airbnb operations in Taputapuatea.
Dive Deeper: Advanced Taputapuatea STR Market Data (2025)
Ready to unlock more insights? AirROI provides access to advanced metrics and comprehensive Airbnb data for Taputapuatea. Explore detailed analytics beyond this report to refine your investment strategy, optimize pricing, and maximize your vacation rental profits.
Explore Advanced MetricsTaputapuatea Short-Term Rental Market Composition (2025): Property & Room Types
Room Type Distribution
Property Type Distribution
Market Composition Insights for Taputapuatea
- The Taputapuatea Airbnb market composition is heavily skewed towards Entire Home/Apt listings, which make up 84.6% of the 52 active rentals. This indicates strong guest preference for privacy and space.
- Looking at the property type distribution in Taputapuatea, House properties are the most common (65.4%), reflecting the local real estate landscape.
- Houses represent a significant 65.4% portion, catering likely to families or larger groups.
- The presence of 9.6% Hotel/Boutique listings indicates integration with traditional hospitality.
- Smaller segments like others, outdoor/unique (combined 5.7%) offer potential for unique stay experiences.
Taputapuatea Airbnb Room Capacity Analysis (2025): Bedroom Distribution
Distribution of Listings by Number of Bedrooms
Room Capacity Insights for Taputapuatea
- The dominant room capacity in Taputapuatea is 1 bedroom listings, making up 48.1% of the market. This suggests a strong demand for properties suitable for couples or solo travelers.
- Together, 1 bedroom and 2 bedrooms properties represent 73.1% of the active Airbnb listings in Taputapuatea, indicating a high concentration in these sizes.
Taputapuatea Vacation Rental Guest Capacity Trends (2025)
Distribution of Listings by Guest Capacity
Guest Capacity Insights for Taputapuatea
- The most common guest capacity trend in Taputapuatea vacation rentals is listings accommodating 4 guests (34.6%). This suggests the primary traveler segment is likely small families or groups.
- Properties designed for 4 guests and 2 guests dominate the Taputapuatea STR market, accounting for 48.1% of listings.
- 21.1% of properties accommodate 6+ guests, serving the market segment for larger families or group travel in Taputapuatea.
- On average, properties in Taputapuatea are equipped to host 3.9 guests.
Taputapuatea Airbnb Booking Patterns (2025): Available vs. Booked Days
Available Days Distribution
Booked Days Distribution
Booking Pattern Insights for Taputapuatea
- The most common availability pattern in Taputapuatea falls within the 271-366 days range, representing 48.1% of listings. This suggests many properties have significant open periods on their calendars.
- Approximately 75.0% of listings show high availability (181+ days open annually), indicating potential for increased bookings or specific owner usage patterns.
- For booked days, the 31-90 days range is most frequent in Taputapuatea (32.7%), reflecting common guest stay durations or potential owner blocking patterns.
- A notable 27.0% of properties secure long booking periods (181+ days booked per year), highlighting successful long-term rental strategies or significant owner usage.
Taputapuatea Airbnb Minimum Stay Requirements Analysis
Distribution of Listings by Minimum Night Requirement
1 Night
15 listings
30.6% of total
2 Nights
22 listings
44.9% of total
3 Nights
6 listings
12.2% of total
7-29 Nights
3 listings
6.1% of total
30+ Nights
3 listings
6.1% of total
Key Insights
- The most prevalent minimum stay requirement in Taputapuatea is 2 Nights, adopted by 44.9% of listings. This highlights the market's preference for shorter, flexible bookings.
- A strong majority (75.5%) of the Taputapuatea Airbnb data shows acceptance of very short stays (1-2 nights), indicating a dynamic, high-turnover market.
Recommendations
- Align with the market by considering a 2 Nights minimum stay, as 44.9% of Taputapuatea hosts use this setting.
- Explore offering discounts for stays of 30+ nights to attract the 6.1% of the market seeking extended stays.
- Adjust minimum nights based on seasonality – potentially shorter during low season and longer during peak demand periods in Taputapuatea.
Taputapuatea Airbnb Cancellation Policy Trends Analysis (2025)
Flexible
9 listings
27.3% of total
Moderate
12 listings
36.4% of total
Firm
8 listings
24.2% of total
Strict
4 listings
12.1% of total
Cancellation Policy Insights for Taputapuatea
- The prevailing Airbnb cancellation policy trend in Taputapuatea is Moderate, used by 36.4% of listings.
- There's a relatively balanced mix between guest-friendly (63.7%) and stricter (36.3%) policies, offering choices for different guest needs.
Recommendations for Hosts
- Consider adopting a Moderate policy to align with the 36.4% market standard in Taputapuatea.
- Using a Strict policy might deter some guests, as only 12.1% of listings use it. Evaluate if potential revenue protection outweighs possible lower booking rates.
- Regularly review your cancellation policy against competitors and market demand shifts in Taputapuatea.
Taputapuatea STR Booking Lead Time Analysis (2025)
Average Booking Lead Time by Month
Booking Lead Time Insights for Taputapuatea
- The overall average booking lead time for vacation rentals in Taputapuatea is 50 days.
- Guests book furthest in advance for stays during June (average 142 days), likely coinciding with peak travel demand or local events.
- The shortest booking windows occur for stays in August (average 43 days), indicating more last-minute travel plans during this time.
- Seasonally, Spring (99 days avg.) sees the longest lead times, while Winter (47 days avg.) has the shortest, reflecting typical travel planning cycles.
Recommendations for Hosts
- Use the overall average lead time (50 days) as a baseline for your pricing and availability strategy in Taputapuatea.
- For June stays, consider implementing length-of-stay discounts or slightly higher rates for bookings made less than 142 days out to capitalize on advance planning.
- Target marketing efforts for the Spring season well in advance (at least 99 days) to capture early planners.
- Monitor your own booking lead times against these Taputapuatea averages to identify opportunities for dynamic pricing adjustments.
Popular & Essential Airbnb Amenities in Taputapuatea (2025)
Amenity Prevalence
Amenity Insights for Taputapuatea
- Essential amenities in Taputapuatea that guests expect include: Wifi, Kitchen, Hot water. Lacking these (any) could significantly impact bookings.
- Popular amenities like Essentials, Dishes and silverware, Cooking basics are common but not universal. Offering these can provide a competitive edge.
Recommendations for Hosts
- Ensure your listing includes all essential amenities for Taputapuatea: Wifi, Kitchen, Hot water.
- Prioritize adding missing essentials: Kitchen, Hot water.
- Consider adding popular differentiators like Essentials or Dishes and silverware to increase appeal.
- Highlight unique or less common amenities you offer (e.g., hot tub, dedicated workspace, EV charger) in your listing description and photos.
- Regularly check competitor amenities in Taputapuatea to stay competitive.
Taputapuatea Airbnb Guest Demographics & Profile Analysis (2025)
Guest Profile Summary for Taputapuatea
- The typical guest profile for Airbnb in Taputapuatea consists of a mix of domestic (62%) and international guests, often arriving from nearby Paris, typically belonging to the Post-2000s (Gen Z/Alpha) group (50%), primarily speaking French or English.
- Domestic travelers account for 62.3% of guests.
- Key international markets include France (62.3%) and French Polynesia (11.1%).
- Top languages spoken are French (37.5%) followed by English (37.1%).
- A significant demographic segment is the Post-2000s (Gen Z/Alpha) group, representing 50% of guests.
Recommendations for Hosts
- Target domestic marketing efforts towards travelers from Paris and Papeete.
- Tailor amenities and listing descriptions to appeal to the dominant Post-2000s (Gen Z/Alpha) demographic (e.g., highlight fast WiFi, smart home features, local guides).
- Highlight unique local experiences or amenities relevant to the primary guest profile.
- Consider seasonal promotions aligned with peak travel times for key origin markets.
Nearby Short-Term Rental Market Comparison
How does the Taputapuatea Airbnb market stack up against its neighbors? Compare key performance metrics like average monthly revenue, ADR, and occupancy rates in surrounding areas to understand the broader regional STR landscape.