Papeete Airbnb Market Analysis 2025: Short Term Rental Data & Vacation Rental Statistics in French Polynesia, France
Is Airbnb profitable in Papeete in 2025? Explore comprehensive Airbnb analytics for Papeete, French Polynesia, France to uncover income potential. This 2025 STR market report for Papeete, based on AirROI data from April 2024 to March 2025, reveals key trends in the market of 241 active listings.
Whether you're considering an Airbnb investment in Papeete, optimizing your existing vacation rental, or exploring rental arbitrage opportunities, understanding the Papeete Airbnb data is crucial. Navigating the high regulation landscape is key to maximizing your short term rental income potential. Let's dive into the specifics.
Key Papeete Airbnb Performance Metrics Overview
Monthly Airbnb Revenue Variations & Income Potential in Papeete (2025)
Understanding the monthly revenue variations for Airbnb listings in Papeete is key to maximizing your short term rental income potential. Seasonality significantly impacts earnings. Our analysis, based on data from the past 12 months, shows that the peak revenue month for STRs in Papeete is typically May, while March often presents the lowest earnings, highlighting opportunities for strategic pricing adjustments during shoulder and low seasons. Explore the typical Airbnb income in Papeete across different performance tiers:
- Best-in-class properties (Top 10%) achieve $3,463+ monthly, often utilizing dynamic pricing and superior guest experiences.
- Strong performing properties (Top 25%) earn $2,591 or more, indicating effective management and desirable locations/amenities.
- Typical properties (Median) generate around $1,770 per month, representing the average market performance.
- Entry-level properties (Bottom 25%) see earnings around $960, often with potential for optimization.
Average Monthly Airbnb Earnings Trend in Papeete
Papeete Airbnb Occupancy Rate Trends (2025)
Maximize your bookings by understanding the Papeete STR occupancy trends. Seasonal demand shifts significantly influence how often properties are booked. Typically, Octobersees the highest demand (peak season occupancy), while March experiences the lowest (low season). Effective strategies, like adjusting minimum stays or offering promotions, can boost occupancy during slower periods. Here's how different property tiers perform in Papeete:
- Best-in-class properties (Top 10%) achieve 82%+ occupancy, indicating high desirability and potentially optimized availability.
- Strong performing properties (Top 25%) maintain 70% or higher occupancy, suggesting good market fit and guest satisfaction.
- Typical properties (Median) have an occupancy rate around 48%.
- Entry-level properties (Bottom 25%) average 25% occupancy, potentially facing higher vacancy.
Average Monthly Occupancy Rate Trend in Papeete
Average Daily Rate (ADR) Airbnb Trends in Papeete (2025)
Effective short term rental pricing strategy in Papeete involves understanding monthly ADR fluctuations. The Average Daily Rate (ADR) for Airbnb in Papeete typically peaks in July and dips lowest during March. Leveraging Airbnb dynamic pricing tools or strategies based on this seasonality can significantly boost revenue. Here's a look at the typical nightly rates achieved:
- Best-in-class properties (Top 10%) command rates of $205+ per night, often due to premium features or locations.
- Strong performing properties (Top 25%) achieve nightly rates of $141 or more.
- Typical properties (Median) charge around $113 per night.
- Entry-level properties (Bottom 25%) earn around $93 per night.
Average Daily Rate (ADR) Trend by Month in Papeete
Get Live Papeete Market Intelligence 👇

Explore Real-time Analytics
Airbnb Seasonality Analysis & Trends in Papeete (2025)
Peak Season (May, June, April)
- Revenue averages $2,408 per month
- Occupancy rates average 46.1%
- Daily rates average $148
Shoulder Season
- Revenue averages $2,029 per month
- Occupancy maintains around 51.8%
- Daily rates hold near $147
Low Season (January, February, March)
- Revenue drops to average $1,397 per month
- Occupancy decreases to average 39.7%
- Daily rates adjust to average $133
Seasonality Insights for Papeete
- The Airbnb seasonality in Papeete shows moderate seasonality with distinct peak and low periods. While the sections above show seasonal averages, it's also insightful to look at the extremes:
- During the high season, the absolute peak month showcases Papeete's highest earning potential, with monthly revenues capable of climbing to $2,439, occupancy reaching a high of 56.8%, and ADRs peaking at $152.
- Conversely, the slowest single month of the year, typically falling within the low season, marks the market's lowest point. In this month, revenue might dip to $1,248, occupancy could drop to 35.1%, and ADRs may adjust down to $132.
- Understanding both the seasonal averages and these monthly peaks and troughs in revenue, occupancy, and ADR is crucial for maximizing your Airbnb profit potential in Papeete.
Seasonal Strategies for Maximizing Profit
- Peak Season: Maximize revenue through premium pricing and potentially longer minimum stays. Ensure high availability.
- Low Season: Offer competitive pricing, special promotions (e.g., extended stay discounts), and flexible cancellation policies. Target off-season travelers like remote workers or budget-conscious guests.
- Shoulder Seasons: Implement dynamic pricing that balances peak and low rates. Target weekend travelers or specific events. Offer slightly more flexible terms than peak season.
- Regularly analyze your own performance against these Papeete seasonality benchmarks and adjust your pricing and availability strategy accordingly.
Best Areas for Airbnb Investment in Papeete (2025)
Exploring the top neighborhoods for short-term rentals in Papeete? This section highlights key areas, outlining why they are attractive for hosts and guests, along with notable local attractions. Consider these locations based on your target guest profile and investment strategy.
| Neighborhood / Area | Why Host Here? (Target Guests & Appeal) | Key Attractions & Landmarks |
|---|---|---|
| Papeete City Center | The vibrant heart of Papeete, where visitors can experience local culture, markets, and nightlife. It's a hub for tourists looking to explore the beauty of Tahiti. | Papeete Market, Bougainville Park, Municipal Museum of Tahiti and the Islands, Notre Dame Cathedral, Papeete Harbor |
| Le Meridien Tahiti | A beautiful beachfront resort area known for its luxury accommodations and stunning sunset views. Ideal for travelers seeking a relaxing getaway with direct access to the beach. | Le Meridien Beach, Mataiea Ecoresort, Water sports activities, Restaurants and bars, Coral reefs nearby |
| Arue | Located just outside Papeete, this area offers a mix of residential tranquility and coastal beauty, making it attractive for families and couples. | Arue Beach, Vaipahi Gardens, Marina Taina, Remarkable views of Moorea, Local eateries |
| Papara | Known for its beautiful black sand beaches and laid-back atmosphere. Perfect for surfers and those seeking an authentic Polynesian experience. | Papara Beach, Sheltered lagoon, Surfing spots, Local craft shops, Cultural experiences |
| Faa'a | Home to Tahiti's international airport, Faa'a is a convenient location for travelers and offers easy access to nearby attractions. | Faa'a Beach, Airport proximity, Cultural center, Local markets, Scenic views |
| Punaauia | A scenic coastal area popular with tourists due to its beaches and proximity to attractions like the Museum of Tahiti. | Punaauia Beach, Museum of Tahiti and the Islands, Lagoon activities, Restaurants with views, Water sports |
| Mahina | A quieter area that offers beautiful natural scenery and is perfect for nature lovers and those looking for a peaceful stay. | Mahina Beach, Hiking trails, Stunning views of the mountains, Local markets, Polynesian culture |
| Teahupo'o | Famous for its world-class surfing waves, this area attracts surfers and adventure seekers from around the globe. | Teahupo'o Wave, Surfing schools, Scenic coastal routes, Local food stalls, Cultural experiences |
Understanding Airbnb License Requirements & STR Laws in Papeete (2025)
Yes, Papeete, French Polynesia, France enforces high STR regulations. Obtaining a license and ensuring compliance is almost certainly required according to current 2025 STR laws. Always verify the latest short term rental regulations and Airbnb license requirements directly with local government authorities for Papeete to ensure full compliance before hosting.
(Source: AirROI data, 2025, based on 83% licensed listings)
Top Performing Airbnb Properties in Papeete (2025)
Benchmark your potential! Explore examples of top-performing Airbnb properties in Papeetebased on Trailing Twelve Month (TTM) revenue. Analyze their characteristics, revenue, occupancy rate, and ADR to understand what drives success in this market.

Cabine privée flottante
Private Room • 2 bedrooms
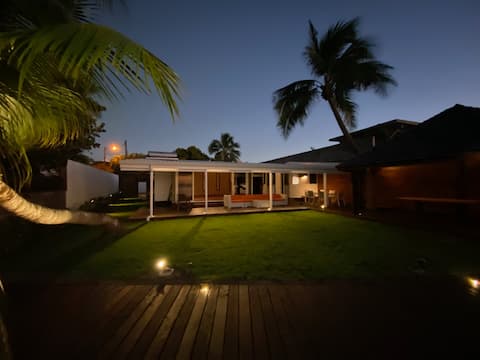
Taunoa House - Family seaside house in Papeete
Entire Place • 3 bedrooms
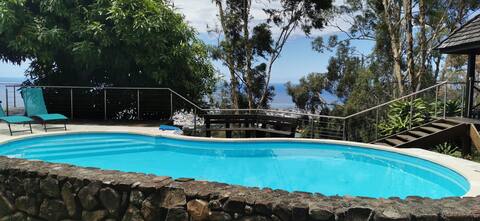
Tahiti Maison ZEN Hauteurs de Papeete
Entire Place • 4 bedrooms

The White Lotus Luxury Penthouse
Entire Place • 3 bedrooms
Heitea Lodge - 6 min airport,Fiber,AC & 2 Parkings
Entire Place • 3 bedrooms

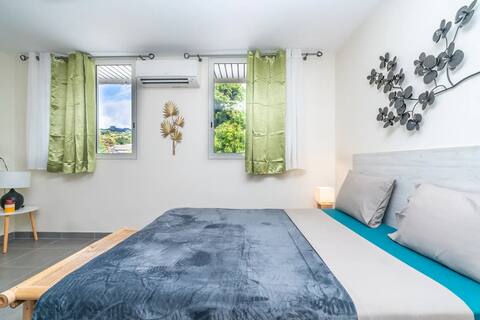
Raahere Lodge - near the city center
Entire Place • 2 bedrooms
Note: Performance varies based on location, size, amenities, seasonality, and management quality. Data reflects the past 12 months.
Top Performing Airbnb Hosts in Papeete (2025)
Learn from the best! This table showcases top-performing Airbnb hosts in Papeete based on the number of properties managed and estimated total revenue over the past year. Analyze their scale and performance metrics.
| Host Name | Properties | Grossing Revenue | Stay Reviews | Avg Rating |
|---|---|---|---|---|
| Roméo | 16 | $233,214 | 61 | 1.73/5.0 |
| Gaelle Tahiti Vip Services | 7 | $228,818 | 529 | 4.95/5.0 |
| Tamatea | 11 | $181,428 | 2301 | 4.78/5.0 |
| Tahiti Lodge Manager | 7 | $168,384 | 278 | 3.49/5.0 |
| Christophe | 8 | $117,814 | 94 | 3.52/5.0 |
| Martine | 3 | $98,548 | 96 | 4.86/5.0 |
| Pascal | 5 | $95,772 | 89 | 3.41/5.0 |
| Maeana | 7 | $91,934 | 911 | 4.69/5.0 |
| Host #12226877 | 1 | $85,215 | 0 | 0.00/5.0 |
| SARL Familiale Papeete Homesta | 5 | $74,598 | 202 | 4.82/5.0 |
Analyzing the strategies of top hosts, such as their property selection, pricing, and guest communication, can offer valuable lessons for optimizing your own Airbnb operations in Papeete.
Dive Deeper: Advanced Papeete STR Market Data (2025)
Ready to unlock more insights? AirROI provides access to advanced metrics and comprehensive Airbnb data for Papeete. Explore detailed analytics beyond this report to refine your investment strategy, optimize pricing, and maximize your vacation rental profits.
Explore Advanced MetricsPapeete Short-Term Rental Market Composition (2025): Property & Room Types
Room Type Distribution
Property Type Distribution
Market Composition Insights for Papeete
- The Papeete Airbnb market composition is heavily skewed towards Entire Home/Apt listings, which make up 86.3% of the 241 active rentals. This indicates strong guest preference for privacy and space.
- Looking at the property type distribution in Papeete, Apartment/Condo properties are the most common (80.1%), reflecting the local real estate landscape.
- The presence of 8.3% Hotel/Boutique listings indicates integration with traditional hospitality.
- Smaller segments like outdoor/unique, others, unique stays (combined 1.6%) offer potential for unique stay experiences.
Papeete Airbnb Room Capacity Analysis (2025): Bedroom Distribution
Distribution of Listings by Number of Bedrooms
Room Capacity Insights for Papeete
- The dominant room capacity in Papeete is 1 bedroom listings, making up 51.9% of the market. This suggests a strong demand for properties suitable for couples or solo travelers.
- Together, 1 bedroom and 2 bedrooms properties represent 68.9% of the active Airbnb listings in Papeete, indicating a high concentration in these sizes.
- With over half the market (51.9%) consisting of studios or 1-bedroom units, Papeete is particularly well-suited for individuals or couples.
- Listings with 3+ bedrooms (5.3%) represent a smaller niche, potentially indicating an underserved market for larger group accommodations in Papeete.
Papeete Vacation Rental Guest Capacity Trends (2025)
Distribution of Listings by Guest Capacity
Guest Capacity Insights for Papeete
- The most common guest capacity trend in Papeete vacation rentals is listings accommodating 4 guests (30.3%). This suggests the primary traveler segment is likely small families or groups.
- Properties designed for 4 guests and 2 guests dominate the Papeete STR market, accounting for 60.2% of listings.
- 10.8% of properties accommodate 6+ guests, serving the market segment for larger families or group travel in Papeete.
- On average, properties in Papeete are equipped to host 3.1 guests.
Papeete Airbnb Booking Patterns (2025): Available vs. Booked Days
Available Days Distribution
Booked Days Distribution
Booking Pattern Insights for Papeete
- The most common availability pattern in Papeete falls within the 271-366 days range, representing 32.4% of listings. This suggests many properties have significant open periods on their calendars.
- Approximately 61.9% of listings show high availability (181+ days open annually), indicating potential for increased bookings or specific owner usage patterns.
- For booked days, the 91-180 days range is most frequent in Papeete (31.1%), reflecting common guest stay durations or potential owner blocking patterns.
- A notable 39.0% of properties secure long booking periods (181+ days booked per year), highlighting successful long-term rental strategies or significant owner usage.
Papeete Airbnb Minimum Stay Requirements Analysis
Distribution of Listings by Minimum Night Requirement
1 Night
103 listings
45% of total
2 Nights
78 listings
34.1% of total
3 Nights
29 listings
12.7% of total
30+ Nights
19 listings
8.3% of total
Key Insights
- The most prevalent minimum stay requirement in Papeete is 1 Night, adopted by 45% of listings. This highlights the market's preference for shorter, flexible bookings.
- A strong majority (79.1%) of the Papeete Airbnb data shows acceptance of very short stays (1-2 nights), indicating a dynamic, high-turnover market.
Recommendations
- Align with the market by considering a 1 Night minimum stay, as 45% of Papeete hosts use this setting.
- Explore offering discounts for stays of 30+ nights to attract the 8.3% of the market seeking extended stays.
- Adjust minimum nights based on seasonality – potentially shorter during low season and longer during peak demand periods in Papeete.
Papeete Airbnb Cancellation Policy Trends Analysis (2025)
Super Strict 30 Days
4 listings
2% of total
Refundable
1 listings
0.5% of total
Flexible
92 listings
45.5% of total
Moderate
56 listings
27.7% of total
Firm
25 listings
12.4% of total
Strict
24 listings
11.9% of total
Cancellation Policy Insights for Papeete
- The prevailing Airbnb cancellation policy trend in Papeete is Flexible, used by 45.5% of listings.
- The market strongly favors guest-friendly terms, with 73.2% of listings offering Flexible or Moderate policies. This suggests guests in Papeete may expect booking flexibility.
Recommendations for Hosts
- Consider adopting a Flexible policy to align with the 45.5% market standard in Papeete.
- Using a Strict policy might deter some guests, as only 11.9% of listings use it. Evaluate if potential revenue protection outweighs possible lower booking rates.
- Regularly review your cancellation policy against competitors and market demand shifts in Papeete.
Papeete STR Booking Lead Time Analysis (2025)
Average Booking Lead Time by Month
Booking Lead Time Insights for Papeete
- The overall average booking lead time for vacation rentals in Papeete is 45 days.
- Guests book furthest in advance for stays during July (average 70 days), likely coinciding with peak travel demand or local events.
- The shortest booking windows occur for stays in December (average 38 days), indicating more last-minute travel plans during this time.
- Seasonally, Summer (64 days avg.) sees the longest lead times, while Winter (44 days avg.) has the shortest, reflecting typical travel planning cycles.
Recommendations for Hosts
- Use the overall average lead time (45 days) as a baseline for your pricing and availability strategy in Papeete.
- For July stays, consider implementing length-of-stay discounts or slightly higher rates for bookings made less than 70 days out to capitalize on advance planning.
- Target marketing efforts for the Summer season well in advance (at least 64 days) to capture early planners.
- Monitor your own booking lead times against these Papeete averages to identify opportunities for dynamic pricing adjustments.
Popular & Essential Airbnb Amenities in Papeete (2025)
Amenity Prevalence
Amenity Insights for Papeete
- Essential amenities in Papeete that guests expect include: Wifi. Lacking these (this) could significantly impact bookings.
- Popular amenities like TV, Kitchen, Air conditioning are common but not universal. Offering these can provide a competitive edge.
Recommendations for Hosts
- Ensure your listing includes all essential amenities for Papeete: Wifi.
- Prioritize adding missing essentials: Wifi.
- Consider adding popular differentiators like TV or Kitchen to increase appeal.
- Highlight unique or less common amenities you offer (e.g., hot tub, dedicated workspace, EV charger) in your listing description and photos.
- Regularly check competitor amenities in Papeete to stay competitive.
Papeete Airbnb Guest Demographics & Profile Analysis (2025)
Guest Profile Summary for Papeete
- The typical guest profile for Airbnb in Papeete consists of predominantly international visitors (70%), with top international origins including United States, typically belonging to the Post-2000s (Gen Z/Alpha) group (50%), primarily speaking English or French.
- Domestic travelers account for 30.5% of guests.
- Key international markets include France (30.5%) and United States (26.5%).
- Top languages spoken are English (42.4%) followed by French (30.8%).
- A significant demographic segment is the Post-2000s (Gen Z/Alpha) group, representing 50% of guests.
Recommendations for Hosts
- Focus marketing internationally, particularly towards travelers from United States.
- Tailor amenities and listing descriptions to appeal to the dominant Post-2000s (Gen Z/Alpha) demographic (e.g., highlight fast WiFi, smart home features, local guides).
- Highlight unique local experiences or amenities relevant to the primary guest profile.
- Consider seasonal promotions aligned with peak travel times for key origin markets.
Nearby Short-Term Rental Market Comparison
How does the Papeete Airbnb market stack up against its neighbors? Compare key performance metrics like average monthly revenue, ADR, and occupancy rates in surrounding areas to understand the broader regional STR landscape.
| Market | Active Properties | Monthly Revenue | Daily Rate | Avg. Occupancy |
|---|---|---|---|---|
| Moorea-Maiao | 580 | $3,415 | $247.46 | 49% |
| Pāʻea | 72 | $2,606 | $198.95 | 50% |
| Punaʻauiʻa | 300 | $2,424 | $205.07 | 48% |
| ʻĀrue | 47 | $2,146 | $170.53 | 52% |
| Papara | 36 | $1,649 | $210.49 | 29% |
| Faʻaʻā | 120 | $1,509 | $122.99 | 46% |
| Teva I Uta | 20 | $1,468 | $224.39 | 31% |
| Taiarapu-Est | 71 | $1,385 | $174.49 | 35% |
| Taiarapu-Ouest | 78 | $1,345 | $217.29 | 34% |
| Pīraʻe | 33 | $1,342 | $147.45 | 40% |