Papara Airbnb Market Analysis 2025: Short Term Rental Data & Vacation Rental Statistics in French Polynesia, France
Is Airbnb profitable in Papara in 2025? Explore comprehensive Airbnb analytics for Papara, French Polynesia, France to uncover income potential. This 2025 STR market report for Papara, based on AirROI data from April 2024 to March 2025, reveals key trends in the niche market of 36 active listings.
Whether you're considering an Airbnb investment in Papara, optimizing your existing vacation rental, or exploring rental arbitrage opportunities, understanding the Papara Airbnb data is crucial. Navigating the high regulation landscape is key to maximizing your short term rental income potential. Let's dive into the specifics.
Key Papara Airbnb Performance Metrics Overview
Monthly Airbnb Revenue Variations & Income Potential in Papara (2025)
Understanding the monthly revenue variations for Airbnb listings in Papara is key to maximizing your short term rental income potential. Seasonality significantly impacts earnings. Our analysis, based on data from the past 12 months, shows that the peak revenue month for STRs in Papara is typically June, while January often presents the lowest earnings, highlighting opportunities for strategic pricing adjustments during shoulder and low seasons. Explore the typical Airbnb income in Papara across different performance tiers:
- Best-in-class properties (Top 10%) achieve $5,546+ monthly, often utilizing dynamic pricing and superior guest experiences.
- Strong performing properties (Top 25%) earn $2,499 or more, indicating effective management and desirable locations/amenities.
- Typical properties (Median) generate around $1,233 per month, representing the average market performance.
- Entry-level properties (Bottom 25%) see earnings around $621, often with potential for optimization.
Average Monthly Airbnb Earnings Trend in Papara
Papara Airbnb Occupancy Rate Trends (2025)
Maximize your bookings by understanding the Papara STR occupancy trends. Seasonal demand shifts significantly influence how often properties are booked. Typically, Julysees the highest demand (peak season occupancy), while January experiences the lowest (low season). Effective strategies, like adjusting minimum stays or offering promotions, can boost occupancy during slower periods. Here's how different property tiers perform in Papara:
- Best-in-class properties (Top 10%) achieve 64%+ occupancy, indicating high desirability and potentially optimized availability.
- Strong performing properties (Top 25%) maintain 42% or higher occupancy, suggesting good market fit and guest satisfaction.
- Typical properties (Median) have an occupancy rate around 23%.
- Entry-level properties (Bottom 25%) average 13% occupancy, potentially facing higher vacancy.
Average Monthly Occupancy Rate Trend in Papara
Average Daily Rate (ADR) Airbnb Trends in Papara (2025)
Effective short term rental pricing strategy in Papara involves understanding monthly ADR fluctuations. The Average Daily Rate (ADR) for Airbnb in Papara typically peaks in February and dips lowest during September. Leveraging Airbnb dynamic pricing tools or strategies based on this seasonality can significantly boost revenue. Here's a look at the typical nightly rates achieved:
- Best-in-class properties (Top 10%) command rates of $342+ per night, often due to premium features or locations.
- Strong performing properties (Top 25%) achieve nightly rates of $214 or more.
- Typical properties (Median) charge around $141 per night.
- Entry-level properties (Bottom 25%) earn around $100 per night.
Average Daily Rate (ADR) Trend by Month in Papara
Get Live Papara Market Intelligence 👇

Explore Real-time Analytics
Airbnb Seasonality Analysis & Trends in Papara (2025)
Peak Season (June, May, April)
- Revenue averages $3,296 per month
- Occupancy rates average 30.1%
- Daily rates average $201
Shoulder Season
- Revenue averages $2,086 per month
- Occupancy maintains around 31.2%
- Daily rates hold near $207
Low Season (January, August, September)
- Revenue drops to average $1,475 per month
- Occupancy decreases to average 26.7%
- Daily rates adjust to average $204
Seasonality Insights for Papara
- The Airbnb seasonality in Papara shows highly seasonal trends requiring careful strategy. While the sections above show seasonal averages, it's also insightful to look at the extremes:
- During the high season, the absolute peak month showcases Papara's highest earning potential, with monthly revenues capable of climbing to $4,271, occupancy reaching a high of 38.6%, and ADRs peaking at $213.
- Conversely, the slowest single month of the year, typically falling within the low season, marks the market's lowest point. In this month, revenue might dip to $1,428, occupancy could drop to 20.4%, and ADRs may adjust down to $199.
- Understanding both the seasonal averages and these monthly peaks and troughs in revenue, occupancy, and ADR is crucial for maximizing your Airbnb profit potential in Papara.
Seasonal Strategies for Maximizing Profit
- Peak Season: Maximize revenue through premium pricing and potentially longer minimum stays. Ensure high availability.
- Low Season: Offer competitive pricing, special promotions (e.g., extended stay discounts), and flexible cancellation policies. Target off-season travelers like remote workers or budget-conscious guests.
- Shoulder Seasons: Implement dynamic pricing that balances peak and low rates. Target weekend travelers or specific events. Offer slightly more flexible terms than peak season.
- Regularly analyze your own performance against these Papara seasonality benchmarks and adjust your pricing and availability strategy accordingly.
Best Areas for Airbnb Investment in Papara (2025)
Exploring the top neighborhoods for short-term rentals in Papara? This section highlights key areas, outlining why they are attractive for hosts and guests, along with notable local attractions. Consider these locations based on your target guest profile and investment strategy.
| Neighborhood / Area | Why Host Here? (Target Guests & Appeal) | Key Attractions & Landmarks |
|---|---|---|
| Papara Beach | Beautiful coastal area known for its stunning beaches and clear waters. A perfect destination for tourists looking for relaxation and water activities. | Papara Beach, Surfing, Scuba Diving, Local Markets |
| Maraa Grotto | A unique natural attraction with crystal-clear water in a picturesque setting. Great for snorkelers and day-trippers. | Maraa Grotto, Natural Pools, Scenic Views |
| Mount Aorai | Offering breathtaking views and hiking opportunities, this area attracts those who enjoy nature and outdoor adventures. | Hiking Trails, Scenic Overlooks, Flora and Fauna |
| Teahupo'o | Famous for its big wave surfing, this location is a must-visit for surfers and nature enthusiasts. | Teahupo'o Surf Spot, Surfing Events, Surrounding beauty |
| Fa'a'ā | Close to the international airport, making it convenient for international travelers. Local markets and culture are highlights. | Markets, Cultural Festivals, Local Cuisine |
| Papeete | The capital city offers urban amenities, restaurants, and access to cultural landmarks. It's a hub for tourists. | Cultural Sites, Restaurants, Shopping Districts, Market |
| Punaauia | Known for beautiful beaches and family-friendly activities, it’s popular among families and beach goers. | Punaauia Beach, Water Sports, Local Dining |
| Bora Bora Day Tours | A popular destination for day trips and excursions, it attracts visitors to unique experiences and nature. | Island Hopping, Snorkeling Tours, Relaxing Beaches |
Understanding Airbnb License Requirements & STR Laws in Papara (2025)
Yes, Papara, French Polynesia, France enforces high STR regulations. Obtaining a license and ensuring compliance is almost certainly required according to current 2025 STR laws. Always verify the latest short term rental regulations and Airbnb license requirements directly with local government authorities for Papara to ensure full compliance before hosting.
(Source: AirROI data, 2025, based on 78% licensed listings)
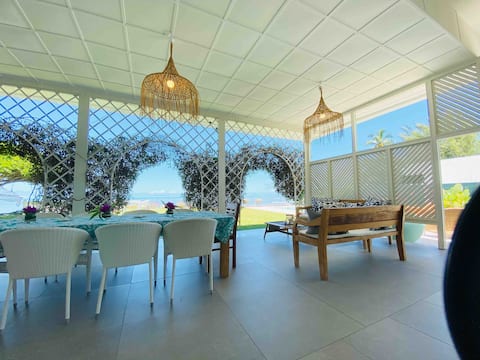
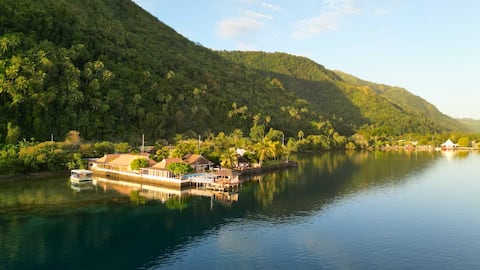
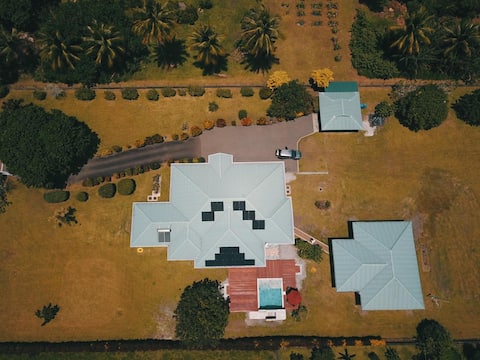
Top Performing Airbnb Properties in Papara (2025)
Benchmark your potential! Explore examples of top-performing Airbnb properties in Paparabased on Trailing Twelve Month (TTM) revenue. Analyze their characteristics, revenue, occupancy rate, and ADR to understand what drives success in this market.
Le Ficus: Large waterfront villa with pool
Entire Place • 4 bedrooms
Tahiti - Domaine Tiamao
Entire Place • 8 bedrooms
Paparadise
Entire Place • 4 bedrooms

Lagoon & Garden House w/ kayaks
Entire Place • 3 bedrooms
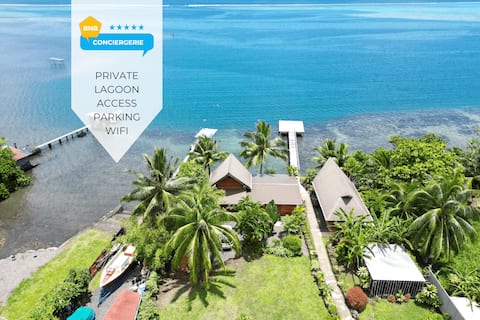
Private access to the lagoon, private dock, wifi, parking
Entire Place • 3 bedrooms
Fare Terii with its salt pool - PAPARA
Entire Place • 3 bedrooms
Note: Performance varies based on location, size, amenities, seasonality, and management quality. Data reflects the past 12 months.
Top Performing Airbnb Hosts in Papara (2025)
Learn from the best! This table showcases top-performing Airbnb hosts in Papara based on the number of properties managed and estimated total revenue over the past year. Analyze their scale and performance metrics.
| Host Name | Properties | Grossing Revenue | Stay Reviews | Avg Rating |
|---|---|---|---|---|
| Pascal | 6 | $187,949 | 27 | 2.71/5.0 |
| Christelle | 1 | $119,872 | 21 | 4.95/5.0 |
| Alain | 1 | $73,187 | 12 | 4.83/5.0 |
| Marie | 3 | $65,516 | 56 | 4.99/5.0 |
| Hina | 1 | $43,677 | 23 | 4.70/5.0 |
| Michaël | 1 | $38,170 | 17 | 4.47/5.0 |
| Lina-Denise | 1 | $35,240 | 44 | 4.95/5.0 |
| Melissa | 1 | $22,044 | 86 | 4.93/5.0 |
| Maheatea | 1 | $19,916 | 7 | 5.00/5.0 |
| Dom | 1 | $14,968 | 4 | 5.00/5.0 |
Analyzing the strategies of top hosts, such as their property selection, pricing, and guest communication, can offer valuable lessons for optimizing your own Airbnb operations in Papara.
Dive Deeper: Advanced Papara STR Market Data (2025)
Ready to unlock more insights? AirROI provides access to advanced metrics and comprehensive Airbnb data for Papara. Explore detailed analytics beyond this report to refine your investment strategy, optimize pricing, and maximize your vacation rental profits.
Explore Advanced MetricsPapara Short-Term Rental Market Composition (2025): Property & Room Types
Room Type Distribution
Property Type Distribution
Market Composition Insights for Papara
- The Papara Airbnb market composition is heavily skewed towards Entire Home/Apt listings, which make up 88.9% of the 36 active rentals. This indicates strong guest preference for privacy and space.
- Looking at the property type distribution in Papara, House properties are the most common (83.3%), reflecting the local real estate landscape.
- Houses represent a significant 83.3% portion, catering likely to families or larger groups.
- The presence of 13.9% Hotel/Boutique listings indicates integration with traditional hospitality.
- Smaller segments like others (combined 2.8%) offer potential for unique stay experiences.
Papara Airbnb Room Capacity Analysis (2025): Bedroom Distribution
Distribution of Listings by Number of Bedrooms
Room Capacity Insights for Papara
- The dominant room capacity in Papara is 1 bedroom listings, making up 47.2% of the market. This suggests a strong demand for properties suitable for couples or solo travelers.
- Together, 1 bedroom and 2 bedrooms properties represent 63.9% of the active Airbnb listings in Papara, indicating a high concentration in these sizes.
- A significant 30.6% of listings offer 3+ bedrooms, catering to larger groups and families seeking more space in Papara.
Papara Vacation Rental Guest Capacity Trends (2025)
Distribution of Listings by Guest Capacity
Guest Capacity Insights for Papara
- The most common guest capacity trend in Papara vacation rentals is listings accommodating 3 guests (30.6%). This suggests the primary traveler segment is likely small families or groups.
- Properties designed for 3 guests and 6 guests dominate the Papara STR market, accounting for 50.0% of listings.
- 38.8% of properties accommodate 6+ guests, serving the market segment for larger families or group travel in Papara.
- On average, properties in Papara are equipped to host 4.4 guests.
Papara Airbnb Booking Patterns (2025): Available vs. Booked Days
Available Days Distribution
Booked Days Distribution
Booking Pattern Insights for Papara
- The most common availability pattern in Papara falls within the 271-366 days range, representing 63.9% of listings. This suggests many properties have significant open periods on their calendars.
- Approximately 83.3% of listings show high availability (181+ days open annually), indicating potential for increased bookings or specific owner usage patterns.
- For booked days, the 31-90 days range is most frequent in Papara (41.7%), reflecting common guest stay durations or potential owner blocking patterns.
- A notable 16.7% of properties secure long booking periods (181+ days booked per year), highlighting successful long-term rental strategies or significant owner usage.
Papara Airbnb Minimum Stay Requirements Analysis
Distribution of Listings by Minimum Night Requirement
1 Night
7 listings
21.9% of total
2 Nights
17 listings
53.1% of total
3 Nights
3 listings
9.4% of total
4-6 Nights
1 listings
3.1% of total
30+ Nights
4 listings
12.5% of total
Key Insights
- The most prevalent minimum stay requirement in Papara is 2 Nights, adopted by 53.1% of listings. This highlights the market's preference for shorter, flexible bookings.
- A strong majority (75.0%) of the Papara Airbnb data shows acceptance of very short stays (1-2 nights), indicating a dynamic, high-turnover market.
- A significant segment (12.5%) caters to monthly stays (30+ nights) in Papara, pointing to opportunities in the extended-stay market.
Recommendations
- Align with the market by considering a 2 Nights minimum stay, as 53.1% of Papara hosts use this setting.
- If feasible, allowing 1-night stays, especially midweek or during low season, could capture last-minute bookings, as only 21.9% currently do.
- Explore offering discounts for stays of 30+ nights to attract the 12.5% of the market seeking extended stays.
- Adjust minimum nights based on seasonality – potentially shorter during low season and longer during peak demand periods in Papara.
Papara Airbnb Cancellation Policy Trends Analysis (2025)
Super Strict 30 Days
4 listings
13.8% of total
Flexible
12 listings
41.4% of total
Moderate
7 listings
24.1% of total
Firm
2 listings
6.9% of total
Strict
4 listings
13.8% of total
Cancellation Policy Insights for Papara
- The prevailing Airbnb cancellation policy trend in Papara is Flexible, used by 41.4% of listings.
- There's a relatively balanced mix between guest-friendly (65.5%) and stricter (20.7%) policies, offering choices for different guest needs.
Recommendations for Hosts
- Consider adopting a Flexible policy to align with the 41.4% market standard in Papara.
- Using a Strict policy might deter some guests, as only 13.8% of listings use it. Evaluate if potential revenue protection outweighs possible lower booking rates.
- Regularly review your cancellation policy against competitors and market demand shifts in Papara.
Papara STR Booking Lead Time Analysis (2025)
Average Booking Lead Time by Month
Booking Lead Time Insights for Papara
- The overall average booking lead time for vacation rentals in Papara is 62 days.
- Guests book furthest in advance for stays during October (average 107 days), likely coinciding with peak travel demand or local events.
- The shortest booking windows occur for stays in June (average 32 days), indicating more last-minute travel plans during this time.
- Seasonally, Spring (96 days avg.) sees the longest lead times, while Winter (55 days avg.) has the shortest, reflecting typical travel planning cycles.
Recommendations for Hosts
- Use the overall average lead time (62 days) as a baseline for your pricing and availability strategy in Papara.
- For October stays, consider implementing length-of-stay discounts or slightly higher rates for bookings made less than 107 days out to capitalize on advance planning.
- Target marketing efforts for the Spring season well in advance (at least 96 days) to capture early planners.
- Monitor your own booking lead times against these Papara averages to identify opportunities for dynamic pricing adjustments.
Popular & Essential Airbnb Amenities in Papara (2025)
Amenity Prevalence
Amenity Insights for Papara
- Popular amenities like Wifi, Free parking on premises, Washer are common but not universal. Offering these can provide a competitive edge.
- Warning: Wifi is not universally provided but is considered essential globally. Ensure reliable Wifi is offered.
Recommendations for Hosts
- Consider adding popular differentiators like Wifi or Free parking on premises to increase appeal.
- Highlight unique or less common amenities you offer (e.g., hot tub, dedicated workspace, EV charger) in your listing description and photos.
- Regularly check competitor amenities in Papara to stay competitive.
Papara Airbnb Guest Demographics & Profile Analysis (2025)
Guest Profile Summary for Papara
- The typical guest profile for Airbnb in Papara consists of predominantly international visitors (69%), with top international origins including France, typically belonging to the Post-2000s (Gen Z/Alpha) group (50%), primarily speaking English or French.
- Domestic travelers account for 31.5% of guests.
- Key international markets include United States (35.4%) and France (31.5%).
- Top languages spoken are English (43.8%) followed by French (26.5%).
- A significant demographic segment is the Post-2000s (Gen Z/Alpha) group, representing 50% of guests.
Recommendations for Hosts
- Focus marketing internationally, particularly towards travelers from France.
- Tailor amenities and listing descriptions to appeal to the dominant Post-2000s (Gen Z/Alpha) demographic (e.g., highlight fast WiFi, smart home features, local guides).
- Highlight unique local experiences or amenities relevant to the primary guest profile.
- Consider seasonal promotions aligned with peak travel times for key origin markets.
Nearby Short-Term Rental Market Comparison
How does the Papara Airbnb market stack up against its neighbors? Compare key performance metrics like average monthly revenue, ADR, and occupancy rates in surrounding areas to understand the broader regional STR landscape.
| Market | Active Properties | Monthly Revenue | Daily Rate | Avg. Occupancy |
|---|---|---|---|---|
| Moorea-Maiao | 580 | $3,415 | $247.46 | 49% |
| Pāʻea | 72 | $2,606 | $198.95 | 50% |
| Punaʻauiʻa | 300 | $2,424 | $205.07 | 48% |
| ʻĀrue | 47 | $2,146 | $170.53 | 52% |
| Faʻaʻā | 120 | $1,509 | $122.99 | 46% |
| Papeete | 241 | $1,502 | $132.20 | 47% |
| Teva I Uta | 20 | $1,468 | $224.39 | 31% |
| Taiarapu-Est | 71 | $1,385 | $174.49 | 35% |
| Taiarapu-Ouest | 78 | $1,345 | $217.29 | 34% |
| Pīraʻe | 33 | $1,342 | $147.45 | 40% |