Maupiti Airbnb Market Analysis 2025: Short Term Rental Data & Vacation Rental Statistics in French Polynesia, France
Is Airbnb profitable in Maupiti in 2025? Explore comprehensive Airbnb analytics for Maupiti, French Polynesia, France to uncover income potential. This 2025 STR market report for Maupiti, based on AirROI data from April 2024 to March 2025, reveals key trends in the niche market of 21 active listings.
Whether you're considering an Airbnb investment in Maupiti, optimizing your existing vacation rental, or exploring rental arbitrage opportunities, understanding the Maupiti Airbnb data is crucial. Navigating the high regulation landscape is key to maximizing your short term rental income potential. Let's dive into the specifics.
Key Maupiti Airbnb Performance Metrics Overview
Monthly Airbnb Revenue Variations & Income Potential in Maupiti (2025)
Understanding the monthly revenue variations for Airbnb listings in Maupiti is key to maximizing your short term rental income potential. Seasonality significantly impacts earnings. Our analysis, based on data from the past 12 months, shows that the peak revenue month for STRs in Maupiti is typically May, while February often presents the lowest earnings, highlighting opportunities for strategic pricing adjustments during shoulder and low seasons. Explore the typical Airbnb income in Maupiti across different performance tiers:
- Best-in-class properties (Top 10%) achieve $2,704+ monthly, often utilizing dynamic pricing and superior guest experiences.
- Strong performing properties (Top 25%) earn $2,170 or more, indicating effective management and desirable locations/amenities.
- Typical properties (Median) generate around $1,668 per month, representing the average market performance.
- Entry-level properties (Bottom 25%) see earnings around $904, often with potential for optimization.
Average Monthly Airbnb Earnings Trend in Maupiti
Maupiti Airbnb Occupancy Rate Trends (2025)
Maximize your bookings by understanding the Maupiti STR occupancy trends. Seasonal demand shifts significantly influence how often properties are booked. Typically, Julysees the highest demand (peak season occupancy), while February experiences the lowest (low season). Effective strategies, like adjusting minimum stays or offering promotions, can boost occupancy during slower periods. Here's how different property tiers perform in Maupiti:
- Best-in-class properties (Top 10%) achieve 84%+ occupancy, indicating high desirability and potentially optimized availability.
- Strong performing properties (Top 25%) maintain 74% or higher occupancy, suggesting good market fit and guest satisfaction.
- Typical properties (Median) have an occupancy rate around 55%.
- Entry-level properties (Bottom 25%) average 39% occupancy, potentially facing higher vacancy.
Average Monthly Occupancy Rate Trend in Maupiti
Average Daily Rate (ADR) Airbnb Trends in Maupiti (2025)
Effective short term rental pricing strategy in Maupiti involves understanding monthly ADR fluctuations. The Average Daily Rate (ADR) for Airbnb in Maupiti typically peaks in December and dips lowest during September. Leveraging Airbnb dynamic pricing tools or strategies based on this seasonality can significantly boost revenue. Here's a look at the typical nightly rates achieved:
- Best-in-class properties (Top 10%) command rates of $142+ per night, often due to premium features or locations.
- Strong performing properties (Top 25%) achieve nightly rates of $100 or more.
- Typical properties (Median) charge around $90 per night.
- Entry-level properties (Bottom 25%) earn around $68 per night.
Average Daily Rate (ADR) Trend by Month in Maupiti
Get Live Maupiti Market Intelligence 👇

Explore Real-time Analytics
Airbnb Seasonality Analysis & Trends in Maupiti (2025)
Peak Season (May, July, June)
- Revenue averages $2,141 per month
- Occupancy rates average 59.9%
- Daily rates average $94
Shoulder Season
- Revenue averages $1,823 per month
- Occupancy maintains around 60.4%
- Daily rates hold near $94
Low Season (January, February, March)
- Revenue drops to average $1,113 per month
- Occupancy decreases to average 40.8%
- Daily rates adjust to average $95
Seasonality Insights for Maupiti
- The Airbnb seasonality in Maupiti shows highly seasonal trends requiring careful strategy. While the sections above show seasonal averages, it's also insightful to look at the extremes:
- During the high season, the absolute peak month showcases Maupiti's highest earning potential, with monthly revenues capable of climbing to $2,188, occupancy reaching a high of 69.9%, and ADRs peaking at $99.
- Conversely, the slowest single month of the year, typically falling within the low season, marks the market's lowest point. In this month, revenue might dip to $937, occupancy could drop to 36.8%, and ADRs may adjust down to $91.
- Understanding both the seasonal averages and these monthly peaks and troughs in revenue, occupancy, and ADR is crucial for maximizing your Airbnb profit potential in Maupiti.
Seasonal Strategies for Maximizing Profit
- Peak Season: Maximize revenue through premium pricing and potentially longer minimum stays. Ensure high availability.
- Low Season: Offer competitive pricing, special promotions (e.g., extended stay discounts), and flexible cancellation policies. Target off-season travelers like remote workers or budget-conscious guests.
- Shoulder Seasons: Implement dynamic pricing that balances peak and low rates. Target weekend travelers or specific events. Offer slightly more flexible terms than peak season.
- Regularly analyze your own performance against these Maupiti seasonality benchmarks and adjust your pricing and availability strategy accordingly.
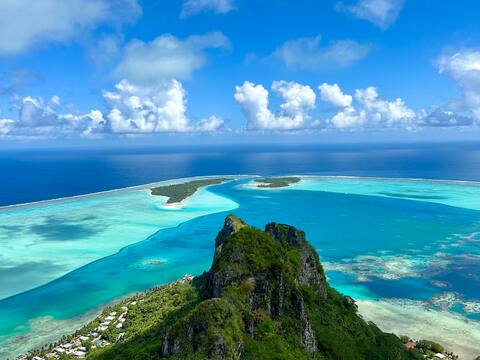
Best Areas for Airbnb Investment in Maupiti (2025)
Exploring the top neighborhoods for short-term rentals in Maupiti? This section highlights key areas, outlining why they are attractive for hosts and guests, along with notable local attractions. Consider these locations based on your target guest profile and investment strategy.
| Neighborhood / Area | Why Host Here? (Target Guests & Appeal) | Key Attractions & Landmarks |
|---|---|---|
| Anau | A picturesque village known for its beautiful lagoon views and serene atmosphere. An ideal spot for tourists looking to enjoy the natural beauty of Maupiti and engage in water activities. | Maupiti Lagoon, Snorkeling spots, Local markets, Cultural experiences, Beaches |
| Maupiti Airport Area | The area around the airport offers easy access for travelers arriving and departing. It serves as a convenient base for exploring the island. | Maupiti Airport, Easy access to rental transportation, Proximity to local shops, Starting point for island tours |
| Piti Aau | A beautiful area renowned for its sandy beaches and crystal-clear waters. It attracts visitors looking for a relaxing beach getaway. | Piti Aau Beach, Lagoon excursions, Scenic views, Local food vendors |
| Orovaru | A charming part of the island that provides a glimpse into the local way of life and offers less touristy experiences. | Cultural immersion, Traditional Polynesian homes, Local craftsmanship, Small beaches |
| Maupiti Village | The main village on the island, offering a slice of local life, restaurants, and shops. Great for those wanting to experience the daily rhythm of the island. | Local eateries, Shopping streets, Cultural events, Village life |
| Tevai | Known for its stunning sunset views and quieter atmosphere. It’s perfect for romantic getaways and couples seeking tranquility. | Sunset views, Secluded beaches, Tranquil environment |
| Maupiti's East Coast | This area is less developed and offers authentic experiences with beautiful landscapes. Great for eco-tourists and adventure seekers. | Hiking trails, Natural landscapes, Secluded spots, Wildlife watching |
| Maupiti North | Known for its serene beaches and excellent snorkeling. A popular choice for families and groups looking for fun in the sun. | Snorkeling spots, Family-friendly beaches, Water activities |
Understanding Airbnb License Requirements & STR Laws in Maupiti (2025)
Yes, Maupiti, French Polynesia, France enforces high STR regulations. Obtaining a license and ensuring compliance is almost certainly required according to current 2025 STR laws. Always verify the latest short term rental regulations and Airbnb license requirements directly with local government authorities for Maupiti to ensure full compliance before hosting.
(Source: AirROI data, 2025, based on 100% licensed listings)
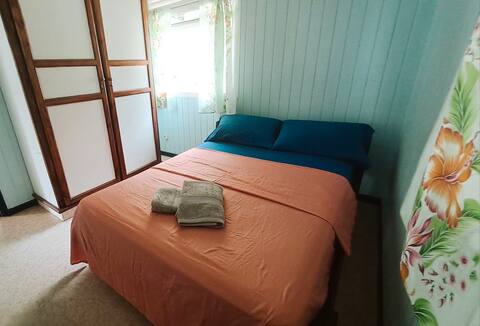
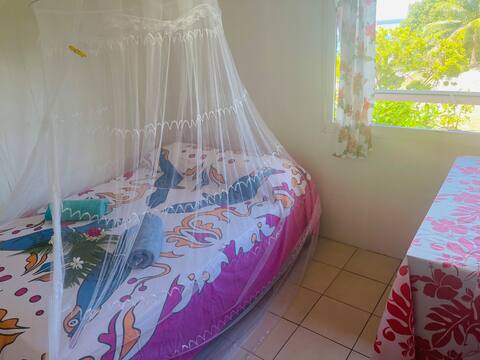
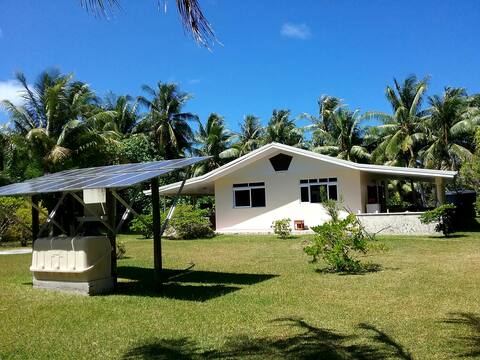
Top Performing Airbnb Properties in Maupiti (2025)
Benchmark your potential! Explore examples of top-performing Airbnb properties in Maupitibased on Trailing Twelve Month (TTM) revenue. Analyze their characteristics, revenue, occupancy rate, and ADR to understand what drives success in this market.

Fare Tai'a : 6 guests
Entire Place • 2 bedrooms
Fare Tai'a: Nanue Room
Private Room • N/A
Tuaera Lodge !
Private Room • N/A

Vaiatea & Heihau RBNB 2
Private Room • N/A
MAUPITI Island Farehau
Entire Place • 2 bedrooms
Enjoy your stay in Aarifara
Private Room • 2 bedrooms
Note: Performance varies based on location, size, amenities, seasonality, and management quality. Data reflects the past 12 months.
Top Performing Airbnb Hosts in Maupiti (2025)
Learn from the best! This table showcases top-performing Airbnb hosts in Maupiti based on the number of properties managed and estimated total revenue over the past year. Analyze their scale and performance metrics.
| Host Name | Properties | Grossing Revenue | Stay Reviews | Avg Rating |
|---|---|---|---|---|
| Mohea | 4 | $117,456 | 39 | 4.82/5.0 |
| Ange | 3 | $67,419 | 208 | 4.86/5.0 |
| Taupe | 4 | $53,198 | 180 | 4.65/5.0 |
| Alison | 2 | $48,043 | 91 | 4.66/5.0 |
| Nahei | 2 | $33,806 | 11 | 4.65/5.0 |
| Yolande Manutahi | 1 | $24,175 | 93 | 4.59/5.0 |
| Olivia | 1 | $23,826 | 106 | 4.74/5.0 |
| Francoise | 1 | $20,304 | 34 | 4.88/5.0 |
| Mihiarii | 2 | $17,543 | 18 | 4.92/5.0 |
| Blue | 1 | $7,663 | 3 | 3.67/5.0 |
Analyzing the strategies of top hosts, such as their property selection, pricing, and guest communication, can offer valuable lessons for optimizing your own Airbnb operations in Maupiti.
Dive Deeper: Advanced Maupiti STR Market Data (2025)
Ready to unlock more insights? AirROI provides access to advanced metrics and comprehensive Airbnb data for Maupiti. Explore detailed analytics beyond this report to refine your investment strategy, optimize pricing, and maximize your vacation rental profits.
Explore Advanced MetricsMaupiti Short-Term Rental Market Composition (2025): Property & Room Types
Room Type Distribution
Property Type Distribution
Market Composition Insights for Maupiti
- The Maupiti Airbnb market composition is heavily skewed towards Private Room listings, which make up 81% of the 21 active rentals. This indicates strong guest preference for privacy and space.
- Looking at the property type distribution in Maupiti, Hotel/Boutique properties are the most common (52.4%), reflecting the local real estate landscape.
- Houses represent a significant 23.8% portion, catering likely to families or larger groups.
- The presence of 52.4% Hotel/Boutique listings indicates integration with traditional hospitality.
Maupiti Airbnb Room Capacity Analysis (2025): Bedroom Distribution
Distribution of Listings by Number of Bedrooms
Room Capacity Insights for Maupiti
- The dominant room capacity in Maupiti is 1 bedroom listings, making up 33.3% of the market. This suggests a strong demand for properties suitable for couples or solo travelers.
- Together, 1 bedroom and 2 bedrooms properties represent 52.3% of the active Airbnb listings in Maupiti, indicating a high concentration in these sizes.
- Listings with 3+ bedrooms (4.8%) represent a smaller niche, potentially indicating an underserved market for larger group accommodations in Maupiti.
Maupiti Vacation Rental Guest Capacity Trends (2025)
Distribution of Listings by Guest Capacity
Guest Capacity Insights for Maupiti
- The most common guest capacity trend in Maupiti vacation rentals is listings accommodating 2 guests (23.8%). This suggests the primary traveler segment is likely couples or solo travelers.
- Properties designed for 2 guests and 6 guests dominate the Maupiti STR market, accounting for 33.3% of listings.
- 14.3% of properties accommodate 6+ guests, serving the market segment for larger families or group travel in Maupiti.
- On average, properties in Maupiti are equipped to host 1.8 guests.
Maupiti Airbnb Booking Patterns (2025): Available vs. Booked Days
Available Days Distribution
Booked Days Distribution
Booking Pattern Insights for Maupiti
- The most common availability pattern in Maupiti falls within the 91-180 days range, representing 71.4% of listings. This suggests many properties have significant open periods on their calendars.
- Approximately 19.1% of listings show high availability (181+ days open annually), indicating potential for increased bookings or specific owner usage patterns.
- For booked days, the 181-270 days range is most frequent in Maupiti (66.7%), reflecting common guest stay durations or potential owner blocking patterns.
- A notable 81.0% of properties secure long booking periods (181+ days booked per year), highlighting successful long-term rental strategies or significant owner usage.
Maupiti Airbnb Minimum Stay Requirements Analysis
Distribution of Listings by Minimum Night Requirement
1 Night
5 listings
23.8% of total
2 Nights
14 listings
66.7% of total
30+ Nights
2 listings
9.5% of total
Key Insights
- The most prevalent minimum stay requirement in Maupiti is 2 Nights, adopted by 66.7% of listings. This highlights the market's preference for shorter, flexible bookings.
- A strong majority (90.5%) of the Maupiti Airbnb data shows acceptance of very short stays (1-2 nights), indicating a dynamic, high-turnover market.
Recommendations
- Align with the market by considering a 2 Nights minimum stay, as 66.7% of Maupiti hosts use this setting.
- If feasible, allowing 1-night stays, especially midweek or during low season, could capture last-minute bookings, as only 23.8% currently do.
- Explore offering discounts for stays of 30+ nights to attract the 9.5% of the market seeking extended stays.
- Adjust minimum nights based on seasonality – potentially shorter during low season and longer during peak demand periods in Maupiti.
Maupiti Airbnb Cancellation Policy Trends Analysis (2025)
Flexible
9 listings
42.9% of total
Moderate
5 listings
23.8% of total
Firm
1 listings
4.8% of total
Strict
6 listings
28.6% of total
Cancellation Policy Insights for Maupiti
- The prevailing Airbnb cancellation policy trend in Maupiti is Flexible, used by 42.9% of listings.
- There's a relatively balanced mix between guest-friendly (66.7%) and stricter (33.4%) policies, offering choices for different guest needs.
Recommendations for Hosts
- Consider adopting a Flexible policy to align with the 42.9% market standard in Maupiti.
- Regularly review your cancellation policy against competitors and market demand shifts in Maupiti.
Maupiti STR Booking Lead Time Analysis (2025)
Average Booking Lead Time by Month
Booking Lead Time Insights for Maupiti
- The overall average booking lead time for vacation rentals in Maupiti is 71 days.
- Guests book furthest in advance for stays during July (average 166 days), likely coinciding with peak travel demand or local events.
- The shortest booking windows occur for stays in February (average 40 days), indicating more last-minute travel plans during this time.
- Seasonally, Summer (123 days avg.) sees the longest lead times, while Winter (60 days avg.) has the shortest, reflecting typical travel planning cycles.
Recommendations for Hosts
- Use the overall average lead time (71 days) as a baseline for your pricing and availability strategy in Maupiti.
- For July stays, consider implementing length-of-stay discounts or slightly higher rates for bookings made less than 166 days out to capitalize on advance planning.
- Target marketing efforts for the Summer season well in advance (at least 123 days) to capture early planners.
- Monitor your own booking lead times against these Maupiti averages to identify opportunities for dynamic pricing adjustments.
Popular & Essential Airbnb Amenities in Maupiti (2025)
Amenity Prevalence
Amenity Insights for Maupiti
- Popular amenities like Kitchen, Wifi, Beach access are common but not universal. Offering these can provide a competitive edge.
- Warning: Wifi is not universally provided but is considered essential globally. Ensure reliable Wifi is offered.
Recommendations for Hosts
- Consider adding popular differentiators like Kitchen or Wifi to increase appeal.
- Highlight unique or less common amenities you offer (e.g., hot tub, dedicated workspace, EV charger) in your listing description and photos.
- Regularly check competitor amenities in Maupiti to stay competitive.
Maupiti Airbnb Guest Demographics & Profile Analysis (2025)
Guest Profile Summary for Maupiti
- The typical guest profile for Airbnb in Maupiti consists of primarily domestic travelers (76%), often arriving from nearby Paris, typically belonging to the Post-2000s (Gen Z/Alpha) group (50%), primarily speaking French or English.
- Domestic travelers account for 75.6% of guests.
- Key international markets include France (75.6%) and United States (4.7%).
- Top languages spoken are French (39.4%) followed by English (36.4%).
- A significant demographic segment is the Post-2000s (Gen Z/Alpha) group, representing 50% of guests.
Recommendations for Hosts
- Target domestic marketing efforts towards travelers from Paris and Toulouse.
- Tailor amenities and listing descriptions to appeal to the dominant Post-2000s (Gen Z/Alpha) demographic (e.g., highlight fast WiFi, smart home features, local guides).
- Highlight unique local experiences or amenities relevant to the primary guest profile.
- Consider seasonal promotions aligned with peak travel times for key origin markets.
Nearby Short-Term Rental Market Comparison
How does the Maupiti Airbnb market stack up against its neighbors? Compare key performance metrics like average monthly revenue, ADR, and occupancy rates in surrounding areas to understand the broader regional STR landscape.