Venzolasca Airbnb Market Analysis 2025: Short Term Rental Data & Vacation Rental Statistics in Corsica, France
Is Airbnb profitable in Venzolasca in 2025? Explore comprehensive Airbnb analytics for Venzolasca, Corsica, France to uncover income potential. This 2025 STR market report for Venzolasca, based on AirROI data from April 2024 to March 2025, reveals key trends in the niche market of 28 active listings.
Whether you're considering an Airbnb investment in Venzolasca, optimizing your existing vacation rental, or exploring rental arbitrage opportunities, understanding the Venzolasca Airbnb data is crucial. Leveraging the low regulation environment is key to maximizing your short term rental income potential. Let's dive into the specifics.
Key Venzolasca Airbnb Performance Metrics Overview
Monthly Airbnb Revenue Variations & Income Potential in Venzolasca (2025)
Understanding the monthly revenue variations for Airbnb listings in Venzolasca is key to maximizing your short term rental income potential. Seasonality significantly impacts earnings. Our analysis, based on data from the past 12 months, shows that the peak revenue month for STRs in Venzolasca is typically July, while February often presents the lowest earnings, highlighting opportunities for strategic pricing adjustments during shoulder and low seasons. Explore the typical Airbnb income in Venzolasca across different performance tiers:
- Best-in-class properties (Top 10%) achieve $2,622+ monthly, often utilizing dynamic pricing and superior guest experiences.
- Strong performing properties (Top 25%) earn $1,797 or more, indicating effective management and desirable locations/amenities.
- Typical properties (Median) generate around $1,070 per month, representing the average market performance.
- Entry-level properties (Bottom 25%) see earnings around $647, often with potential for optimization.
Average Monthly Airbnb Earnings Trend in Venzolasca
Venzolasca Airbnb Occupancy Rate Trends (2025)
Maximize your bookings by understanding the Venzolasca STR occupancy trends. Seasonal demand shifts significantly influence how often properties are booked. Typically, Augustsees the highest demand (peak season occupancy), while March experiences the lowest (low season). Effective strategies, like adjusting minimum stays or offering promotions, can boost occupancy during slower periods. Here's how different property tiers perform in Venzolasca:
- Best-in-class properties (Top 10%) achieve 79%+ occupancy, indicating high desirability and potentially optimized availability.
- Strong performing properties (Top 25%) maintain 53% or higher occupancy, suggesting good market fit and guest satisfaction.
- Typical properties (Median) have an occupancy rate around 36%.
- Entry-level properties (Bottom 25%) average 22% occupancy, potentially facing higher vacancy.
Average Monthly Occupancy Rate Trend in Venzolasca
Average Daily Rate (ADR) Airbnb Trends in Venzolasca (2025)
Effective short term rental pricing strategy in Venzolasca involves understanding monthly ADR fluctuations. The Average Daily Rate (ADR) for Airbnb in Venzolasca typically peaks in July and dips lowest during November. Leveraging Airbnb dynamic pricing tools or strategies based on this seasonality can significantly boost revenue. Here's a look at the typical nightly rates achieved:
- Best-in-class properties (Top 10%) command rates of $216+ per night, often due to premium features or locations.
- Strong performing properties (Top 25%) achieve nightly rates of $123 or more.
- Typical properties (Median) charge around $89 per night.
- Entry-level properties (Bottom 25%) earn around $67 per night.
Average Daily Rate (ADR) Trend by Month in Venzolasca
Get Live Venzolasca Market Intelligence 👇

Explore Real-time Analytics
Airbnb Seasonality Analysis & Trends in Venzolasca (2025)
Peak Season (July, August, May)
- Revenue averages $2,278 per month
- Occupancy rates average 54.2%
- Daily rates average $141
Shoulder Season
- Revenue averages $1,220 per month
- Occupancy maintains around 39.4%
- Daily rates hold near $119
Low Season (February, March, December)
- Revenue drops to average $505 per month
- Occupancy decreases to average 25.3%
- Daily rates adjust to average $87
Seasonality Insights for Venzolasca
- The Airbnb seasonality in Venzolasca shows highly seasonal trends requiring careful strategy. While the sections above show seasonal averages, it's also insightful to look at the extremes:
- During the high season, the absolute peak month showcases Venzolasca's highest earning potential, with monthly revenues capable of climbing to $2,422, occupancy reaching a high of 63.5%, and ADRs peaking at $143.
- Conversely, the slowest single month of the year, typically falling within the low season, marks the market's lowest point. In this month, revenue might dip to $452, occupancy could drop to 24.5%, and ADRs may adjust down to $84.
- Understanding both the seasonal averages and these monthly peaks and troughs in revenue, occupancy, and ADR is crucial for maximizing your Airbnb profit potential in Venzolasca.
Seasonal Strategies for Maximizing Profit
- Peak Season: Maximize revenue through premium pricing and potentially longer minimum stays. Ensure high availability.
- Low Season: Offer competitive pricing, special promotions (e.g., extended stay discounts), and flexible cancellation policies. Target off-season travelers like remote workers or budget-conscious guests.
- Shoulder Seasons: Implement dynamic pricing that balances peak and low rates. Target weekend travelers or specific events. Offer slightly more flexible terms than peak season.
- Regularly analyze your own performance against these Venzolasca seasonality benchmarks and adjust your pricing and availability strategy accordingly.
Best Areas for Airbnb Investment in Venzolasca (2025)
Exploring the top neighborhoods for short-term rentals in Venzolasca? This section highlights key areas, outlining why they are attractive for hosts and guests, along with notable local attractions. Consider these locations based on your target guest profile and investment strategy.
| Neighborhood / Area | Why Host Here? (Target Guests & Appeal) | Key Attractions & Landmarks |
|---|---|---|
| Venzolasca Beach | A serene coastal area with beautiful beaches and stunning views of the Mediterranean. Attracts visitors looking for relaxation and nature, perfect for beach lovers and outdoor enthusiasts. | Plage de Venzolasca, Scenic coastal trails, Local seafood restaurants, Water sports activities, Nearby hiking trails |
| Venzolasca Village | Quaint village atmosphere with traditional Corsican architecture and charm. Ideal for tourists interested in culture, history, and experiencing local life. | Historical sites, Local markets, Corsican cuisine restaurants, Church of San Giovanni, Nearby vineyards |
| Erbalunga | Charming fishing village known for its picturesque harbor and unique beauty. It's a perfect spot for those looking to enjoy a romantic getaway or artistic retreat. | Erbalunga Harbor, Art galleries, Local cafes and shops, Beautiful coastal walks, Splash in the nearby coves |
| Patrimonio | Famous for its vineyards and wine production, this area draws visitors looking to taste Corsican wines and enjoy scenic vineyard views. | Wine tours, Local vineyards, Corsican gastronomy, Beautiful sunset views, Historic sites |
| Cap Corse | The northern peninsula known for its stunning landscapes, hiking opportunities, and secluded beaches. Ideal for nature lovers and adventure seekers. | Hiking trails, Scenic viewpoints, Isolated beaches, Traditional villages, Local seafood markets |
| Saint-Florent | A small coastal town that is a gateway to the famous desert des Agriates sand dune area. It attracts beachgoers and boaters alike. | Saint-Florent beach, Local boutiques, Marina with boat rentals, Desert des Agriates, Historical sites |
| Nonza | Perched above the sea, this village offers breathtaking views and a glimpse into Corsican history. It's perfect for those looking for a peaceful retreat. | Nonza beach, Historical ruins, Scenic walks, Local nature hikes, Traditional Corsican architecture |
Understanding Airbnb License Requirements & STR Laws in Venzolasca (2025)
While Venzolasca, Corsica, France currently shows low STR regulations, specific Airbnb license requirements might still exist or change. Always verify the latest short term rental regulations and Airbnb license requirements directly with local government authorities for Venzolasca to ensure full compliance before hosting.
(Source: AirROI data, 2025, finding no licensed listings among those analyzed)
Top Performing Airbnb Properties in Venzolasca (2025)
Benchmark your potential! Explore examples of top-performing Airbnb properties in Venzolascabased on Trailing Twelve Month (TTM) revenue. Analyze their characteristics, revenue, occupancy rate, and ADR to understand what drives success in this market.
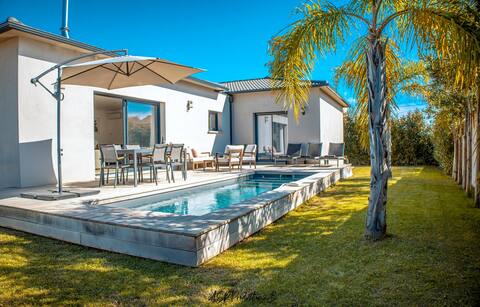
New villa with a pool and all comforts
Entire Place • 3 bedrooms
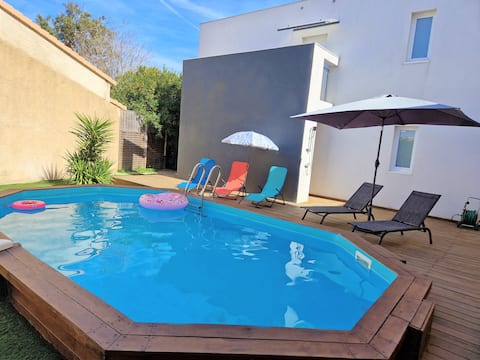
Bas de villa piscine terrasse proche de la plage
Entire Place • 2 bedrooms
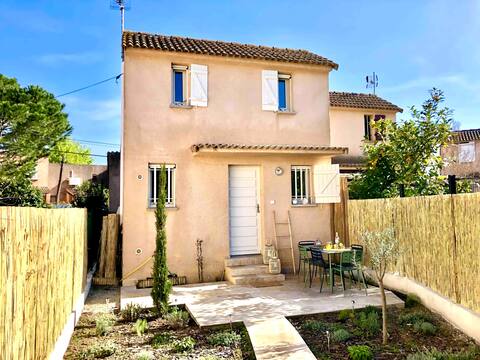
Mini Villa Venzolasca Beach
Entire Place • 2 bedrooms
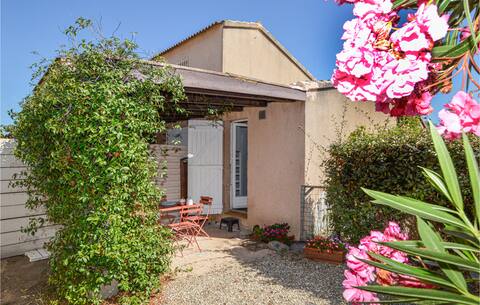
Nice home in venzolasca with kitchen
Entire Place • 1 bedroom
Villa low apartment with terrace and garden
Entire Place • 1 bedroom
Studio 5 min to the beach - 4 pers"A Casa Liccia"
Entire Place • 1 bedroom
Note: Performance varies based on location, size, amenities, seasonality, and management quality. Data reflects the past 12 months.
Top Performing Airbnb Hosts in Venzolasca (2025)
Learn from the best! This table showcases top-performing Airbnb hosts in Venzolasca based on the number of properties managed and estimated total revenue over the past year. Analyze their scale and performance metrics.
| Host Name | Properties | Grossing Revenue | Stay Reviews | Avg Rating |
|---|---|---|---|---|
| Gabriel | 1 | $36,415 | 22 | 4.95/5.0 |
| Host #102892186 | 1 | $22,836 | 9 | 5.00/5.0 |
| Geoffrey | 1 | $17,648 | 31 | 4.90/5.0 |
| Host #410220451 | 1 | $17,344 | 5 | 4.60/5.0 |
| Damien | 1 | $15,390 | 41 | 4.98/5.0 |
| Sébastien | 1 | $15,049 | 25 | 4.76/5.0 |
| Celine | 1 | $14,518 | 25 | 4.96/5.0 |
| Maude & Frédéric | 1 | $14,249 | 50 | 4.96/5.0 |
| Marina | 1 | $12,611 | 8 | 5.00/5.0 |
| Helene | 2 | $12,166 | 3 | 2.50/5.0 |
Analyzing the strategies of top hosts, such as their property selection, pricing, and guest communication, can offer valuable lessons for optimizing your own Airbnb operations in Venzolasca.
Dive Deeper: Advanced Venzolasca STR Market Data (2025)
Ready to unlock more insights? AirROI provides access to advanced metrics and comprehensive Airbnb data for Venzolasca. Explore detailed analytics beyond this report to refine your investment strategy, optimize pricing, and maximize your vacation rental profits.
Explore Advanced MetricsVenzolasca Short-Term Rental Market Composition (2025): Property & Room Types
Room Type Distribution
Property Type Distribution
Market Composition Insights for Venzolasca
- The Venzolasca Airbnb market composition is heavily skewed towards Entire Home/Apt listings, which make up 89.3% of the 28 active rentals. This indicates strong guest preference for privacy and space.
- Looking at the property type distribution in Venzolasca, House properties are the most common (60.7%), reflecting the local real estate landscape.
- Houses represent a significant 60.7% portion, catering likely to families or larger groups.
- Smaller segments like hotel/boutique (combined 3.6%) offer potential for unique stay experiences.
Venzolasca Airbnb Room Capacity Analysis (2025): Bedroom Distribution
Distribution of Listings by Number of Bedrooms
Room Capacity Insights for Venzolasca
- The dominant room capacity in Venzolasca is 2 bedrooms listings, making up 39.3% of the market. This suggests a strong demand for properties suitable for couples or solo travelers.
- Together, 2 bedrooms and 1 bedroom properties represent 71.4% of the active Airbnb listings in Venzolasca, indicating a high concentration in these sizes.
Venzolasca Vacation Rental Guest Capacity Trends (2025)
Distribution of Listings by Guest Capacity
Guest Capacity Insights for Venzolasca
- The most common guest capacity trend in Venzolasca vacation rentals is listings accommodating 4 guests (35.7%). This suggests the primary traveler segment is likely small families or groups.
- Properties designed for 4 guests and 5 guests dominate the Venzolasca STR market, accounting for 53.6% of listings.
- 21.5% of properties accommodate 6+ guests, serving the market segment for larger families or group travel in Venzolasca.
- On average, properties in Venzolasca are equipped to host 4.0 guests.
Venzolasca Airbnb Booking Patterns (2025): Available vs. Booked Days
Available Days Distribution
Booked Days Distribution
Booking Pattern Insights for Venzolasca
- The most common availability pattern in Venzolasca falls within the 271-366 days range, representing 50% of listings. This suggests many properties have significant open periods on their calendars.
- Approximately 82.1% of listings show high availability (181+ days open annually), indicating potential for increased bookings or specific owner usage patterns.
- For booked days, the 91-180 days range is most frequent in Venzolasca (35.7%), reflecting common guest stay durations or potential owner blocking patterns.
- A notable 17.9% of properties secure long booking periods (181+ days booked per year), highlighting successful long-term rental strategies or significant owner usage.
Venzolasca Airbnb Minimum Stay Requirements Analysis
Distribution of Listings by Minimum Night Requirement
1 Night
7 listings
26.9% of total
2 Nights
4 listings
15.4% of total
3 Nights
6 listings
23.1% of total
4-6 Nights
5 listings
19.2% of total
7-29 Nights
4 listings
15.4% of total
Key Insights
- The most prevalent minimum stay requirement in Venzolasca is 1 Night, adopted by 26.9% of listings. This highlights the market's preference for shorter, flexible bookings.
Recommendations
- Align with the market by considering a 1 Night minimum stay, as 26.9% of Venzolasca hosts use this setting.
- If feasible, allowing 1-night stays, especially midweek or during low season, could capture last-minute bookings, as only 26.9% currently do.
- Adjust minimum nights based on seasonality – potentially shorter during low season and longer during peak demand periods in Venzolasca.
Venzolasca Airbnb Cancellation Policy Trends Analysis (2025)
Flexible
6 listings
25% of total
Moderate
7 listings
29.2% of total
Firm
6 listings
25% of total
Strict
5 listings
20.8% of total
Cancellation Policy Insights for Venzolasca
- The prevailing Airbnb cancellation policy trend in Venzolasca is Moderate, used by 29.2% of listings.
- There's a relatively balanced mix between guest-friendly (54.2%) and stricter (45.8%) policies, offering choices for different guest needs.
Recommendations for Hosts
- Consider adopting a Moderate policy to align with the 29.2% market standard in Venzolasca.
- Regularly review your cancellation policy against competitors and market demand shifts in Venzolasca.
Venzolasca STR Booking Lead Time Analysis (2025)
Average Booking Lead Time by Month
Booking Lead Time Insights for Venzolasca
- The overall average booking lead time for vacation rentals in Venzolasca is 62 days.
- Guests book furthest in advance for stays during May (average 133 days), likely coinciding with peak travel demand or local events.
- The shortest booking windows occur for stays in December (average 17 days), indicating more last-minute travel plans during this time.
- Seasonally, Spring (98 days avg.) sees the longest lead times, while Winter (45 days avg.) has the shortest, reflecting typical travel planning cycles.
Recommendations for Hosts
- Use the overall average lead time (62 days) as a baseline for your pricing and availability strategy in Venzolasca.
- For May stays, consider implementing length-of-stay discounts or slightly higher rates for bookings made less than 133 days out to capitalize on advance planning.
- Target marketing efforts for the Spring season well in advance (at least 98 days) to capture early planners.
- Monitor your own booking lead times against these Venzolasca averages to identify opportunities for dynamic pricing adjustments.
Popular & Essential Airbnb Amenities in Venzolasca (2025)
Amenity Prevalence
Amenity Insights for Venzolasca
- Essential amenities in Venzolasca that guests expect include: Kitchen, Hangers. Lacking these (any) could significantly impact bookings.
- Popular amenities like Free parking on premises, Washer, Coffee maker are common but not universal. Offering these can provide a competitive edge.
- Warning: Wifi is not universally provided but is considered essential globally. Ensure reliable Wifi is offered.
Recommendations for Hosts
- Ensure your listing includes all essential amenities for Venzolasca: Kitchen, Hangers.
- Prioritize adding missing essentials: Hangers.
- Consider adding popular differentiators like Free parking on premises or Washer to increase appeal.
- Highlight unique or less common amenities you offer (e.g., hot tub, dedicated workspace, EV charger) in your listing description and photos.
- Regularly check competitor amenities in Venzolasca to stay competitive.
Venzolasca Airbnb Guest Demographics & Profile Analysis (2025)
Guest Profile Summary for Venzolasca
- The typical guest profile for Airbnb in Venzolasca consists of a mix of domestic (63%) and international guests, often arriving from nearby Ajaccio, typically belonging to the Post-2000s (Gen Z/Alpha) group (50%), primarily speaking French or English.
- Domestic travelers account for 63.1% of guests.
- Key international markets include France (63.1%) and Germany (13.4%).
- Top languages spoken are French (32.3%) followed by English (31.7%).
- A significant demographic segment is the Post-2000s (Gen Z/Alpha) group, representing 50% of guests.
Recommendations for Hosts
- Target domestic marketing efforts towards travelers from Ajaccio and Madrid.
- Tailor amenities and listing descriptions to appeal to the dominant Post-2000s (Gen Z/Alpha) demographic (e.g., highlight fast WiFi, smart home features, local guides).
- Highlight unique local experiences or amenities relevant to the primary guest profile.
- Consider seasonal promotions aligned with peak travel times for key origin markets.
Nearby Short-Term Rental Market Comparison
How does the Venzolasca Airbnb market stack up against its neighbors? Compare key performance metrics like average monthly revenue, ADR, and occupancy rates in surrounding areas to understand the broader regional STR landscape.
| Market | Active Properties | Monthly Revenue | Daily Rate | Avg. Occupancy |
|---|---|---|---|---|
| Crespina | 16 | $3,526 | $493.64 | 48% |
| Castelfranco di Sotto | 47 | $2,881 | $294.54 | 38% |
| Porto Cervo | 211 | $2,819 | $463.39 | 42% |
| Poltu Quatu | 58 | $2,272 | $314.25 | 47% |
| Forte dei Marmi | 180 | $2,272 | $454.63 | 35% |
| Capannori | 480 | $2,219 | $317.48 | 39% |
| Pieve a Nievole | 21 | $2,099 | $262.37 | 36% |
| San Rocco | 23 | $2,088 | $228.42 | 39% |
| Murato | 10 | $2,063 | $191.89 | 46% |
| Alzachèna/Arzachena | 391 | $2,005 | $387.72 | 42% |