Sotta Airbnb Market Analysis 2025: Short Term Rental Data & Vacation Rental Statistics in Corsica, France
Is Airbnb profitable in Sotta in 2025? Explore comprehensive Airbnb analytics for Sotta, Corsica, France to uncover income potential. This 2025 STR market report for Sotta, based on AirROI data from April 2024 to March 2025, reveals key trends in the niche market of 166 active listings.
Whether you're considering an Airbnb investment in Sotta, optimizing your existing vacation rental, or exploring rental arbitrage opportunities, understanding the Sotta Airbnb data is crucial. Leveraging the low regulation environment is key to maximizing your short term rental income potential. Let's dive into the specifics.
Key Sotta Airbnb Performance Metrics Overview
Monthly Airbnb Revenue Variations & Income Potential in Sotta (2025)
Understanding the monthly revenue variations for Airbnb listings in Sotta is key to maximizing your short term rental income potential. Seasonality significantly impacts earnings. Our analysis, based on data from the past 12 months, shows that the peak revenue month for STRs in Sotta is typically August, while January often presents the lowest earnings, highlighting opportunities for strategic pricing adjustments during shoulder and low seasons. Explore the typical Airbnb income in Sotta across different performance tiers:
- Best-in-class properties (Top 10%) achieve $5,063+ monthly, often utilizing dynamic pricing and superior guest experiences.
- Strong performing properties (Top 25%) earn $3,359 or more, indicating effective management and desirable locations/amenities.
- Typical properties (Median) generate around $1,833 per month, representing the average market performance.
- Entry-level properties (Bottom 25%) see earnings around $1,005, often with potential for optimization.
Average Monthly Airbnb Earnings Trend in Sotta
Sotta Airbnb Occupancy Rate Trends (2025)
Maximize your bookings by understanding the Sotta STR occupancy trends. Seasonal demand shifts significantly influence how often properties are booked. Typically, Augustsees the highest demand (peak season occupancy), while January experiences the lowest (low season). Effective strategies, like adjusting minimum stays or offering promotions, can boost occupancy during slower periods. Here's how different property tiers perform in Sotta:
- Best-in-class properties (Top 10%) achieve 71%+ occupancy, indicating high desirability and potentially optimized availability.
- Strong performing properties (Top 25%) maintain 59% or higher occupancy, suggesting good market fit and guest satisfaction.
- Typical properties (Median) have an occupancy rate around 40%.
- Entry-level properties (Bottom 25%) average 24% occupancy, potentially facing higher vacancy.
Average Monthly Occupancy Rate Trend in Sotta
Average Daily Rate (ADR) Airbnb Trends in Sotta (2025)
Effective short term rental pricing strategy in Sotta involves understanding monthly ADR fluctuations. The Average Daily Rate (ADR) for Airbnb in Sotta typically peaks in July and dips lowest during March. Leveraging Airbnb dynamic pricing tools or strategies based on this seasonality can significantly boost revenue. Here's a look at the typical nightly rates achieved:
- Best-in-class properties (Top 10%) command rates of $327+ per night, often due to premium features or locations.
- Strong performing properties (Top 25%) achieve nightly rates of $235 or more.
- Typical properties (Median) charge around $151 per night.
- Entry-level properties (Bottom 25%) earn around $102 per night.
Average Daily Rate (ADR) Trend by Month in Sotta
Get Live Sotta Market Intelligence 👇

Explore Real-time Analytics
Airbnb Seasonality Analysis & Trends in Sotta (2025)
Peak Season (August, July, June)
- Revenue averages $4,835 per month
- Occupancy rates average 66.4%
- Daily rates average $212
Shoulder Season
- Revenue averages $2,060 per month
- Occupancy maintains around 40.1%
- Daily rates hold near $175
Low Season (January, February, March)
- Revenue drops to average $576 per month
- Occupancy decreases to average 17.6%
- Daily rates adjust to average $159
Seasonality Insights for Sotta
- The Airbnb seasonality in Sotta shows highly seasonal trends requiring careful strategy. While the sections above show seasonal averages, it's also insightful to look at the extremes:
- During the high season, the absolute peak month showcases Sotta's highest earning potential, with monthly revenues capable of climbing to $5,682, occupancy reaching a high of 78.0%, and ADRs peaking at $218.
- Conversely, the slowest single month of the year, typically falling within the low season, marks the market's lowest point. In this month, revenue might dip to $543, occupancy could drop to 17.2%, and ADRs may adjust down to $157.
- Understanding both the seasonal averages and these monthly peaks and troughs in revenue, occupancy, and ADR is crucial for maximizing your Airbnb profit potential in Sotta.
Seasonal Strategies for Maximizing Profit
- Peak Season: Maximize revenue through premium pricing and potentially longer minimum stays. Ensure high availability.
- Low Season: Offer competitive pricing, special promotions (e.g., extended stay discounts), and flexible cancellation policies. Target off-season travelers like remote workers or budget-conscious guests.
- Shoulder Seasons: Implement dynamic pricing that balances peak and low rates. Target weekend travelers or specific events. Offer slightly more flexible terms than peak season.
- Regularly analyze your own performance against these Sotta seasonality benchmarks and adjust your pricing and availability strategy accordingly.
Best Areas for Airbnb Investment in Sotta (2025)
Exploring the top neighborhoods for short-term rentals in Sotta? This section highlights key areas, outlining why they are attractive for hosts and guests, along with notable local attractions. Consider these locations based on your target guest profile and investment strategy.
| Neighborhood / Area | Why Host Here? (Target Guests & Appeal) | Key Attractions & Landmarks |
|---|---|---|
| Sotta Village | Charming Corsican village with traditional architecture and proximity to nature. Ideal for guests looking for an authentic Corsican experience, away from the hustle and bustle. | Local markets, Corsican wines, Hiking trails, Scenic countryside, Traditional Corsican cuisine |
| Porto-Vecchio | Popular seaside town known for its beautiful beaches and vibrant nightlife. Attracts a lot of tourists looking for summer vacations, offering a wide range of activities and amenities. | Palombaggia Beach, Santa Giulia Beach, Old Town Porto-Vecchio, Night clubs and bars, Boat trips |
| Bonifacio | Historic cliff-top town known for its stunning views and dramatic coastline. A must-visit for tourists interested in history, architecture, and natural beauty. | Bonifacio citadel, Cliffs of Bonifacio, Boat tours, Lighthouse of Pertusato, Scoglios de la Signora |
| Figari | Known for its vineyards and proximity to beautiful scenery. Perfect for guests who enjoy wine tourism and exploring rural Corsica. | Wine estates, Beautiful landscapes, Hiking opportunities, Local festivals |
| Porto-Vecchio Gulf | Stunning coastal area with clear waters and excellent snorkeling and diving. Appeals to water sports enthusiasts and families looking for a beach vacation. | Calo Pischina, Calo di Roccapina, Diving spots, Boat rentals, Water sports centers |
| Lecci | Nestled in a tranquil area with easy access to the coastline. Attracts visitors looking for relaxation and peaceful retreats. | Beautiful beaches, Natural parks, Local restaurants, Hiking trails |
| Tarco | A small coastal village known for its beautiful beaches and relaxed atmosphere. Great for families and couple getaways seeking tranquility. | Tarco Beach, Local eateries, Nature walks, Quiet surroundings |
| St. Lucia di Porto Vecchio | Scenic area that combines beautiful beaches with charming village life. Ideal for guests who want a mix of relaxation and local culture. | Punta di Capicciolu, Local beach clubs, Cultural activities, Artisan shops |
Understanding Airbnb License Requirements & STR Laws in Sotta (2025)
While Sotta, Corsica, France currently shows low STR regulations, specific Airbnb license requirements might still exist or change. Always verify the latest short term rental regulations and Airbnb license requirements directly with local government authorities for Sotta to ensure full compliance before hosting.
(Source: AirROI data, 2025, based on 7% licensed listings)
Top Performing Airbnb Properties in Sotta (2025)
Benchmark your potential! Explore examples of top-performing Airbnb properties in Sottabased on Trailing Twelve Month (TTM) revenue. Analyze their characteristics, revenue, occupancy rate, and ADR to understand what drives success in this market.

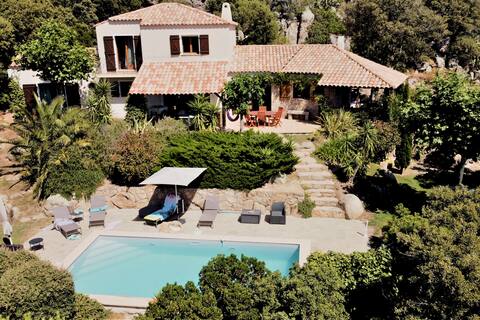
Authentic charming sheepfold with private pool
Entire Place • 2 bedrooms
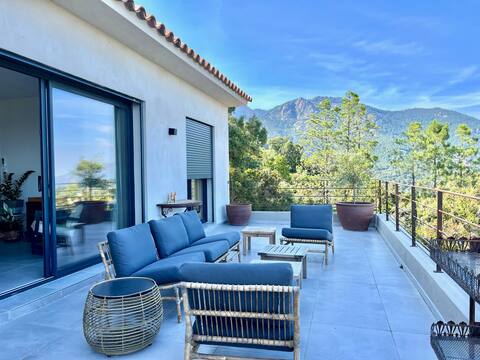
Villa 4* Heated swimming pool and private bowls
Entire Place • 3 bedrooms
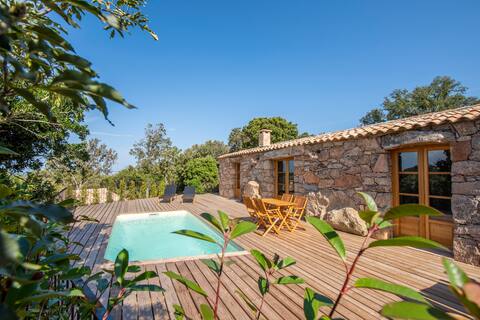
Bergerie Monte d 'Oru
Entire Place • 2 bedrooms
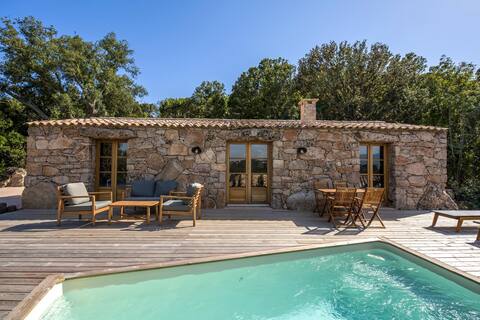
Bergerie U Cintu
Entire Place • 2 bedrooms
Casa Lycia paoline
Entire Place • 3 bedrooms
Ideal sheepfold with a view
Entire Place • 2 bedrooms
Note: Performance varies based on location, size, amenities, seasonality, and management quality. Data reflects the past 12 months.
Top Performing Airbnb Hosts in Sotta (2025)
Learn from the best! This table showcases top-performing Airbnb hosts in Sotta based on the number of properties managed and estimated total revenue over the past year. Analyze their scale and performance metrics.
| Host Name | Properties | Grossing Revenue | Stay Reviews | Avg Rating |
|---|---|---|---|---|
| Thierry | 14 | $600,638 | 405 | 4.17/5.0 |
| José | 4 | $193,460 | 288 | 4.94/5.0 |
| Cécile Et Christian | 7 | $90,967 | 167 | 4.70/5.0 |
| Steph & Matt | 3 | $77,146 | 114 | 4.76/5.0 |
| Valerie | 2 | $72,700 | 116 | 4.98/5.0 |
| Thierry | 5 | $70,556 | 300 | 4.82/5.0 |
| Stephane | 3 | $64,543 | 29 | 5.00/5.0 |
| Marie Charlotte | 3 | $61,287 | 158 | 4.81/5.0 |
| Florence | 1 | $60,453 | 29 | 4.79/5.0 |
| Marie | 2 | $59,916 | 125 | 4.93/5.0 |
Analyzing the strategies of top hosts, such as their property selection, pricing, and guest communication, can offer valuable lessons for optimizing your own Airbnb operations in Sotta.
Dive Deeper: Advanced Sotta STR Market Data (2025)
Ready to unlock more insights? AirROI provides access to advanced metrics and comprehensive Airbnb data for Sotta. Explore detailed analytics beyond this report to refine your investment strategy, optimize pricing, and maximize your vacation rental profits.
Explore Advanced MetricsSotta Short-Term Rental Market Composition (2025): Property & Room Types
Room Type Distribution
Property Type Distribution
Market Composition Insights for Sotta
- The Sotta Airbnb market composition is heavily skewed towards Entire Home/Apt listings, which make up 91.6% of the 166 active rentals. This indicates strong guest preference for privacy and space.
- Looking at the property type distribution in Sotta, House properties are the most common (77.7%), reflecting the local real estate landscape.
- Houses represent a significant 77.7% portion, catering likely to families or larger groups.
- Smaller segments like hotel/boutique, outdoor/unique, others (combined 9.6%) offer potential for unique stay experiences.
Sotta Airbnb Room Capacity Analysis (2025): Bedroom Distribution
Distribution of Listings by Number of Bedrooms
Room Capacity Insights for Sotta
- The dominant room capacity in Sotta is 2 bedrooms listings, making up 38% of the market. This suggests a strong demand for properties suitable for couples or solo travelers.
- Together, 2 bedrooms and 1 bedroom properties represent 66.3% of the active Airbnb listings in Sotta, indicating a high concentration in these sizes.
- A significant 26.5% of listings offer 3+ bedrooms, catering to larger groups and families seeking more space in Sotta.
Sotta Vacation Rental Guest Capacity Trends (2025)
Distribution of Listings by Guest Capacity
Guest Capacity Insights for Sotta
- The most common guest capacity trend in Sotta vacation rentals is listings accommodating 4 guests (38.6%). This suggests the primary traveler segment is likely small families or groups.
- Properties designed for 4 guests and 6 guests dominate the Sotta STR market, accounting for 62.7% of listings.
- 30.1% of properties accommodate 6+ guests, serving the market segment for larger families or group travel in Sotta.
- On average, properties in Sotta are equipped to host 4.2 guests.
Sotta Airbnb Booking Patterns (2025): Available vs. Booked Days
Available Days Distribution
Booked Days Distribution
Booking Pattern Insights for Sotta
- The most common availability pattern in Sotta falls within the 181-270 days range, representing 45.8% of listings. This suggests many properties have significant open periods on their calendars.
- Approximately 86.2% of listings show high availability (181+ days open annually), indicating potential for increased bookings or specific owner usage patterns.
- For booked days, the 91-180 days range is most frequent in Sotta (50%), reflecting common guest stay durations or potential owner blocking patterns.
- A notable 13.9% of properties secure long booking periods (181+ days booked per year), highlighting successful long-term rental strategies or significant owner usage.
Sotta Airbnb Minimum Stay Requirements Analysis
Distribution of Listings by Minimum Night Requirement
1 Night
26 listings
16.4% of total
2 Nights
20 listings
12.6% of total
3 Nights
20 listings
12.6% of total
4-6 Nights
60 listings
37.7% of total
7-29 Nights
24 listings
15.1% of total
30+ Nights
9 listings
5.7% of total
Key Insights
- The most prevalent minimum stay requirement in Sotta is 4-6 Nights, adopted by 37.7% of listings. This highlights the market's preference for longer commitments.
Recommendations
- Align with the market by considering a 4-6 Nights minimum stay, as 37.7% of Sotta hosts use this setting.
- If feasible, allowing 1-night stays, especially midweek or during low season, could capture last-minute bookings, as only 16.4% currently do.
- Explore offering discounts for stays of 30+ nights to attract the 5.7% of the market seeking extended stays.
- Adjust minimum nights based on seasonality – potentially shorter during low season and longer during peak demand periods in Sotta.
Sotta Airbnb Cancellation Policy Trends Analysis (2025)
Super Strict 30 Days
1 listings
0.7% of total
Refundable
1 listings
0.7% of total
Flexible
24 listings
16.3% of total
Moderate
19 listings
12.9% of total
Firm
54 listings
36.7% of total
Strict
48 listings
32.7% of total
Cancellation Policy Insights for Sotta
- The prevailing Airbnb cancellation policy trend in Sotta is Firm, used by 36.7% of listings.
- A majority (69.4%) of hosts in Sotta utilize Firm or Strict policies, indicating a market where hosts prioritize booking security.
Recommendations for Hosts
- Consider adopting a Firm policy to align with the 36.7% market standard in Sotta.
- With 32.7% using Strict terms, this is a viable option in Sotta, particularly for high-value properties or during peak demand periods.
- Regularly review your cancellation policy against competitors and market demand shifts in Sotta.
Sotta STR Booking Lead Time Analysis (2025)
Average Booking Lead Time by Month
Booking Lead Time Insights for Sotta
- The overall average booking lead time for vacation rentals in Sotta is 82 days.
- Guests book furthest in advance for stays during July (average 138 days), likely coinciding with peak travel demand or local events.
- The shortest booking windows occur for stays in February (average 14 days), indicating more last-minute travel plans during this time.
- Seasonally, Summer (124 days avg.) sees the longest lead times, while Winter (33 days avg.) has the shortest, reflecting typical travel planning cycles.
Recommendations for Hosts
- Use the overall average lead time (82 days) as a baseline for your pricing and availability strategy in Sotta.
- For July stays, consider implementing length-of-stay discounts or slightly higher rates for bookings made less than 138 days out to capitalize on advance planning.
- During February, focus on last-minute booking availability and promotions, as guests book with very short notice (14 days avg.).
- Target marketing efforts for the Summer season well in advance (at least 124 days) to capture early planners.
- Monitor your own booking lead times against these Sotta averages to identify opportunities for dynamic pricing adjustments.
Popular & Essential Airbnb Amenities in Sotta (2025)
Amenity Prevalence
Amenity Insights for Sotta
- Essential amenities in Sotta that guests expect include: Free parking on premises, Kitchen, Hot water. Lacking these (any) could significantly impact bookings.
- Popular amenities like TV, Wifi, Heating are common but not universal. Offering these can provide a competitive edge.
- Warning: Wifi is not universally provided but is considered essential globally. Ensure reliable Wifi is offered.
Recommendations for Hosts
- Ensure your listing includes all essential amenities for Sotta: Free parking on premises, Kitchen, Hot water.
- Prioritize adding missing essentials: Free parking on premises, Kitchen, Hot water.
- Consider adding popular differentiators like TV or Wifi to increase appeal.
- Highlight unique or less common amenities you offer (e.g., hot tub, dedicated workspace, EV charger) in your listing description and photos.
- Regularly check competitor amenities in Sotta to stay competitive.
Sotta Airbnb Guest Demographics & Profile Analysis (2025)
Guest Profile Summary for Sotta
- The typical guest profile for Airbnb in Sotta consists of a mix of domestic (63%) and international guests, often arriving from nearby Paris, typically belonging to the Post-2000s (Gen Z/Alpha) group (50%), primarily speaking English or French.
- Domestic travelers account for 63.0% of guests.
- Key international markets include France (63%) and Germany (10.6%).
- Top languages spoken are English (35.9%) followed by French (33.5%).
- A significant demographic segment is the Post-2000s (Gen Z/Alpha) group, representing 50% of guests.
Recommendations for Hosts
- Target domestic marketing efforts towards travelers from Paris and Milan.
- Tailor amenities and listing descriptions to appeal to the dominant Post-2000s (Gen Z/Alpha) demographic (e.g., highlight fast WiFi, smart home features, local guides).
- Highlight unique local experiences or amenities relevant to the primary guest profile.
- Consider seasonal promotions aligned with peak travel times for key origin markets.
Nearby Short-Term Rental Market Comparison
How does the Sotta Airbnb market stack up against its neighbors? Compare key performance metrics like average monthly revenue, ADR, and occupancy rates in surrounding areas to understand the broader regional STR landscape.
| Market | Active Properties | Monthly Revenue | Daily Rate | Avg. Occupancy |
|---|---|---|---|---|
| Porto Cervo | 211 | $2,819 | $463.39 | 42% |
| Poltu Quatu | 58 | $2,272 | $314.25 | 47% |
| Murato | 10 | $2,063 | $191.89 | 46% |
| Alzachèna/Arzachena | 391 | $2,005 | $387.72 | 42% |
| Rio | 23 | $1,946 | $343.94 | 43% |
| Zonza | 709 | $1,922 | $294.10 | 44% |
| Pietrosella | 239 | $1,911 | $258.65 | 45% |
| Figari | 213 | $1,890 | $191.79 | 50% |
| Bonifacio / Bunifaziu | 499 | $1,866 | $216.08 | 49% |
| Porto-Vecchio | 1,908 | $1,814 | $220.84 | 48% |