Luri Airbnb Market Analysis 2025: Short Term Rental Data & Vacation Rental Statistics in Corsica, France
Is Airbnb profitable in Luri in 2025? Explore comprehensive Airbnb analytics for Luri, Corsica, France to uncover income potential. This 2025 STR market report for Luri, based on AirROI data from April 2024 to March 2025, reveals key trends in the niche market of 42 active listings.
Whether you're considering an Airbnb investment in Luri, optimizing your existing vacation rental, or exploring rental arbitrage opportunities, understanding the Luri Airbnb data is crucial. Navigating the high regulation landscape is key to maximizing your short term rental income potential. Let's dive into the specifics.
Key Luri Airbnb Performance Metrics Overview
Monthly Airbnb Revenue Variations & Income Potential in Luri (2025)
Understanding the monthly revenue variations for Airbnb listings in Luri is key to maximizing your short term rental income potential. Seasonality significantly impacts earnings. Our analysis, based on data from the past 12 months, shows that the peak revenue month for STRs in Luri is typically August, while February often presents the lowest earnings, highlighting opportunities for strategic pricing adjustments during shoulder and low seasons. Explore the typical Airbnb income in Luri across different performance tiers:
- Best-in-class properties (Top 10%) achieve $2,273+ monthly, often utilizing dynamic pricing and superior guest experiences.
- Strong performing properties (Top 25%) earn $1,525 or more, indicating effective management and desirable locations/amenities.
- Typical properties (Median) generate around $853 per month, representing the average market performance.
- Entry-level properties (Bottom 25%) see earnings around $542, often with potential for optimization.
Average Monthly Airbnb Earnings Trend in Luri
Luri Airbnb Occupancy Rate Trends (2025)
Maximize your bookings by understanding the Luri STR occupancy trends. Seasonal demand shifts significantly influence how often properties are booked. Typically, Augustsees the highest demand (peak season occupancy), while December experiences the lowest (low season). Effective strategies, like adjusting minimum stays or offering promotions, can boost occupancy during slower periods. Here's how different property tiers perform in Luri:
- Best-in-class properties (Top 10%) achieve 65%+ occupancy, indicating high desirability and potentially optimized availability.
- Strong performing properties (Top 25%) maintain 48% or higher occupancy, suggesting good market fit and guest satisfaction.
- Typical properties (Median) have an occupancy rate around 29%.
- Entry-level properties (Bottom 25%) average 19% occupancy, potentially facing higher vacancy.
Average Monthly Occupancy Rate Trend in Luri
Average Daily Rate (ADR) Airbnb Trends in Luri (2025)
Effective short term rental pricing strategy in Luri involves understanding monthly ADR fluctuations. The Average Daily Rate (ADR) for Airbnb in Luri typically peaks in August and dips lowest during November. Leveraging Airbnb dynamic pricing tools or strategies based on this seasonality can significantly boost revenue. Here's a look at the typical nightly rates achieved:
- Best-in-class properties (Top 10%) command rates of $175+ per night, often due to premium features or locations.
- Strong performing properties (Top 25%) achieve nightly rates of $114 or more.
- Typical properties (Median) charge around $90 per night.
- Entry-level properties (Bottom 25%) earn around $74 per night.
Average Daily Rate (ADR) Trend by Month in Luri
Get Live Luri Market Intelligence 👇

Explore Real-time Analytics
Airbnb Seasonality Analysis & Trends in Luri (2025)
Peak Season (August, July, April)
- Revenue averages $1,923 per month
- Occupancy rates average 57.7%
- Daily rates average $120
Shoulder Season
- Revenue averages $1,034 per month
- Occupancy maintains around 31.3%
- Daily rates hold near $110
Low Season (February, March, November)
- Revenue drops to average $462 per month
- Occupancy decreases to average 20.1%
- Daily rates adjust to average $100
Seasonality Insights for Luri
- The Airbnb seasonality in Luri shows highly seasonal trends requiring careful strategy. While the sections above show seasonal averages, it's also insightful to look at the extremes:
- During the high season, the absolute peak month showcases Luri's highest earning potential, with monthly revenues capable of climbing to $2,528, occupancy reaching a high of 75.5%, and ADRs peaking at $125.
- Conversely, the slowest single month of the year, typically falling within the low season, marks the market's lowest point. In this month, revenue might dip to $428, occupancy could drop to 18.1%, and ADRs may adjust down to $98.
- Understanding both the seasonal averages and these monthly peaks and troughs in revenue, occupancy, and ADR is crucial for maximizing your Airbnb profit potential in Luri.
Seasonal Strategies for Maximizing Profit
- Peak Season: Maximize revenue through premium pricing and potentially longer minimum stays. Ensure high availability.
- Low Season: Offer competitive pricing, special promotions (e.g., extended stay discounts), and flexible cancellation policies. Target off-season travelers like remote workers or budget-conscious guests.
- Shoulder Seasons: Implement dynamic pricing that balances peak and low rates. Target weekend travelers or specific events. Offer slightly more flexible terms than peak season.
- Regularly analyze your own performance against these Luri seasonality benchmarks and adjust your pricing and availability strategy accordingly.
Best Areas for Airbnb Investment in Luri (2025)
Exploring the top neighborhoods for short-term rentals in Luri? This section highlights key areas, outlining why they are attractive for hosts and guests, along with notable local attractions. Consider these locations based on your target guest profile and investment strategy.
| Neighborhood / Area | Why Host Here? (Target Guests & Appeal) | Key Attractions & Landmarks |
|---|---|---|
| Calvi | Calvi is known for its stunning beaches, historical citadel, and vibrant nightlife. It offers a rich blend of culture and leisure, making it a prime destination for tourists seeking both relaxation and exploration. | Calvi Citadel, Calvi Beach, Notre Dame de la Serra, Grand Hotel de Calvi, Corte Mountains |
| Bastia | As the largest city in northern Corsica, Bastia is a mix of traditional Corsican culture and modern amenities. Its harbor and vibrant market make it an attractive location for visitors exploring the island. | Bastia Old Port, Church of St. John the Baptist, Place Saint-Nicolas, Le Vieux Port, Bastia Market |
| Porto-Vecchio | Famous for its beautiful beaches and picturesque old town, Porto-Vecchio is a favorite among tourists looking for sun and sea, as well as chic dining and nightlife options. | Palombaggia Beach, Santa Giulia Beach, Porto-Vecchio Marina, Old Town of Porto-Vecchio, Bavella Needles |
| Ajaccio | The birthplace of Napoleon Bonaparte, Ajaccio offers a rich historical backdrop along with beautiful coastal views. It attracts history buffs and beachgoers alike. | Napoleon's House, Ajaccio Cathedral, Sanguinaires Islands, Fesch Museum, Ajaccio Market |
| Bonifacio | Known for its dramatic cliffs and walled old town, Bonifacio boasts stunning views and unique geological formations. A must-visit for tourists attracted to breathtaking scenery. | Bonifacio Citadel, Escaliers du Roi Aragon, Lavezzi Islands, Marine Reserve, King Aragon Steps |
| Golfo di Sogno | A beautiful coastal area with crystal-clear waters, perfect for outdoor activities like hiking and water sports. It's a popular spot for nature enthusiasts and beach lovers. | Golfo di Sogno Beach, Scandola Nature Reserve, Outdoor hiking trails, Local seafood restaurants |
| Cap Corse | A rugged and wild coastline, ideal for those looking to experience authentic Corsican culture and beautiful landscapes. It's less touristy and offers a true escape. | Nonza, Centuri, Erbalunga, Scenic coastal drives, Local vineyards |
| Ostriconi | A hidden gem known for its stunning beaches and untouched natural beauty, ideal for those seeking tranquility and a more laid-back atmosphere. | Ostriconi Beach, Desert des Agriates, Local hiking trails, Secluded coves, Nature walks |
Understanding Airbnb License Requirements & STR Laws in Luri (2025)
Yes, Luri, Corsica, France enforces high STR regulations. Obtaining a license and ensuring compliance is almost certainly required according to current 2025 STR laws. Always verify the latest short term rental regulations and Airbnb license requirements directly with local government authorities for Luri to ensure full compliance before hosting.
(Source: AirROI data, 2025, based on 74% licensed listings)
Top Performing Airbnb Properties in Luri (2025)
Benchmark your potential! Explore examples of top-performing Airbnb properties in Luribased on Trailing Twelve Month (TTM) revenue. Analyze their characteristics, revenue, occupancy rate, and ADR to understand what drives success in this market.
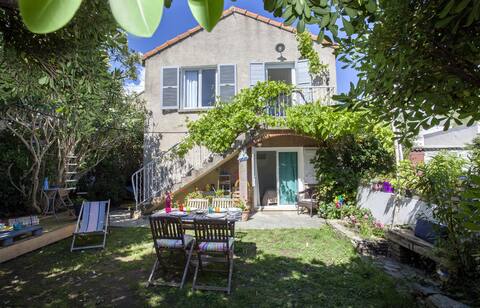
LAST MIN : House by the sea,Corsica
Entire Place • 2 bedrooms
Casa Ella bord de mer, avec jardin privatif
Entire Place • 2 bedrooms
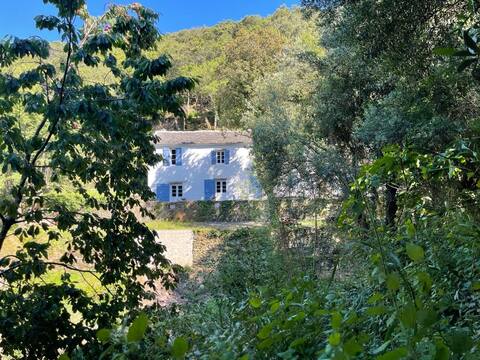
Beautiful sheepfold from 1650 , completely renovated
Entire Place • 4 bedrooms

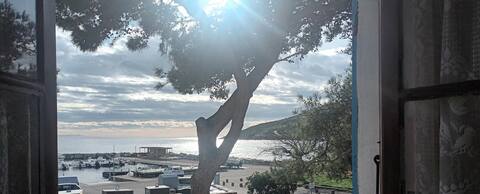
Apartment F3(70m²) sea view
Entire Place • 2 bedrooms

charmant t2 dans villa avec piscine
Entire Place • 1 bedroom
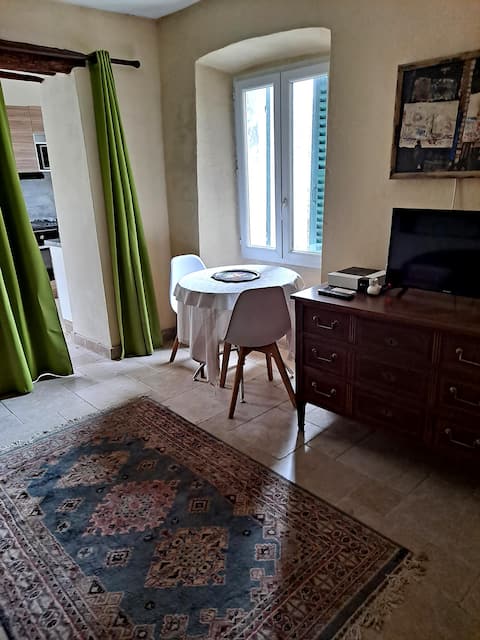
Studio for couple
Entire Place • 1 bedroom
Note: Performance varies based on location, size, amenities, seasonality, and management quality. Data reflects the past 12 months.
Top Performing Airbnb Hosts in Luri (2025)
Learn from the best! This table showcases top-performing Airbnb hosts in Luri based on the number of properties managed and estimated total revenue over the past year. Analyze their scale and performance metrics.
| Host Name | Properties | Grossing Revenue | Stay Reviews | Avg Rating |
|---|---|---|---|---|
| Host #423138008 | 4 | $35,604 | 13 | 1.13/5.0 |
| Charlotte | 1 | $21,299 | 131 | 4.75/5.0 |
| Corinne | 4 | $18,219 | 249 | 4.82/5.0 |
| Florian | 3 | $17,465 | 22 | 4.62/5.0 |
| Florence | 4 | $17,430 | 4 | 1.25/5.0 |
| Maria Et Lisa | 2 | $14,867 | 243 | 4.96/5.0 |
| Veronique | 1 | $14,378 | 4 | 5.00/5.0 |
| Jean-Louis | 1 | $13,204 | 50 | 4.92/5.0 |
| Host #62426479 | 1 | $12,921 | 34 | 4.94/5.0 |
| Agathe | 1 | $11,799 | 33 | 4.76/5.0 |
Analyzing the strategies of top hosts, such as their property selection, pricing, and guest communication, can offer valuable lessons for optimizing your own Airbnb operations in Luri.
Dive Deeper: Advanced Luri STR Market Data (2025)
Ready to unlock more insights? AirROI provides access to advanced metrics and comprehensive Airbnb data for Luri. Explore detailed analytics beyond this report to refine your investment strategy, optimize pricing, and maximize your vacation rental profits.
Explore Advanced MetricsLuri Short-Term Rental Market Composition (2025): Property & Room Types
Room Type Distribution
Property Type Distribution
Market Composition Insights for Luri
- The Luri Airbnb market composition is heavily skewed towards Entire Home/Apt listings, which make up 88.1% of the 42 active rentals. This indicates strong guest preference for privacy and space.
- Looking at the property type distribution in Luri, Apartment/Condo properties are the most common (61.9%), reflecting the local real estate landscape.
- Houses represent a significant 26.2% portion, catering likely to families or larger groups.
- The presence of 9.5% Hotel/Boutique listings indicates integration with traditional hospitality.
- Smaller segments like others (combined 2.4%) offer potential for unique stay experiences.
Luri Airbnb Room Capacity Analysis (2025): Bedroom Distribution
Distribution of Listings by Number of Bedrooms
Room Capacity Insights for Luri
- The dominant room capacity in Luri is 1 bedroom listings, making up 38.1% of the market. This suggests a strong demand for properties suitable for couples or solo travelers.
- Together, 1 bedroom and 2 bedrooms properties represent 66.7% of the active Airbnb listings in Luri, indicating a high concentration in these sizes.
Luri Vacation Rental Guest Capacity Trends (2025)
Distribution of Listings by Guest Capacity
Guest Capacity Insights for Luri
- The most common guest capacity trend in Luri vacation rentals is listings accommodating 2 guests (33.3%). This suggests the primary traveler segment is likely couples or solo travelers.
- Properties designed for 2 guests and 4 guests dominate the Luri STR market, accounting for 66.6% of listings.
- 16.7% of properties accommodate 6+ guests, serving the market segment for larger families or group travel in Luri.
- On average, properties in Luri are equipped to host 3.6 guests.
Luri Airbnb Booking Patterns (2025): Available vs. Booked Days
Available Days Distribution
Booked Days Distribution
Booking Pattern Insights for Luri
- The most common availability pattern in Luri falls within the 271-366 days range, representing 66.7% of listings. This suggests many properties have significant open periods on their calendars.
- Approximately 97.7% of listings show high availability (181+ days open annually), indicating potential for increased bookings or specific owner usage patterns.
- For booked days, the 31-90 days range is most frequent in Luri (54.8%), reflecting common guest stay durations or potential owner blocking patterns.
- A notable 2.4% of properties secure long booking periods (181+ days booked per year), highlighting successful long-term rental strategies or significant owner usage.
Luri Airbnb Minimum Stay Requirements Analysis
Distribution of Listings by Minimum Night Requirement
2 Nights
8 listings
22.2% of total
3 Nights
8 listings
22.2% of total
4-6 Nights
17 listings
47.2% of total
7-29 Nights
2 listings
5.6% of total
30+ Nights
1 listings
2.8% of total
Key Insights
- The most prevalent minimum stay requirement in Luri is 4-6 Nights, adopted by 47.2% of listings. This highlights the market's preference for longer commitments.
- Dedicated monthly rentals (30+ nights) represent a small niche (2.8%), possibly an untapped area for hosts.
Recommendations
- Align with the market by considering a 4-6 Nights minimum stay, as 47.2% of Luri hosts use this setting.
- Adjust minimum nights based on seasonality – potentially shorter during low season and longer during peak demand periods in Luri.
Luri Airbnb Cancellation Policy Trends Analysis (2025)
Flexible
12 listings
36.4% of total
Moderate
6 listings
18.2% of total
Firm
7 listings
21.2% of total
Strict
8 listings
24.2% of total
Cancellation Policy Insights for Luri
- The prevailing Airbnb cancellation policy trend in Luri is Flexible, used by 36.4% of listings.
- There's a relatively balanced mix between guest-friendly (54.6%) and stricter (45.4%) policies, offering choices for different guest needs.
Recommendations for Hosts
- Consider adopting a Flexible policy to align with the 36.4% market standard in Luri.
- Regularly review your cancellation policy against competitors and market demand shifts in Luri.
Luri STR Booking Lead Time Analysis (2025)
Average Booking Lead Time by Month
Booking Lead Time Insights for Luri
- The overall average booking lead time for vacation rentals in Luri is 74 days.
- Guests book furthest in advance for stays during July (average 103 days), likely coinciding with peak travel demand or local events.
- The shortest booking windows occur for stays in March (average 0 days), indicating more last-minute travel plans during this time.
- Seasonally, Summer (92 days avg.) sees the longest lead times, while Winter (22 days avg.) has the shortest, reflecting typical travel planning cycles.
Recommendations for Hosts
- Use the overall average lead time (74 days) as a baseline for your pricing and availability strategy in Luri.
- For July stays, consider implementing length-of-stay discounts or slightly higher rates for bookings made less than 103 days out to capitalize on advance planning.
- During March, focus on last-minute booking availability and promotions, as guests book with very short notice (0 days avg.).
- Target marketing efforts for the Summer season well in advance (at least 92 days) to capture early planners.
- Monitor your own booking lead times against these Luri averages to identify opportunities for dynamic pricing adjustments.
Popular & Essential Airbnb Amenities in Luri (2025)
Amenity Prevalence
Amenity Insights for Luri
- Essential amenities in Luri that guests expect include: Free parking on premises, Kitchen, Hot water. Lacking these (any) could significantly impact bookings.
- Popular amenities like Heating, Washer, Essentials are common but not universal. Offering these can provide a competitive edge.
Recommendations for Hosts
- Ensure your listing includes all essential amenities for Luri: Free parking on premises, Kitchen, Hot water.
- Prioritize adding missing essentials: Free parking on premises, Kitchen, Hot water.
- Consider adding popular differentiators like Heating or Washer to increase appeal.
- Highlight unique or less common amenities you offer (e.g., hot tub, dedicated workspace, EV charger) in your listing description and photos.
- Regularly check competitor amenities in Luri to stay competitive.
Luri Airbnb Guest Demographics & Profile Analysis (2025)
Guest Profile Summary for Luri
- The typical guest profile for Airbnb in Luri consists of a mix of domestic (57%) and international guests, often arriving from nearby Paris, typically belonging to the Post-2000s (Gen Z/Alpha) group (50%), primarily speaking English or French.
- Domestic travelers account for 56.6% of guests.
- Key international markets include France (56.6%) and Italy (23.7%).
- Top languages spoken are English (32.8%) followed by French (24.6%).
- A significant demographic segment is the Post-2000s (Gen Z/Alpha) group, representing 50% of guests.
Recommendations for Hosts
- Balance marketing efforts between domestic and international channels based on the guest mix.
- Tailor amenities and listing descriptions to appeal to the dominant Post-2000s (Gen Z/Alpha) demographic (e.g., highlight fast WiFi, smart home features, local guides).
- Highlight unique local experiences or amenities relevant to the primary guest profile.
- Consider seasonal promotions aligned with peak travel times for key origin markets.
Nearby Short-Term Rental Market Comparison
How does the Luri Airbnb market stack up against its neighbors? Compare key performance metrics like average monthly revenue, ADR, and occupancy rates in surrounding areas to understand the broader regional STR landscape.
| Market | Active Properties | Monthly Revenue | Daily Rate | Avg. Occupancy |
|---|---|---|---|---|
| Crespina | 16 | $3,526 | $493.64 | 48% |
| Castelfranco di Sotto | 47 | $2,881 | $294.54 | 38% |
| Porto Cervo | 211 | $2,819 | $463.39 | 42% |
| Poltu Quatu | 58 | $2,272 | $314.25 | 47% |
| Forte dei Marmi | 180 | $2,272 | $454.63 | 35% |
| Capannori | 480 | $2,219 | $317.48 | 39% |
| Pieve a Nievole | 21 | $2,099 | $262.37 | 36% |
| San Rocco | 23 | $2,088 | $228.42 | 39% |
| Murato | 10 | $2,063 | $191.89 | 46% |
| Alzachèna/Arzachena | 391 | $2,005 | $387.72 | 42% |