Calcatoggio Airbnb Market Analysis 2025: Short Term Rental Data & Vacation Rental Statistics in Corsica, France
Is Airbnb profitable in Calcatoggio in 2025? Explore comprehensive Airbnb analytics for Calcatoggio, Corsica, France to uncover income potential. This 2025 STR market report for Calcatoggio, based on AirROI data from April 2024 to March 2025, reveals key trends in the niche market of 150 active listings.
Whether you're considering an Airbnb investment in Calcatoggio, optimizing your existing vacation rental, or exploring rental arbitrage opportunities, understanding the Calcatoggio Airbnb data is crucial. Leveraging the low regulation environment is key to maximizing your short term rental income potential. Let's dive into the specifics.
Key Calcatoggio Airbnb Performance Metrics Overview
Monthly Airbnb Revenue Variations & Income Potential in Calcatoggio (2025)
Understanding the monthly revenue variations for Airbnb listings in Calcatoggio is key to maximizing your short term rental income potential. Seasonality significantly impacts earnings. Our analysis, based on data from the past 12 months, shows that the peak revenue month for STRs in Calcatoggio is typically August, while February often presents the lowest earnings, highlighting opportunities for strategic pricing adjustments during shoulder and low seasons. Explore the typical Airbnb income in Calcatoggio across different performance tiers:
- Best-in-class properties (Top 10%) achieve $3,376+ monthly, often utilizing dynamic pricing and superior guest experiences.
- Strong performing properties (Top 25%) earn $2,095 or more, indicating effective management and desirable locations/amenities.
- Typical properties (Median) generate around $1,293 per month, representing the average market performance.
- Entry-level properties (Bottom 25%) see earnings around $604, often with potential for optimization.
Average Monthly Airbnb Earnings Trend in Calcatoggio
Calcatoggio Airbnb Occupancy Rate Trends (2025)
Maximize your bookings by understanding the Calcatoggio STR occupancy trends. Seasonal demand shifts significantly influence how often properties are booked. Typically, Augustsees the highest demand (peak season occupancy), while January experiences the lowest (low season). Effective strategies, like adjusting minimum stays or offering promotions, can boost occupancy during slower periods. Here's how different property tiers perform in Calcatoggio:
- Best-in-class properties (Top 10%) achieve 70%+ occupancy, indicating high desirability and potentially optimized availability.
- Strong performing properties (Top 25%) maintain 54% or higher occupancy, suggesting good market fit and guest satisfaction.
- Typical properties (Median) have an occupancy rate around 35%.
- Entry-level properties (Bottom 25%) average 17% occupancy, potentially facing higher vacancy.
Average Monthly Occupancy Rate Trend in Calcatoggio
Average Daily Rate (ADR) Airbnb Trends in Calcatoggio (2025)
Effective short term rental pricing strategy in Calcatoggio involves understanding monthly ADR fluctuations. The Average Daily Rate (ADR) for Airbnb in Calcatoggio typically peaks in August and dips lowest during March. Leveraging Airbnb dynamic pricing tools or strategies based on this seasonality can significantly boost revenue. Here's a look at the typical nightly rates achieved:
- Best-in-class properties (Top 10%) command rates of $278+ per night, often due to premium features or locations.
- Strong performing properties (Top 25%) achieve nightly rates of $156 or more.
- Typical properties (Median) charge around $107 per night.
- Entry-level properties (Bottom 25%) earn around $82 per night.
Average Daily Rate (ADR) Trend by Month in Calcatoggio
Get Live Calcatoggio Market Intelligence 👇

Explore Real-time Analytics
Airbnb Seasonality Analysis & Trends in Calcatoggio (2025)
Peak Season (August, July, September)
- Revenue averages $3,005 per month
- Occupancy rates average 55.9%
- Daily rates average $187
Shoulder Season
- Revenue averages $1,634 per month
- Occupancy maintains around 35.1%
- Daily rates hold near $156
Low Season (January, February, March)
- Revenue drops to average $776 per month
- Occupancy decreases to average 22.1%
- Daily rates adjust to average $128
Seasonality Insights for Calcatoggio
- The Airbnb seasonality in Calcatoggio shows highly seasonal trends requiring careful strategy. While the sections above show seasonal averages, it's also insightful to look at the extremes:
- During the high season, the absolute peak month showcases Calcatoggio's highest earning potential, with monthly revenues capable of climbing to $3,855, occupancy reaching a high of 67.9%, and ADRs peaking at $194.
- Conversely, the slowest single month of the year, typically falling within the low season, marks the market's lowest point. In this month, revenue might dip to $686, occupancy could drop to 20.1%, and ADRs may adjust down to $127.
- Understanding both the seasonal averages and these monthly peaks and troughs in revenue, occupancy, and ADR is crucial for maximizing your Airbnb profit potential in Calcatoggio.
Seasonal Strategies for Maximizing Profit
- Peak Season: Maximize revenue through premium pricing and potentially longer minimum stays. Ensure high availability.
- Low Season: Offer competitive pricing, special promotions (e.g., extended stay discounts), and flexible cancellation policies. Target off-season travelers like remote workers or budget-conscious guests.
- Shoulder Seasons: Implement dynamic pricing that balances peak and low rates. Target weekend travelers or specific events. Offer slightly more flexible terms than peak season.
- Regularly analyze your own performance against these Calcatoggio seasonality benchmarks and adjust your pricing and availability strategy accordingly.
Best Areas for Airbnb Investment in Calcatoggio (2025)
Exploring the top neighborhoods for short-term rentals in Calcatoggio? This section highlights key areas, outlining why they are attractive for hosts and guests, along with notable local attractions. Consider these locations based on your target guest profile and investment strategy.
| Neighborhood / Area | Why Host Here? (Target Guests & Appeal) | Key Attractions & Landmarks |
|---|---|---|
| Calcatoggio Beach | Beautiful coastal area with stunning sandy beaches and clear waters, attracting tourists seeking sun and relaxation. Ideal for beachside accommodations that promise scenic views and accessibility to the sea. | Calcatoggio Beach, Plage de Stagnolu, Vignola, Calanques de Piana, Corte, Cascades de Piana |
| Villa de Calcatoggio | Charming village atmosphere with traditional Corsican architecture. Offers a glimpse into local culture and tranquility, making it appealing for guests looking for a quiet retreat away from the bustling tourist spots. | Local markets, Restaurants serving Corsican cuisine, Historic village center, Nearby hiking trails, Corsican wine tasting, Cultural events |
| Capo di Feno | Known for its rugged coastline and natural beauty, this area is a paradise for nature lovers and adventure seekers, offering opportunities for hiking and water sports. | Capo di Feno Beach, Hiking trails, Scenic viewpoints, Water sports activities, Wildlife watching, Photography spots |
| Cargèse | A picturesque coastal town famous for its Greek heritage and stunning views of the Mediterranean. Popular among tourists interested in history and culture. | Greek Orthodox Church, Historic sites, Beachfront cafes, Local artisan markets, Cargèse beaches, Scenic promenade |
| Porticcio | A vibrant resort town located just a short distance from Calcatoggio, known for its lively atmosphere and variety of amenities. Attracts families and groups looking for fun activities. | Porticcio Beach, Watersports facilities, Shopping centers, Restaurants and nightlife, Boat excursions, Family-friendly attractions |
| Sagone | A charming coastal area known for its natural beauty and family-friendly beaches. Offers various outdoor activities and a relaxed beach vibe, ideal for family vacations. | Sagone Beach, SNORKELING and diving spots, Hiking trails, Local restaurants, Fishing opportunities, Scenic coastline |
| L’Île-Rousse | A beautiful small island nearby that offers exclusive getaways featuring pristine beaches and luxurious retreats. A high-end option for guests looking for privacy and leisure. | Private beaches, Luxury villas, Spa services, Exclusive dining, Markt auf dem Platz, Water activities |
| Les Calanques | Famous for its dramatic cliffs and breathtaking views, this natural park is perfect for eco-tourism and adventure seekers. A great location for unique Airbnb experiences in nature. | Hiking routes, Secluded beaches, Nature photography, Scenic boat tours, Wildlife exploring, Outdoor adventures |
Understanding Airbnb License Requirements & STR Laws in Calcatoggio (2025)
While Calcatoggio, Corsica, France currently shows low STR regulations, specific Airbnb license requirements might still exist or change. Always verify the latest short term rental regulations and Airbnb license requirements directly with local government authorities for Calcatoggio to ensure full compliance before hosting.
(Source: AirROI data, 2025, based on 9% licensed listings)
Top Performing Airbnb Properties in Calcatoggio (2025)
Benchmark your potential! Explore examples of top-performing Airbnb properties in Calcatoggiobased on Trailing Twelve Month (TTM) revenue. Analyze their characteristics, revenue, occupancy rate, and ADR to understand what drives success in this market.
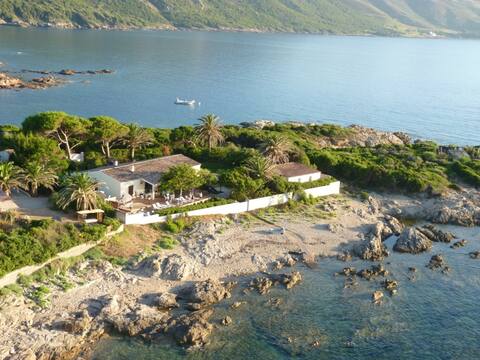
Luxury villa with access to the see
Entire Place • 7 bedrooms
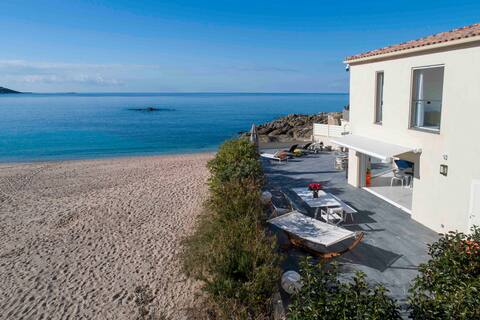
The house on the beach
Entire Place • 3 bedrooms
Mediterranean House in South Corsica
Entire Place • 4 bedrooms

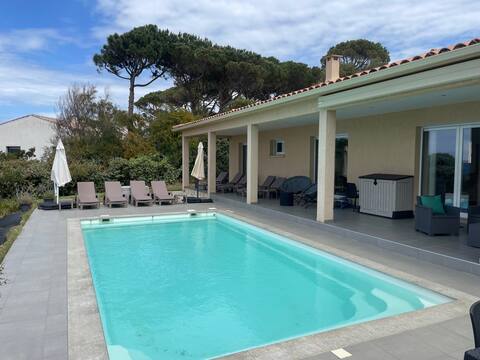
Stone house with panoramic views and pool
Entire Place • 5 bedrooms

Villa in Pevani, Corsica
Entire Place • 3 bedrooms
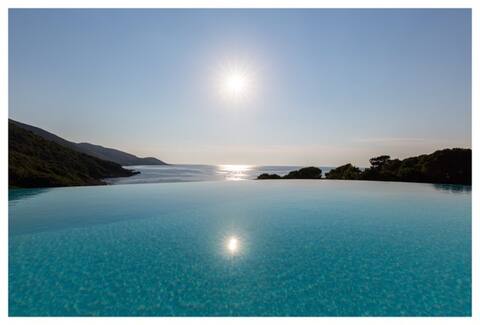
Beautiful villa with a waterfront pool
Entire Place • 3 bedrooms
Note: Performance varies based on location, size, amenities, seasonality, and management quality. Data reflects the past 12 months.
Top Performing Airbnb Hosts in Calcatoggio (2025)
Learn from the best! This table showcases top-performing Airbnb hosts in Calcatoggio based on the number of properties managed and estimated total revenue over the past year. Analyze their scale and performance metrics.
| Host Name | Properties | Grossing Revenue | Stay Reviews | Avg Rating |
|---|---|---|---|---|
| Residence | 21 | $115,521 | 396 | 4.43/5.0 |
| Josepha | 3 | $113,397 | 61 | 4.97/5.0 |
| Thierry | 1 | $96,062 | 29 | 4.83/5.0 |
| Isabelle | 3 | $95,935 | 74 | 4.76/5.0 |
| Jacques Et Sophie | 3 | $89,177 | 260 | 4.90/5.0 |
| Christine | 1 | $81,379 | 11 | 5.00/5.0 |
| Berangere | 3 | $52,557 | 159 | 4.84/5.0 |
| Mau | 2 | $48,976 | 11 | 4.92/5.0 |
| Carole | 5 | $48,770 | 102 | 4.56/5.0 |
| Christine | 2 | $43,051 | 82 | 5.00/5.0 |
Analyzing the strategies of top hosts, such as their property selection, pricing, and guest communication, can offer valuable lessons for optimizing your own Airbnb operations in Calcatoggio.
Dive Deeper: Advanced Calcatoggio STR Market Data (2025)
Ready to unlock more insights? AirROI provides access to advanced metrics and comprehensive Airbnb data for Calcatoggio. Explore detailed analytics beyond this report to refine your investment strategy, optimize pricing, and maximize your vacation rental profits.
Explore Advanced MetricsCalcatoggio Short-Term Rental Market Composition (2025): Property & Room Types
Room Type Distribution
Property Type Distribution
Market Composition Insights for Calcatoggio
- The Calcatoggio Airbnb market composition is heavily skewed towards Entire Home/Apt listings, which make up 94% of the 150 active rentals. This indicates strong guest preference for privacy and space.
- Looking at the property type distribution in Calcatoggio, Apartment/Condo properties are the most common (64%), reflecting the local real estate landscape.
- Houses represent a significant 30% portion, catering likely to families or larger groups.
- Smaller segments like hotel/boutique, others, outdoor/unique (combined 6.0%) offer potential for unique stay experiences.
Calcatoggio Airbnb Room Capacity Analysis (2025): Bedroom Distribution
Distribution of Listings by Number of Bedrooms
Room Capacity Insights for Calcatoggio
- The dominant room capacity in Calcatoggio is 1 bedroom listings, making up 45.3% of the market. This suggests a strong demand for properties suitable for couples or solo travelers.
- Together, 1 bedroom and 2 bedrooms properties represent 71.3% of the active Airbnb listings in Calcatoggio, indicating a high concentration in these sizes.
- A significant 21.9% of listings offer 3+ bedrooms, catering to larger groups and families seeking more space in Calcatoggio.
Calcatoggio Vacation Rental Guest Capacity Trends (2025)
Distribution of Listings by Guest Capacity
Guest Capacity Insights for Calcatoggio
- The most common guest capacity trend in Calcatoggio vacation rentals is listings accommodating 4 guests (41.3%). This suggests the primary traveler segment is likely small families or groups.
- Properties designed for 4 guests and 6 guests dominate the Calcatoggio STR market, accounting for 64.0% of listings.
- 31.3% of properties accommodate 6+ guests, serving the market segment for larger families or group travel in Calcatoggio.
- On average, properties in Calcatoggio are equipped to host 4.5 guests.
Calcatoggio Airbnb Booking Patterns (2025): Available vs. Booked Days
Available Days Distribution
Booked Days Distribution
Booking Pattern Insights for Calcatoggio
- The most common availability pattern in Calcatoggio falls within the 271-366 days range, representing 63.3% of listings. This suggests many properties have significant open periods on their calendars.
- Approximately 92.0% of listings show high availability (181+ days open annually), indicating potential for increased bookings or specific owner usage patterns.
- For booked days, the 31-90 days range is most frequent in Calcatoggio (35.3%), reflecting common guest stay durations or potential owner blocking patterns.
- A notable 8.0% of properties secure long booking periods (181+ days booked per year), highlighting successful long-term rental strategies or significant owner usage.
Calcatoggio Airbnb Minimum Stay Requirements Analysis
Distribution of Listings by Minimum Night Requirement
1 Night
15 listings
10.3% of total
2 Nights
7 listings
4.8% of total
3 Nights
30 listings
20.7% of total
4-6 Nights
53 listings
36.6% of total
7-29 Nights
35 listings
24.1% of total
30+ Nights
5 listings
3.4% of total
Key Insights
- The most prevalent minimum stay requirement in Calcatoggio is 4-6 Nights, adopted by 36.6% of listings. This highlights the market's preference for longer commitments.
- Very short stays (1-2 nights) are less common (15.1%), suggesting hosts prefer slightly longer bookings to optimize turnover.
Recommendations
- Align with the market by considering a 4-6 Nights minimum stay, as 36.6% of Calcatoggio hosts use this setting.
- If feasible, allowing 1-night stays, especially midweek or during low season, could capture last-minute bookings, as only 10.3% currently do.
- Adjust minimum nights based on seasonality – potentially shorter during low season and longer during peak demand periods in Calcatoggio.
Calcatoggio Airbnb Cancellation Policy Trends Analysis (2025)
Super Strict 60 Days
3 listings
2.2% of total
Non-refundable
1 listings
0.7% of total
Flexible
17 listings
12.7% of total
Moderate
42 listings
31.3% of total
Firm
35 listings
26.1% of total
Strict
36 listings
26.9% of total
Cancellation Policy Insights for Calcatoggio
- The prevailing Airbnb cancellation policy trend in Calcatoggio is Moderate, used by 31.3% of listings.
- A majority (53.0%) of hosts in Calcatoggio utilize Firm or Strict policies, indicating a market where hosts prioritize booking security.
Recommendations for Hosts
- Consider adopting a Moderate policy to align with the 31.3% market standard in Calcatoggio.
- Regularly review your cancellation policy against competitors and market demand shifts in Calcatoggio.
Calcatoggio STR Booking Lead Time Analysis (2025)
Average Booking Lead Time by Month
Booking Lead Time Insights for Calcatoggio
- The overall average booking lead time for vacation rentals in Calcatoggio is 88 days.
- Guests book furthest in advance for stays during July (average 130 days), likely coinciding with peak travel demand or local events.
- The shortest booking windows occur for stays in February (average 21 days), indicating more last-minute travel plans during this time.
- Seasonally, Summer (118 days avg.) sees the longest lead times, while Winter (42 days avg.) has the shortest, reflecting typical travel planning cycles.
Recommendations for Hosts
- Use the overall average lead time (88 days) as a baseline for your pricing and availability strategy in Calcatoggio.
- For July stays, consider implementing length-of-stay discounts or slightly higher rates for bookings made less than 130 days out to capitalize on advance planning.
- Target marketing efforts for the Summer season well in advance (at least 118 days) to capture early planners.
- Monitor your own booking lead times against these Calcatoggio averages to identify opportunities for dynamic pricing adjustments.
Popular & Essential Airbnb Amenities in Calcatoggio (2025)
Amenity Prevalence
Amenity Insights for Calcatoggio
- Essential amenities in Calcatoggio that guests expect include: Kitchen, Washer, Free parking on premises. Lacking these (any) could significantly impact bookings.
- Popular amenities like TV, Heating, Hot water are common but not universal. Offering these can provide a competitive edge.
- Warning: Wifi is not universally provided but is considered essential globally. Ensure reliable Wifi is offered.
Recommendations for Hosts
- Ensure your listing includes all essential amenities for Calcatoggio: Kitchen, Washer, Free parking on premises.
- Prioritize adding missing essentials: Kitchen, Washer, Free parking on premises.
- Consider adding popular differentiators like TV or Heating to increase appeal.
- Highlight unique or less common amenities you offer (e.g., hot tub, dedicated workspace, EV charger) in your listing description and photos.
- Regularly check competitor amenities in Calcatoggio to stay competitive.
Calcatoggio Airbnb Guest Demographics & Profile Analysis (2025)
Guest Profile Summary for Calcatoggio
- The typical guest profile for Airbnb in Calcatoggio consists of a mix of domestic (65%) and international guests, often arriving from nearby Paris, typically belonging to the Post-2000s (Gen Z/Alpha) group (50%), primarily speaking English or French.
- Domestic travelers account for 64.6% of guests.
- Key international markets include France (64.6%) and Germany (14.1%).
- Top languages spoken are English (34.5%) followed by French (31.9%).
- A significant demographic segment is the Post-2000s (Gen Z/Alpha) group, representing 50% of guests.
Recommendations for Hosts
- Target domestic marketing efforts towards travelers from Paris and Lyon.
- Tailor amenities and listing descriptions to appeal to the dominant Post-2000s (Gen Z/Alpha) demographic (e.g., highlight fast WiFi, smart home features, local guides).
- Highlight unique local experiences or amenities relevant to the primary guest profile.
- Consider seasonal promotions aligned with peak travel times for key origin markets.
Nearby Short-Term Rental Market Comparison
How does the Calcatoggio Airbnb market stack up against its neighbors? Compare key performance metrics like average monthly revenue, ADR, and occupancy rates in surrounding areas to understand the broader regional STR landscape.
| Market | Active Properties | Monthly Revenue | Daily Rate | Avg. Occupancy |
|---|---|---|---|---|
| Saint-Jean-Cap-Ferrat | 107 | $3,844 | $424.21 | 46% |
| Èze | 153 | $3,168 | $345.84 | 47% |
| Villefranche-sur-Mer | 501 | $2,977 | $268.57 | 52% |
| Porto Cervo | 211 | $2,819 | $463.39 | 42% |
| Monaco | 184 | $2,817 | $421.75 | 39% |
| Cap-d'Ail | 175 | $2,795 | $307.97 | 45% |
| Saint-Paul-de-Vence | 160 | $2,728 | $325.77 | 45% |
| Beausoleil | 546 | $2,718 | $244.38 | 48% |
| Blausasc | 14 | $2,487 | $156.59 | 53% |
| Tourrettes-sur-Loup | 181 | $2,412 | $344.60 | 45% |