Barbaggio Airbnb Market Analysis 2025: Short Term Rental Data & Vacation Rental Statistics in Corsica, France
Is Airbnb profitable in Barbaggio in 2025? Explore comprehensive Airbnb analytics for Barbaggio, Corsica, France to uncover income potential. This 2025 STR market report for Barbaggio, based on AirROI data from April 2024 to March 2025, reveals key trends in the niche market of 31 active listings.
Whether you're considering an Airbnb investment in Barbaggio, optimizing your existing vacation rental, or exploring rental arbitrage opportunities, understanding the Barbaggio Airbnb data is crucial. Leveraging the low regulation environment is key to maximizing your short term rental income potential. Let's dive into the specifics.
Key Barbaggio Airbnb Performance Metrics Overview
Monthly Airbnb Revenue Variations & Income Potential in Barbaggio (2025)
Understanding the monthly revenue variations for Airbnb listings in Barbaggio is key to maximizing your short term rental income potential. Seasonality significantly impacts earnings. Our analysis, based on data from the past 12 months, shows that the peak revenue month for STRs in Barbaggio is typically August, while November often presents the lowest earnings, highlighting opportunities for strategic pricing adjustments during shoulder and low seasons. Explore the typical Airbnb income in Barbaggio across different performance tiers:
- Best-in-class properties (Top 10%) achieve $4,868+ monthly, often utilizing dynamic pricing and superior guest experiences.
- Strong performing properties (Top 25%) earn $2,956 or more, indicating effective management and desirable locations/amenities.
- Typical properties (Median) generate around $1,573 per month, representing the average market performance.
- Entry-level properties (Bottom 25%) see earnings around $789, often with potential for optimization.
Average Monthly Airbnb Earnings Trend in Barbaggio
Barbaggio Airbnb Occupancy Rate Trends (2025)
Maximize your bookings by understanding the Barbaggio STR occupancy trends. Seasonal demand shifts significantly influence how often properties are booked. Typically, Augustsees the highest demand (peak season occupancy), while January experiences the lowest (low season). Effective strategies, like adjusting minimum stays or offering promotions, can boost occupancy during slower periods. Here's how different property tiers perform in Barbaggio:
- Best-in-class properties (Top 10%) achieve 62%+ occupancy, indicating high desirability and potentially optimized availability.
- Strong performing properties (Top 25%) maintain 47% or higher occupancy, suggesting good market fit and guest satisfaction.
- Typical properties (Median) have an occupancy rate around 28%.
- Entry-level properties (Bottom 25%) average 18% occupancy, potentially facing higher vacancy.
Average Monthly Occupancy Rate Trend in Barbaggio
Average Daily Rate (ADR) Airbnb Trends in Barbaggio (2025)
Effective short term rental pricing strategy in Barbaggio involves understanding monthly ADR fluctuations. The Average Daily Rate (ADR) for Airbnb in Barbaggio typically peaks in July and dips lowest during March. Leveraging Airbnb dynamic pricing tools or strategies based on this seasonality can significantly boost revenue. Here's a look at the typical nightly rates achieved:
- Best-in-class properties (Top 10%) command rates of $294+ per night, often due to premium features or locations.
- Strong performing properties (Top 25%) achieve nightly rates of $224 or more.
- Typical properties (Median) charge around $135 per night.
- Entry-level properties (Bottom 25%) earn around $107 per night.
Average Daily Rate (ADR) Trend by Month in Barbaggio
Get Live Barbaggio Market Intelligence 👇

Explore Real-time Analytics
Airbnb Seasonality Analysis & Trends in Barbaggio (2025)
Peak Season (August, July, June)
- Revenue averages $3,681 per month
- Occupancy rates average 54.0%
- Daily rates average $194
Shoulder Season
- Revenue averages $1,966 per month
- Occupancy maintains around 29.1%
- Daily rates hold near $165
Low Season (February, March, November)
- Revenue drops to average $805 per month
- Occupancy decreases to average 18.4%
- Daily rates adjust to average $151
Seasonality Insights for Barbaggio
- The Airbnb seasonality in Barbaggio shows highly seasonal trends requiring careful strategy. While the sections above show seasonal averages, it's also insightful to look at the extremes:
- During the high season, the absolute peak month showcases Barbaggio's highest earning potential, with monthly revenues capable of climbing to $4,367, occupancy reaching a high of 68.7%, and ADRs peaking at $201.
- Conversely, the slowest single month of the year, typically falling within the low season, marks the market's lowest point. In this month, revenue might dip to $752, occupancy could drop to 6.5%, and ADRs may adjust down to $149.
- Understanding both the seasonal averages and these monthly peaks and troughs in revenue, occupancy, and ADR is crucial for maximizing your Airbnb profit potential in Barbaggio.
Seasonal Strategies for Maximizing Profit
- Peak Season: Maximize revenue through premium pricing and potentially longer minimum stays. Ensure high availability.
- Low Season: Offer competitive pricing, special promotions (e.g., extended stay discounts), and flexible cancellation policies. Target off-season travelers like remote workers or budget-conscious guests.
- Shoulder Seasons: Implement dynamic pricing that balances peak and low rates. Target weekend travelers or specific events. Offer slightly more flexible terms than peak season.
- Regularly analyze your own performance against these Barbaggio seasonality benchmarks and adjust your pricing and availability strategy accordingly.
Best Areas for Airbnb Investment in Barbaggio (2025)
Exploring the top neighborhoods for short-term rentals in Barbaggio? This section highlights key areas, outlining why they are attractive for hosts and guests, along with notable local attractions. Consider these locations based on your target guest profile and investment strategy.
| Neighborhood / Area | Why Host Here? (Target Guests & Appeal) | Key Attractions & Landmarks |
|---|---|---|
| Centro Storico | Historic center of Barbaggio known for its charming narrow streets and traditional Corsican architecture. An ideal location for guests wanting to experience the local culture and heritage. | Sant'Appianu Church, Villa Baccicine, Corsican vineyards, Scenic viewpoints |
| Mount San Petrone | A beautiful mountain area offering breathtaking views and outdoor activities. Perfect for nature lovers and those seeking tranquility away from the busy beach locations. | Hiking trails, Wildlife viewing, Picnic areas, Stunning vistas |
| Barbaggio Wine Route | The renowned wine region surrounding Barbaggio features vineyards and wine tours. Ideal for wine enthusiasts and tourists interested in Corsican culinary experiences. | Local wineries, Wine tasting tours, Gourmet restaurants, Wine festivals |
| Porticciolo Beach | A serene beach area known for its clear waters and scenic surroundings. Excellent for those looking to relax by the sea while still being close to Barbaggio. | Swimming, Sunbathing, Local restaurants, Hiking paths nearby |
| Tiuccia Beach | Popular beach destination for families and travelers, offering various water sports and family-friendly activities. A vibrant spot during the tourist season. | Water sports, Beachside cafes, Children's play areas |
| St. Florent | A nearby town offering a vibrant marina and beautiful beaches. Great for those wanting to explore a traditional Corsican port town with a lively atmosphere. | St. Florent port, Beach clubs, Local markets, Historic sites |
| Cap Corse | A stunning part of Corsica known for its rugged coastline and scenic drives. Perfect for visitors looking to explore nature and picturesque villages. | Scenic drives, Hiking trails, Charming villages, Coastal views |
| Corte | A bit further inland, Corte is known for its stunning mountain scenery and historical significance. A great base for exploring central Corsica and enjoying outdoor activities. | Restonica Valley, Maupertus Fort, Corte National Museum, Hiking trails |
Understanding Airbnb License Requirements & STR Laws in Barbaggio (2025)
While Barbaggio, Corsica, France currently shows low STR regulations, specific Airbnb license requirements might still exist or change. Always verify the latest short term rental regulations and Airbnb license requirements directly with local government authorities for Barbaggio to ensure full compliance before hosting.
(Source: AirROI data, 2025, based on 3% licensed listings)
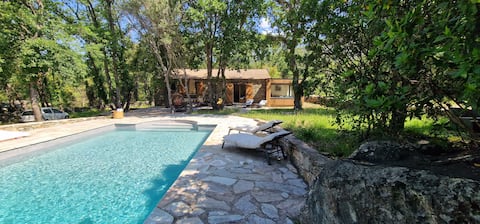
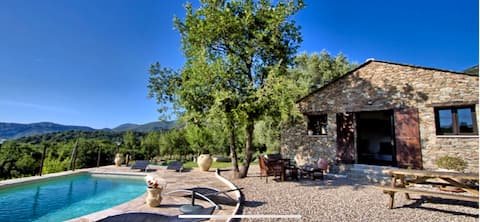
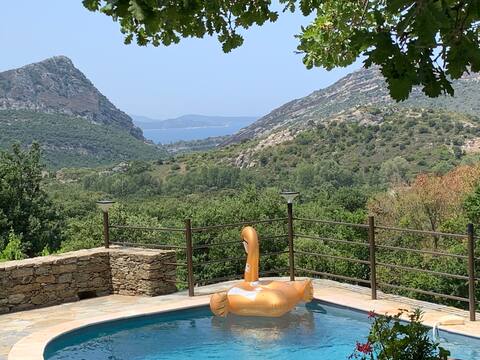
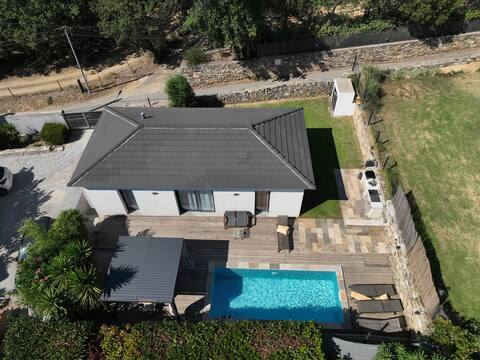
Top Performing Airbnb Properties in Barbaggio (2025)
Benchmark your potential! Explore examples of top-performing Airbnb properties in Barbaggiobased on Trailing Twelve Month (TTM) revenue. Analyze their characteristics, revenue, occupancy rate, and ADR to understand what drives success in this market.
Villa Bergerie Baracco Argia
Entire Place • 3 bedrooms

T3 Pool with garden Near St-Florent
Entire Place • 2 bedrooms
VILLA L OLIVIER heated swimming pool near St Florent
Entire Place • 3 bedrooms
VILLA L OSTERIA heated pool near St Florent
Entire Place • 2 bedrooms

In the gardens of Foata in the shade of eucalyptus
Entire Place • 1 bedroom
CHARMING VILLA, Private/heated Pool
Entire Place • 2 bedrooms
Note: Performance varies based on location, size, amenities, seasonality, and management quality. Data reflects the past 12 months.
Top Performing Airbnb Hosts in Barbaggio (2025)
Learn from the best! This table showcases top-performing Airbnb hosts in Barbaggio based on the number of properties managed and estimated total revenue over the past year. Analyze their scale and performance metrics.
| Host Name | Properties | Grossing Revenue | Stay Reviews | Avg Rating |
|---|---|---|---|---|
| Caroline | 2 | $83,969 | 63 | 4.97/5.0 |
| Anthony | 1 | $60,239 | 8 | 5.00/5.0 |
| Florian | 6 | $60,128 | 48 | 3.66/5.0 |
| Alexandre | 2 | $53,030 | 8 | 2.50/5.0 |
| Charlotte | 3 | $33,827 | 27 | 3.33/5.0 |
| Mikael | 2 | $30,313 | 93 | 5.00/5.0 |
| Xavier | 2 | $26,002 | 49 | 4.18/5.0 |
| Julien | 2 | $17,692 | 23 | 4.46/5.0 |
| Catherine | 1 | $17,309 | 10 | 5.00/5.0 |
| Christine | 1 | $16,058 | 3 | 4.67/5.0 |
Analyzing the strategies of top hosts, such as their property selection, pricing, and guest communication, can offer valuable lessons for optimizing your own Airbnb operations in Barbaggio.
Dive Deeper: Advanced Barbaggio STR Market Data (2025)
Ready to unlock more insights? AirROI provides access to advanced metrics and comprehensive Airbnb data for Barbaggio. Explore detailed analytics beyond this report to refine your investment strategy, optimize pricing, and maximize your vacation rental profits.
Explore Advanced MetricsBarbaggio Short-Term Rental Market Composition (2025): Property & Room Types
Room Type Distribution
Property Type Distribution
Market Composition Insights for Barbaggio
- The Barbaggio Airbnb market composition is heavily skewed towards Entire Home/Apt listings, which make up 93.5% of the 31 active rentals. This indicates strong guest preference for privacy and space.
- Looking at the property type distribution in Barbaggio, House properties are the most common (54.8%), reflecting the local real estate landscape.
- Houses represent a significant 54.8% portion, catering likely to families or larger groups.
- The presence of 6.5% Hotel/Boutique listings indicates integration with traditional hospitality.
Barbaggio Airbnb Room Capacity Analysis (2025): Bedroom Distribution
Distribution of Listings by Number of Bedrooms
Room Capacity Insights for Barbaggio
- The dominant room capacity in Barbaggio is 2 bedrooms listings, making up 54.8% of the market. This suggests a strong demand for properties suitable for couples or solo travelers.
- Together, 2 bedrooms and 1 bedroom properties represent 74.2% of the active Airbnb listings in Barbaggio, indicating a high concentration in these sizes.
Barbaggio Vacation Rental Guest Capacity Trends (2025)
Distribution of Listings by Guest Capacity
Guest Capacity Insights for Barbaggio
- The most common guest capacity trend in Barbaggio vacation rentals is listings accommodating 4 guests (41.9%). This suggests the primary traveler segment is likely small families or groups.
- Properties designed for 4 guests and 2 guests dominate the Barbaggio STR market, accounting for 61.3% of listings.
- 25.8% of properties accommodate 6+ guests, serving the market segment for larger families or group travel in Barbaggio.
- On average, properties in Barbaggio are equipped to host 4.4 guests.
Barbaggio Airbnb Booking Patterns (2025): Available vs. Booked Days
Available Days Distribution
Booked Days Distribution
Booking Pattern Insights for Barbaggio
- The most common availability pattern in Barbaggio falls within the 271-366 days range, representing 61.3% of listings. This suggests many properties have significant open periods on their calendars.
- Approximately 96.8% of listings show high availability (181+ days open annually), indicating potential for increased bookings or specific owner usage patterns.
- For booked days, the 91-180 days range is most frequent in Barbaggio (35.5%), reflecting common guest stay durations or potential owner blocking patterns.
- A notable 3.2% of properties secure long booking periods (181+ days booked per year), highlighting successful long-term rental strategies or significant owner usage.
Barbaggio Airbnb Minimum Stay Requirements Analysis
Distribution of Listings by Minimum Night Requirement
1 Night
3 listings
10.3% of total
2 Nights
5 listings
17.2% of total
3 Nights
8 listings
27.6% of total
4-6 Nights
9 listings
31% of total
7-29 Nights
2 listings
6.9% of total
30+ Nights
2 listings
6.9% of total
Key Insights
- The most prevalent minimum stay requirement in Barbaggio is 4-6 Nights, adopted by 31% of listings. This highlights the market's preference for longer commitments.
Recommendations
- Align with the market by considering a 4-6 Nights minimum stay, as 31% of Barbaggio hosts use this setting.
- If feasible, allowing 1-night stays, especially midweek or during low season, could capture last-minute bookings, as only 10.3% currently do.
- Explore offering discounts for stays of 30+ nights to attract the 6.9% of the market seeking extended stays.
- Adjust minimum nights based on seasonality – potentially shorter during low season and longer during peak demand periods in Barbaggio.
Barbaggio Airbnb Cancellation Policy Trends Analysis (2025)
Flexible
5 listings
20.8% of total
Moderate
4 listings
16.7% of total
Firm
9 listings
37.5% of total
Strict
6 listings
25% of total
Cancellation Policy Insights for Barbaggio
- The prevailing Airbnb cancellation policy trend in Barbaggio is Firm, used by 37.5% of listings.
- A majority (62.5%) of hosts in Barbaggio utilize Firm or Strict policies, indicating a market where hosts prioritize booking security.
Recommendations for Hosts
- Consider adopting a Firm policy to align with the 37.5% market standard in Barbaggio.
- Regularly review your cancellation policy against competitors and market demand shifts in Barbaggio.
Barbaggio STR Booking Lead Time Analysis (2025)
Average Booking Lead Time by Month
Booking Lead Time Insights for Barbaggio
- The overall average booking lead time for vacation rentals in Barbaggio is 75 days.
- Guests book furthest in advance for stays during June (average 131 days), likely coinciding with peak travel demand or local events.
- The shortest booking windows occur for stays in February (average 21 days), indicating more last-minute travel plans during this time.
- Seasonally, Summer (111 days avg.) sees the longest lead times, while Winter (47 days avg.) has the shortest, reflecting typical travel planning cycles.
Recommendations for Hosts
- Use the overall average lead time (75 days) as a baseline for your pricing and availability strategy in Barbaggio.
- For June stays, consider implementing length-of-stay discounts or slightly higher rates for bookings made less than 131 days out to capitalize on advance planning.
- Target marketing efforts for the Summer season well in advance (at least 111 days) to capture early planners.
- Monitor your own booking lead times against these Barbaggio averages to identify opportunities for dynamic pricing adjustments.
Popular & Essential Airbnb Amenities in Barbaggio (2025)
Amenity Prevalence
Amenity Insights for Barbaggio
- Essential amenities in Barbaggio that guests expect include: Heating, Wifi, Hot water. Lacking these (any) could significantly impact bookings.
- Popular amenities like TV, Essentials, Kitchen are common but not universal. Offering these can provide a competitive edge.
Recommendations for Hosts
- Ensure your listing includes all essential amenities for Barbaggio: Heating, Wifi, Hot water.
- Prioritize adding missing essentials: Wifi, Hot water.
- Consider adding popular differentiators like TV or Essentials to increase appeal.
- Highlight unique or less common amenities you offer (e.g., hot tub, dedicated workspace, EV charger) in your listing description and photos.
- Regularly check competitor amenities in Barbaggio to stay competitive.
Barbaggio Airbnb Guest Demographics & Profile Analysis (2025)
Guest Profile Summary for Barbaggio
- The typical guest profile for Airbnb in Barbaggio consists of a mix of domestic (60%) and international guests, often arriving from nearby Paris, typically belonging to the Post-2000s (Gen Z/Alpha) group (50%), primarily speaking English or French.
- Domestic travelers account for 59.8% of guests.
- Key international markets include France (59.8%) and Switzerland (8.5%).
- Top languages spoken are English (36.3%) followed by French (28.7%).
- A significant demographic segment is the Post-2000s (Gen Z/Alpha) group, representing 50% of guests.
Recommendations for Hosts
- Balance marketing efforts between domestic and international channels based on the guest mix.
- Tailor amenities and listing descriptions to appeal to the dominant Post-2000s (Gen Z/Alpha) demographic (e.g., highlight fast WiFi, smart home features, local guides).
- Highlight unique local experiences or amenities relevant to the primary guest profile.
- Consider seasonal promotions aligned with peak travel times for key origin markets.
Nearby Short-Term Rental Market Comparison
How does the Barbaggio Airbnb market stack up against its neighbors? Compare key performance metrics like average monthly revenue, ADR, and occupancy rates in surrounding areas to understand the broader regional STR landscape.
| Market | Active Properties | Monthly Revenue | Daily Rate | Avg. Occupancy |
|---|---|---|---|---|
| Crespina | 16 | $3,526 | $493.64 | 48% |
| Castelfranco di Sotto | 47 | $2,881 | $294.54 | 38% |
| Porto Cervo | 211 | $2,819 | $463.39 | 42% |
| Poltu Quatu | 58 | $2,272 | $314.25 | 47% |
| Forte dei Marmi | 180 | $2,272 | $454.63 | 35% |
| Capannori | 480 | $2,219 | $317.48 | 39% |
| Pieve a Nievole | 21 | $2,099 | $262.37 | 36% |
| San Rocco | 23 | $2,088 | $228.42 | 39% |
| Murato | 10 | $2,063 | $191.89 | 46% |
| Alzachèna/Arzachena | 391 | $2,005 | $387.72 | 42% |