Villandry Airbnb Market Analysis 2025: Short Term Rental Data & Vacation Rental Statistics in Centre-Val de Loire, France
Is Airbnb profitable in Villandry in 2025? Explore comprehensive Airbnb analytics for Villandry, Centre-Val de Loire, France to uncover income potential. This 2025 STR market report for Villandry, based on AirROI data from April 2024 to March 2025, reveals key trends in the niche market of 28 active listings.
Whether you're considering an Airbnb investment in Villandry, optimizing your existing vacation rental, or exploring rental arbitrage opportunities, understanding the Villandry Airbnb data is crucial. Leveraging the low regulation environment is key to maximizing your short term rental income potential. Let's dive into the specifics.
Key Villandry Airbnb Performance Metrics Overview
Monthly Airbnb Revenue Variations & Income Potential in Villandry (2025)
Understanding the monthly revenue variations for Airbnb listings in Villandry is key to maximizing your short term rental income potential. Seasonality significantly impacts earnings. Our analysis, based on data from the past 12 months, shows that the peak revenue month for STRs in Villandry is typically August, while November often presents the lowest earnings, highlighting opportunities for strategic pricing adjustments during shoulder and low seasons. Explore the typical Airbnb income in Villandry across different performance tiers:
- Best-in-class properties (Top 10%) achieve $4,455+ monthly, often utilizing dynamic pricing and superior guest experiences.
- Strong performing properties (Top 25%) earn $2,883 or more, indicating effective management and desirable locations/amenities.
- Typical properties (Median) generate around $1,167 per month, representing the average market performance.
- Entry-level properties (Bottom 25%) see earnings around $726, often with potential for optimization.
Average Monthly Airbnb Earnings Trend in Villandry
Villandry Airbnb Occupancy Rate Trends (2025)
Maximize your bookings by understanding the Villandry STR occupancy trends. Seasonal demand shifts significantly influence how often properties are booked. Typically, Augustsees the highest demand (peak season occupancy), while January experiences the lowest (low season). Effective strategies, like adjusting minimum stays or offering promotions, can boost occupancy during slower periods. Here's how different property tiers perform in Villandry:
- Best-in-class properties (Top 10%) achieve 59%+ occupancy, indicating high desirability and potentially optimized availability.
- Strong performing properties (Top 25%) maintain 41% or higher occupancy, suggesting good market fit and guest satisfaction.
- Typical properties (Median) have an occupancy rate around 28%.
- Entry-level properties (Bottom 25%) average 15% occupancy, potentially facing higher vacancy.
Average Monthly Occupancy Rate Trend in Villandry
Average Daily Rate (ADR) Airbnb Trends in Villandry (2025)
Effective short term rental pricing strategy in Villandry involves understanding monthly ADR fluctuations. The Average Daily Rate (ADR) for Airbnb in Villandry typically peaks in December and dips lowest during October. Leveraging Airbnb dynamic pricing tools or strategies based on this seasonality can significantly boost revenue. Here's a look at the typical nightly rates achieved:
- Best-in-class properties (Top 10%) command rates of $469+ per night, often due to premium features or locations.
- Strong performing properties (Top 25%) achieve nightly rates of $284 or more.
- Typical properties (Median) charge around $138 per night.
- Entry-level properties (Bottom 25%) earn around $86 per night.
Average Daily Rate (ADR) Trend by Month in Villandry
Get Live Villandry Market Intelligence 👇

Explore Real-time Analytics
Airbnb Seasonality Analysis & Trends in Villandry (2025)
Peak Season (August, July, March)
- Revenue averages $3,703 per month
- Occupancy rates average 41.2%
- Daily rates average $242
Shoulder Season
- Revenue averages $2,431 per month
- Occupancy maintains around 29.0%
- Daily rates hold near $234
Low Season (April, October, November)
- Revenue drops to average $1,619 per month
- Occupancy decreases to average 25.5%
- Daily rates adjust to average $211
Seasonality Insights for Villandry
- The Airbnb seasonality in Villandry shows highly seasonal trends requiring careful strategy. While the sections above show seasonal averages, it's also insightful to look at the extremes:
- During the high season, the absolute peak month showcases Villandry's highest earning potential, with monthly revenues capable of climbing to $4,081, occupancy reaching a high of 47.4%, and ADRs peaking at $249.
- Conversely, the slowest single month of the year, typically falling within the low season, marks the market's lowest point. In this month, revenue might dip to $1,568, occupancy could drop to 18.4%, and ADRs may adjust down to $191.
- Understanding both the seasonal averages and these monthly peaks and troughs in revenue, occupancy, and ADR is crucial for maximizing your Airbnb profit potential in Villandry.
Seasonal Strategies for Maximizing Profit
- Peak Season: Maximize revenue through premium pricing and potentially longer minimum stays. Ensure high availability.
- Low Season: Offer competitive pricing, special promotions (e.g., extended stay discounts), and flexible cancellation policies. Target off-season travelers like remote workers or budget-conscious guests.
- Shoulder Seasons: Implement dynamic pricing that balances peak and low rates. Target weekend travelers or specific events. Offer slightly more flexible terms than peak season.
- Regularly analyze your own performance against these Villandry seasonality benchmarks and adjust your pricing and availability strategy accordingly.
Best Areas for Airbnb Investment in Villandry (2025)
Exploring the top neighborhoods for short-term rentals in Villandry? This section highlights key areas, outlining why they are attractive for hosts and guests, along with notable local attractions. Consider these locations based on your target guest profile and investment strategy.
| Neighborhood / Area | Why Host Here? (Target Guests & Appeal) | Key Attractions & Landmarks |
|---|---|---|
| Château de Villandry | Famous for its exquisite Renaissance gardens and stunning architecture. A must-see for tourists who appreciate history, beauty, and culture, making it a prime spot for Airbnb hosting. | Château de Villandry, Villandry Gardens, Parc de loisirs de la Duneau, Loire à Vélo, Les Jardins de La Chatonnière |
| Tours City Centre | A vibrant area filled with shops, dining, and cultural landmarks. Close to the Loire River, it attracts visitors looking for urban experiences and convenient access to historical sites. | Cathédrale Saint-Gatien, Place Plumereau, Musée des Beaux-Arts, Touraine Culture, Loire River Cruises |
| Amboise | A charming town famous for its own château and historical significance, being the former residence of Leonardo da Vinci. Tourists love it for its quaint atmosphere and rich history. | Château d'Amboise, Clos Lucé, Le Château du Rouvre, Amboise Market, La Pagode |
| Azay-le-Rideau | Known for its picturesque château set on an island in the Indre river, this quaint village appeals to visitors seeking romance and tranquility alongside rich history. | Château d'Azay-le-Rideau, Musee de l'Illustration, Indre River walks, Market in Azay-le-Rideau, Les Jardins de la Chatonnière |
| Saumur | Famous for its wines and picturesque château overlooking the Loire, Saumur attracts both wine enthusiasts and history buffs looking for an authentic French experience. | Château de Saumur, Saumur Wine Tasting, Troglodyte Caves, Le Cadre Noir, Saumur city center |
| Blois | A historic town with its impressive château and essential links to French royalty. Visitors flock to Blois for its rich history and beautiful architecture, ideal for cultural tourism. | Château de Blois, Maison de la magie, Blois old town, Loire Valley vineyards, Blois Cathedral |
| Chinon | Renowned for its medieval castle and wine production, Chinon draws in tourists who are interested in wine tours and exploring France's medieval history. | Château de Chinon, La Forteresse de Chinon, Wine cellars of Chinon, Vigne du Château, Théâtre de Chinon |
| Montbazon | A small village with historical significance and the nearby Château de Montbazon, appealing to those looking for a quiet retreat close to larger attractions in the area. | Château de Montbazon, Parc des expositions de Tours, Cycling on Loire à Vélo, Les Jardins d'Émeraude, Hiking trails |
Understanding Airbnb License Requirements & STR Laws in Villandry (2025)
While Villandry, Centre-Val de Loire, France currently shows low STR regulations, specific Airbnb license requirements might still exist or change. Always verify the latest short term rental regulations and Airbnb license requirements directly with local government authorities for Villandry to ensure full compliance before hosting.
(Source: AirROI data, 2025, finding no licensed listings among those analyzed)
Top Performing Airbnb Properties in Villandry (2025)
Benchmark your potential! Explore examples of top-performing Airbnb properties in Villandrybased on Trailing Twelve Month (TTM) revenue. Analyze their characteristics, revenue, occupancy rate, and ADR to understand what drives success in this market.
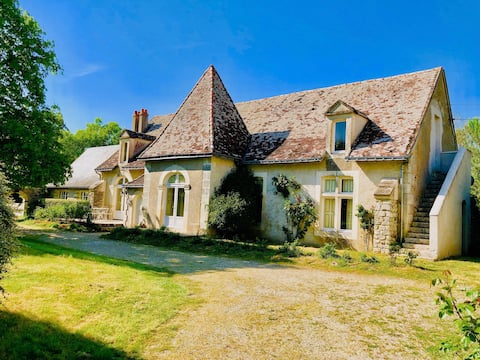
Domaine de l 'Augeonnière Villandry (20 people)
Entire Place • 10 bedrooms
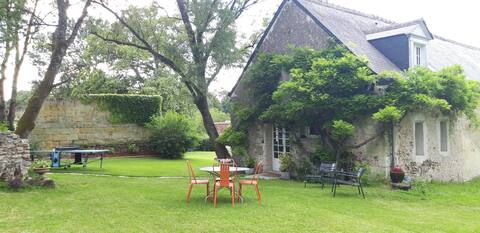
La Belle Epoque Métairie du Château de Villandry
Entire Place • 4 bedrooms
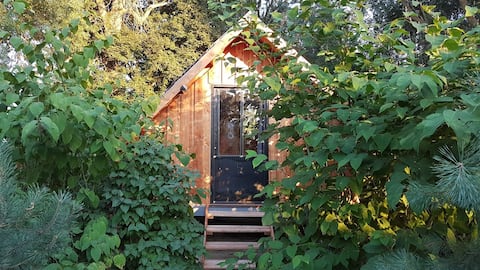
Star Camp - Nature Cabin
Private Room • 4 bedrooms

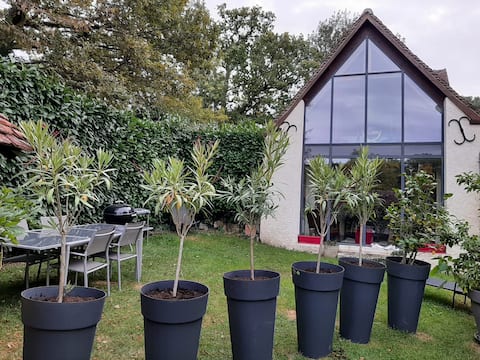
Les Colombiens du Bout du Monde
Entire Place • 3 bedrooms
Gîte de charme 4 pers. /Piscine. Gîte la bergerie
Entire Place • 2 bedrooms
Gite in the heart of the Châteaux of the Loire Valley
Entire Place • 1 bedroom
Note: Performance varies based on location, size, amenities, seasonality, and management quality. Data reflects the past 12 months.
Top Performing Airbnb Hosts in Villandry (2025)
Learn from the best! This table showcases top-performing Airbnb hosts in Villandry based on the number of properties managed and estimated total revenue over the past year. Analyze their scale and performance metrics.
| Host Name | Properties | Grossing Revenue | Stay Reviews | Avg Rating |
|---|---|---|---|---|
| La Renaissance | 2 | $266,741 | 27 | 4.86/5.0 |
| Benjamin | 8 | $85,241 | 129 | 4.22/5.0 |
| Philippe | 4 | $74,754 | 3 | 1.25/5.0 |
| Marine Et Alexandre | 1 | $28,452 | 51 | 4.88/5.0 |
| Aurélie | 1 | $26,408 | 12 | 5.00/5.0 |
| Laure | 1 | $21,778 | 18 | 4.94/5.0 |
| Maxime | 1 | $18,559 | 149 | 4.91/5.0 |
| Beatrice | 1 | $14,264 | 42 | 4.98/5.0 |
| Pascal | 1 | $14,066 | 130 | 4.91/5.0 |
| Fabienne | 1 | $13,198 | 33 | 4.91/5.0 |
Analyzing the strategies of top hosts, such as their property selection, pricing, and guest communication, can offer valuable lessons for optimizing your own Airbnb operations in Villandry.
Dive Deeper: Advanced Villandry STR Market Data (2025)
Ready to unlock more insights? AirROI provides access to advanced metrics and comprehensive Airbnb data for Villandry. Explore detailed analytics beyond this report to refine your investment strategy, optimize pricing, and maximize your vacation rental profits.
Explore Advanced MetricsVillandry Short-Term Rental Market Composition (2025): Property & Room Types
Room Type Distribution
Property Type Distribution
Market Composition Insights for Villandry
- The Villandry Airbnb market composition is heavily skewed towards Entire Home/Apt listings, which make up 92.9% of the 28 active rentals. This indicates strong guest preference for privacy and space.
- Looking at the property type distribution in Villandry, House properties are the most common (67.9%), reflecting the local real estate landscape.
- Houses represent a significant 67.9% portion, catering likely to families or larger groups.
- Smaller segments like others, unique stays, hotel/boutique, outdoor/unique (combined 14.4%) offer potential for unique stay experiences.
Villandry Airbnb Room Capacity Analysis (2025): Bedroom Distribution
Distribution of Listings by Number of Bedrooms
Room Capacity Insights for Villandry
- The dominant room capacity in Villandry is 1 bedroom listings, making up 28.6% of the market. This suggests a strong demand for properties suitable for couples or solo travelers.
- Together, 1 bedroom and 4 bedrooms properties represent 53.6% of the active Airbnb listings in Villandry, indicating a high concentration in these sizes.
- A significant 53.6% of listings offer 3+ bedrooms, catering to larger groups and families seeking more space in Villandry.
Villandry Vacation Rental Guest Capacity Trends (2025)
Distribution of Listings by Guest Capacity
Guest Capacity Insights for Villandry
- The most common guest capacity trend in Villandry vacation rentals is listings accommodating 8+ guests (32.1%). This suggests the primary traveler segment is likely larger groups.
- Properties designed for 8+ guests and 6 guests dominate the Villandry STR market, accounting for 50.0% of listings.
- 57.1% of properties accommodate 6+ guests, serving the market segment for larger families or group travel in Villandry.
- On average, properties in Villandry are equipped to host 5.4 guests.
Villandry Airbnb Booking Patterns (2025): Available vs. Booked Days
Available Days Distribution
Booked Days Distribution
Booking Pattern Insights for Villandry
- The most common availability pattern in Villandry falls within the 271-366 days range, representing 67.9% of listings. This suggests many properties have significant open periods on their calendars.
- Approximately 92.9% of listings show high availability (181+ days open annually), indicating potential for increased bookings or specific owner usage patterns.
- For booked days, the 31-90 days range is most frequent in Villandry (60.7%), reflecting common guest stay durations or potential owner blocking patterns.
- A notable 7.1% of properties secure long booking periods (181+ days booked per year), highlighting successful long-term rental strategies or significant owner usage.
Villandry Airbnb Minimum Stay Requirements Analysis
Distribution of Listings by Minimum Night Requirement
1 Night
11 listings
45.8% of total
2 Nights
9 listings
37.5% of total
3 Nights
1 listings
4.2% of total
4-6 Nights
1 listings
4.2% of total
7-29 Nights
1 listings
4.2% of total
30+ Nights
1 listings
4.2% of total
Key Insights
- The most prevalent minimum stay requirement in Villandry is 1 Night, adopted by 45.8% of listings. This highlights the market's preference for shorter, flexible bookings.
- A strong majority (83.3%) of the Villandry Airbnb data shows acceptance of very short stays (1-2 nights), indicating a dynamic, high-turnover market.
Recommendations
- Align with the market by considering a 1 Night minimum stay, as 45.8% of Villandry hosts use this setting.
- Adjust minimum nights based on seasonality – potentially shorter during low season and longer during peak demand periods in Villandry.
Villandry Airbnb Cancellation Policy Trends Analysis (2025)
Flexible
4 listings
14.8% of total
Moderate
9 listings
33.3% of total
Firm
4 listings
14.8% of total
Strict
10 listings
37% of total
Cancellation Policy Insights for Villandry
- The prevailing Airbnb cancellation policy trend in Villandry is Strict, used by 37% of listings.
- A majority (51.8%) of hosts in Villandry utilize Firm or Strict policies, indicating a market where hosts prioritize booking security.
Recommendations for Hosts
- Consider adopting a Strict policy to align with the 37% market standard in Villandry.
- With 37% using Strict terms, this is a viable option in Villandry, particularly for high-value properties or during peak demand periods.
- Regularly review your cancellation policy against competitors and market demand shifts in Villandry.
Villandry STR Booking Lead Time Analysis (2025)
Average Booking Lead Time by Month
Booking Lead Time Insights for Villandry
- The overall average booking lead time for vacation rentals in Villandry is 78 days.
- Guests book furthest in advance for stays during June (average 113 days), likely coinciding with peak travel demand or local events.
- The shortest booking windows occur for stays in November (average 36 days), indicating more last-minute travel plans during this time.
- Seasonally, Summer (103 days avg.) sees the longest lead times, while Fall (43 days avg.) has the shortest, reflecting typical travel planning cycles.
Recommendations for Hosts
- Use the overall average lead time (78 days) as a baseline for your pricing and availability strategy in Villandry.
- For June stays, consider implementing length-of-stay discounts or slightly higher rates for bookings made less than 113 days out to capitalize on advance planning.
- Target marketing efforts for the Summer season well in advance (at least 103 days) to capture early planners.
- Monitor your own booking lead times against these Villandry averages to identify opportunities for dynamic pricing adjustments.
Popular & Essential Airbnb Amenities in Villandry (2025)
Amenity Prevalence
Amenity Insights for Villandry
- Essential amenities in Villandry that guests expect include: Heating, Kitchen. Lacking these (any) could significantly impact bookings.
- Popular amenities like Free parking on premises, Smoke alarm, TV are common but not universal. Offering these can provide a competitive edge.
- Warning: Wifi is not universally provided but is considered essential globally. Ensure reliable Wifi is offered.
Recommendations for Hosts
- Ensure your listing includes all essential amenities for Villandry: Heating, Kitchen.
- Prioritize adding missing essentials: Heating, Kitchen.
- Consider adding popular differentiators like Free parking on premises or Smoke alarm to increase appeal.
- Highlight unique or less common amenities you offer (e.g., hot tub, dedicated workspace, EV charger) in your listing description and photos.
- Regularly check competitor amenities in Villandry to stay competitive.
Villandry Airbnb Guest Demographics & Profile Analysis (2025)
Guest Profile Summary for Villandry
- The typical guest profile for Airbnb in Villandry consists of primarily domestic travelers (80%), often arriving from nearby Paris, typically belonging to the Post-2000s (Gen Z/Alpha) group (50%), primarily speaking French or English.
- Domestic travelers account for 79.6% of guests.
- Key international markets include France (79.6%) and United Kingdom (7.5%).
- Top languages spoken are French (42.3%) followed by English (29.5%).
- A significant demographic segment is the Post-2000s (Gen Z/Alpha) group, representing 50% of guests.
Recommendations for Hosts
- Target domestic marketing efforts towards travelers from Paris and Lyon.
- Tailor amenities and listing descriptions to appeal to the dominant Post-2000s (Gen Z/Alpha) demographic (e.g., highlight fast WiFi, smart home features, local guides).
- Highlight unique local experiences or amenities relevant to the primary guest profile.
- Consider seasonal promotions aligned with peak travel times for key origin markets.
Nearby Short-Term Rental Market Comparison
How does the Villandry Airbnb market stack up against its neighbors? Compare key performance metrics like average monthly revenue, ADR, and occupancy rates in surrounding areas to understand the broader regional STR landscape.
| Market | Active Properties | Monthly Revenue | Daily Rate | Avg. Occupancy |
|---|---|---|---|---|
| La Couture-Boussey | 12 | $3,620 | $378.08 | 28% |
| Millançay | 11 | $3,476 | $370.42 | 39% |
| Coteaux-sur-Loire | 19 | $3,328 | $270.00 | 41% |
| Moulins-le-Carbonnel | 11 | $3,213 | $320.85 | 35% |
| Langon-sur-Cher | 12 | $3,127 | $400.27 | 35% |
| Mesnils-sur-Iton | 22 | $3,028 | $309.05 | 40% |
| Villiers-sur-Loir | 10 | $2,967 | $216.51 | 41% |
| Artannes-sur-Indre | 21 | $2,949 | $275.91 | 41% |
| Vallon-sur-Gée | 11 | $2,913 | $379.01 | 30% |
| La Ferté-en-Ouche | 19 | $2,854 | $258.24 | 39% |