Salbris Airbnb Market Analysis 2025: Short Term Rental Data & Vacation Rental Statistics in Centre-Val de Loire, France
Is Airbnb profitable in Salbris in 2025? Explore comprehensive Airbnb analytics for Salbris, Centre-Val de Loire, France to uncover income potential. This 2025 STR market report for Salbris, based on AirROI data from April 2024 to March 2025, reveals key trends in the niche market of 49 active listings.
Whether you're considering an Airbnb investment in Salbris, optimizing your existing vacation rental, or exploring rental arbitrage opportunities, understanding the Salbris Airbnb data is crucial. Leveraging the low regulation environment is key to maximizing your short term rental income potential. Let's dive into the specifics.
Key Salbris Airbnb Performance Metrics Overview
Monthly Airbnb Revenue Variations & Income Potential in Salbris (2025)
Understanding the monthly revenue variations for Airbnb listings in Salbris is key to maximizing your short term rental income potential. Seasonality significantly impacts earnings. Our analysis, based on data from the past 12 months, shows that the peak revenue month for STRs in Salbris is typically July, while March often presents the lowest earnings, highlighting opportunities for strategic pricing adjustments during shoulder and low seasons. Explore the typical Airbnb income in Salbris across different performance tiers:
- Best-in-class properties (Top 10%) achieve $3,890+ monthly, often utilizing dynamic pricing and superior guest experiences.
- Strong performing properties (Top 25%) earn $1,848 or more, indicating effective management and desirable locations/amenities.
- Typical properties (Median) generate around $896 per month, representing the average market performance.
- Entry-level properties (Bottom 25%) see earnings around $428, often with potential for optimization.
Average Monthly Airbnb Earnings Trend in Salbris
Salbris Airbnb Occupancy Rate Trends (2025)
Maximize your bookings by understanding the Salbris STR occupancy trends. Seasonal demand shifts significantly influence how often properties are booked. Typically, Julysees the highest demand (peak season occupancy), while March experiences the lowest (low season). Effective strategies, like adjusting minimum stays or offering promotions, can boost occupancy during slower periods. Here's how different property tiers perform in Salbris:
- Best-in-class properties (Top 10%) achieve 56%+ occupancy, indicating high desirability and potentially optimized availability.
- Strong performing properties (Top 25%) maintain 39% or higher occupancy, suggesting good market fit and guest satisfaction.
- Typical properties (Median) have an occupancy rate around 23%.
- Entry-level properties (Bottom 25%) average 13% occupancy, potentially facing higher vacancy.
Average Monthly Occupancy Rate Trend in Salbris
Average Daily Rate (ADR) Airbnb Trends in Salbris (2025)
Effective short term rental pricing strategy in Salbris involves understanding monthly ADR fluctuations. The Average Daily Rate (ADR) for Airbnb in Salbris typically peaks in November and dips lowest during March. Leveraging Airbnb dynamic pricing tools or strategies based on this seasonality can significantly boost revenue. Here's a look at the typical nightly rates achieved:
- Best-in-class properties (Top 10%) command rates of $368+ per night, often due to premium features or locations.
- Strong performing properties (Top 25%) achieve nightly rates of $171 or more.
- Typical properties (Median) charge around $123 per night.
- Entry-level properties (Bottom 25%) earn around $96 per night.
Average Daily Rate (ADR) Trend by Month in Salbris
Get Live Salbris Market Intelligence 👇

Explore Real-time Analytics
Airbnb Seasonality Analysis & Trends in Salbris (2025)
Peak Season (July, May, June)
- Revenue averages $2,669 per month
- Occupancy rates average 38.7%
- Daily rates average $171
Shoulder Season
- Revenue averages $1,362 per month
- Occupancy maintains around 27.1%
- Daily rates hold near $166
Low Season (January, March, October)
- Revenue drops to average $787 per month
- Occupancy decreases to average 18.7%
- Daily rates adjust to average $161
Seasonality Insights for Salbris
- The Airbnb seasonality in Salbris shows highly seasonal trends requiring careful strategy. While the sections above show seasonal averages, it's also insightful to look at the extremes:
- During the high season, the absolute peak month showcases Salbris's highest earning potential, with monthly revenues capable of climbing to $2,900, occupancy reaching a high of 56.2%, and ADRs peaking at $175.
- Conversely, the slowest single month of the year, typically falling within the low season, marks the market's lowest point. In this month, revenue might dip to $610, occupancy could drop to 17.0%, and ADRs may adjust down to $156.
- Understanding both the seasonal averages and these monthly peaks and troughs in revenue, occupancy, and ADR is crucial for maximizing your Airbnb profit potential in Salbris.
Seasonal Strategies for Maximizing Profit
- Peak Season: Maximize revenue through premium pricing and potentially longer minimum stays. Ensure high availability.
- Low Season: Offer competitive pricing, special promotions (e.g., extended stay discounts), and flexible cancellation policies. Target off-season travelers like remote workers or budget-conscious guests.
- Shoulder Seasons: Implement dynamic pricing that balances peak and low rates. Target weekend travelers or specific events. Offer slightly more flexible terms than peak season.
- Regularly analyze your own performance against these Salbris seasonality benchmarks and adjust your pricing and availability strategy accordingly.
Best Areas for Airbnb Investment in Salbris (2025)
Exploring the top neighborhoods for short-term rentals in Salbris? This section highlights key areas, outlining why they are attractive for hosts and guests, along with notable local attractions. Consider these locations based on your target guest profile and investment strategy.
| Neighborhood / Area | Why Host Here? (Target Guests & Appeal) | Key Attractions & Landmarks |
|---|---|---|
| Centre de Salbris | Located in the heart of Salbris, this area is close to shops, restaurants, and local attractions, making it ideal for visitors looking to explore the town. | Château de La Prunière, Parc Naturel régional de la Brenne, Les étangs de Salbris, Église Sainte-Marie, Marché de Salbris |
| Tour en Sologne | This area offers a tranquil setting with beautiful countryside views, suitable for guests who enjoy nature and outdoor activities such as hiking and cycling. | Château de Selles-sur-Cher, Les châteaux de la Loire, Sentier de randonnée, Lac de la Sologne, Parc animalier de la Tête d'or |
| Sologne Forest | A nature lover's paradise, this forest area attracts visitors for its serene environment and abundance of wildlife, perfect for relaxation or outdoor adventures. | Forêt de Sologne, Observation de la faune, Randonnées en forêt, Bords de rivières, Pêche |
| Lac de la Touche | A beautiful lake location that draws families and groups for recreational activities such as fishing, swimming, and picnics, making it a sought-after destination in summer. | Baignade, Pêche, Aire de pique-nique, Randonnées autour du lac, Observation des oiseaux |
| Pruniers-en-Sologne | This quaint village is known for its rustic charm and is ideal for guests who prefer a peaceful stay among the countryside, while being close to local amenities. | Église Saint-Gervais, Le lavoir, Randonnées pédestres, Chambres d'hôtes, Marchés locaux |
| Vinçay | A small, picturesque village that offers a real taste of French rural life, making it attractive for tourists looking for an authentic experience. | Château de Vinçay, Vignobles de Sologne, Promenades rurales, Église Saint-Roch, Visites de caves |
| Vieux Salbris | The historical part of Salbris, filled with heritage sites and traditional architecture, appealing for those interested in culture and history. | Anciennes maisons, Musée de Salbris, Vieille église, Les ruelles médiévales, Artisans locaux |
| Martizay | This village is surrounded by nature and known for its spacious landscapes, making it perfect for guests wanting to escape city life and enjoy peace and quiet. | Château de Martizay, Pêche à la ligne, Bicyclettes de campagne, Promenades à travers champs, Marchés fermiers |
Understanding Airbnb License Requirements & STR Laws in Salbris (2025)
While Salbris, Centre-Val de Loire, France currently shows low STR regulations, specific Airbnb license requirements might still exist or change. Always verify the latest short term rental regulations and Airbnb license requirements directly with local government authorities for Salbris to ensure full compliance before hosting.
(Source: AirROI data, 2025, based on 2% licensed listings)
Top Performing Airbnb Properties in Salbris (2025)
Benchmark your potential! Explore examples of top-performing Airbnb properties in Salbrisbased on Trailing Twelve Month (TTM) revenue. Analyze their characteristics, revenue, occupancy rate, and ADR to understand what drives success in this market.

The group cottage
Entire Place • 4 bedrooms
Le Pré des Fées
Entire Place • 3 bedrooms
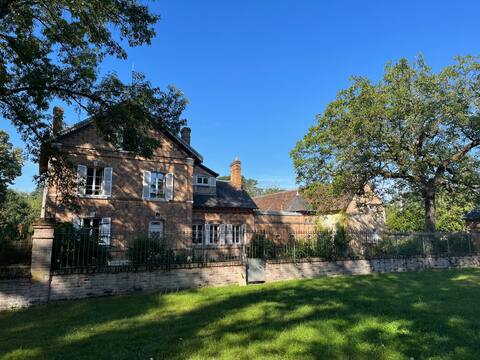
Bel Air Estate
Entire Place • 5 bedrooms
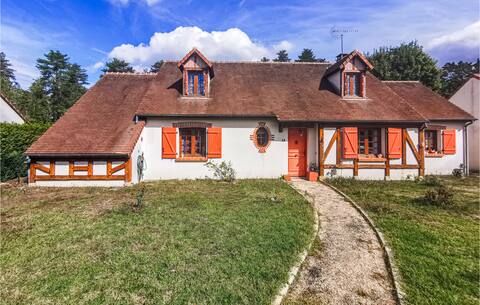
Cozy home in Salbris
Entire Place • 4 bedrooms

Canadian house in the heart of the forest solognote
Entire Place • 4 bedrooms
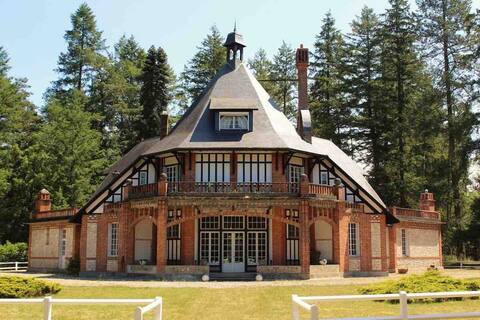
Une expérience hors du temps
Entire Place • 8 bedrooms
Note: Performance varies based on location, size, amenities, seasonality, and management quality. Data reflects the past 12 months.
Top Performing Airbnb Hosts in Salbris (2025)
Learn from the best! This table showcases top-performing Airbnb hosts in Salbris based on the number of properties managed and estimated total revenue over the past year. Analyze their scale and performance metrics.
| Host Name | Properties | Grossing Revenue | Stay Reviews | Avg Rating |
|---|---|---|---|---|
| Jimmy | 9 | $143,175 | 29 | 1.92/5.0 |
| Marielle | 6 | $87,198 | 263 | 4.87/5.0 |
| Dominique | 1 | $54,796 | 5 | 5.00/5.0 |
| Stéphane | 1 | $51,597 | 54 | 4.94/5.0 |
| Novasol | 1 | $40,230 | 4 | 4.75/5.0 |
| Marie-Laure Et Bertrand | 6 | $35,982 | 106 | 3.99/5.0 |
| Host #26827264 | 1 | $30,132 | 1 | 0.00/5.0 |
| Val | 1 | $29,512 | 38 | 4.92/5.0 |
| Conciergerie Du Domaine Des Ch | 1 | $29,128 | 4 | 5.00/5.0 |
| Gilles | 3 | $22,895 | 164 | 4.77/5.0 |
Analyzing the strategies of top hosts, such as their property selection, pricing, and guest communication, can offer valuable lessons for optimizing your own Airbnb operations in Salbris.
Dive Deeper: Advanced Salbris STR Market Data (2025)
Ready to unlock more insights? AirROI provides access to advanced metrics and comprehensive Airbnb data for Salbris. Explore detailed analytics beyond this report to refine your investment strategy, optimize pricing, and maximize your vacation rental profits.
Explore Advanced MetricsSalbris Short-Term Rental Market Composition (2025): Property & Room Types
Room Type Distribution
Property Type Distribution
Market Composition Insights for Salbris
- The Salbris Airbnb market composition is heavily skewed towards Entire Home/Apt listings, which make up 77.6% of the 49 active rentals. This indicates strong guest preference for privacy and space.
- Looking at the property type distribution in Salbris, House properties are the most common (55.1%), reflecting the local real estate landscape.
- Houses represent a significant 55.1% portion, catering likely to families or larger groups.
- The presence of 24.5% Hotel/Boutique listings indicates integration with traditional hospitality.
Salbris Airbnb Room Capacity Analysis (2025): Bedroom Distribution
Distribution of Listings by Number of Bedrooms
Room Capacity Insights for Salbris
- The dominant room capacity in Salbris is 2 bedrooms listings, making up 34.7% of the market. This suggests a strong demand for properties suitable for couples or solo travelers.
- Together, 2 bedrooms and 1 bedroom properties represent 51.0% of the active Airbnb listings in Salbris, indicating a high concentration in these sizes.
- A significant 26.6% of listings offer 3+ bedrooms, catering to larger groups and families seeking more space in Salbris.
Salbris Vacation Rental Guest Capacity Trends (2025)
Distribution of Listings by Guest Capacity
Guest Capacity Insights for Salbris
- The most common guest capacity trend in Salbris vacation rentals is listings accommodating 6 guests (20.4%). This suggests the primary traveler segment is likely larger groups.
- Properties designed for 6 guests and 4 guests dominate the Salbris STR market, accounting for 38.8% of listings.
- 38.8% of properties accommodate 6+ guests, serving the market segment for larger families or group travel in Salbris.
- On average, properties in Salbris are equipped to host 3.9 guests.
Salbris Airbnb Booking Patterns (2025): Available vs. Booked Days
Available Days Distribution
Booked Days Distribution
Booking Pattern Insights for Salbris
- The most common availability pattern in Salbris falls within the 271-366 days range, representing 67.3% of listings. This suggests many properties have significant open periods on their calendars.
- Approximately 93.8% of listings show high availability (181+ days open annually), indicating potential for increased bookings or specific owner usage patterns.
- For booked days, the 31-90 days range is most frequent in Salbris (57.1%), reflecting common guest stay durations or potential owner blocking patterns.
- A notable 6.1% of properties secure long booking periods (181+ days booked per year), highlighting successful long-term rental strategies or significant owner usage.
Salbris Airbnb Minimum Stay Requirements Analysis
Distribution of Listings by Minimum Night Requirement
1 Night
17 listings
35.4% of total
2 Nights
30 listings
62.5% of total
3 Nights
1 listings
2.1% of total
Key Insights
- The most prevalent minimum stay requirement in Salbris is 2 Nights, adopted by 62.5% of listings. This highlights the market's preference for shorter, flexible bookings.
- A strong majority (97.9%) of the Salbris Airbnb data shows acceptance of very short stays (1-2 nights), indicating a dynamic, high-turnover market.
Recommendations
- Align with the market by considering a 2 Nights minimum stay, as 62.5% of Salbris hosts use this setting.
- Adjust minimum nights based on seasonality – potentially shorter during low season and longer during peak demand periods in Salbris.
Salbris Airbnb Cancellation Policy Trends Analysis (2025)
Super Strict 60 Days
1 listings
2.4% of total
Flexible
17 listings
40.5% of total
Moderate
5 listings
11.9% of total
Firm
12 listings
28.6% of total
Strict
7 listings
16.7% of total
Cancellation Policy Insights for Salbris
- The prevailing Airbnb cancellation policy trend in Salbris is Flexible, used by 40.5% of listings.
- There's a relatively balanced mix between guest-friendly (52.4%) and stricter (45.3%) policies, offering choices for different guest needs.
Recommendations for Hosts
- Consider adopting a Flexible policy to align with the 40.5% market standard in Salbris.
- Regularly review your cancellation policy against competitors and market demand shifts in Salbris.
Salbris STR Booking Lead Time Analysis (2025)
Average Booking Lead Time by Month
Booking Lead Time Insights for Salbris
- The overall average booking lead time for vacation rentals in Salbris is 61 days.
- Guests book furthest in advance for stays during July (average 153 days), likely coinciding with peak travel demand or local events.
- The shortest booking windows occur for stays in March (average 30 days), indicating more last-minute travel plans during this time.
- Seasonally, Summer (106 days avg.) sees the longest lead times, while Winter (40 days avg.) has the shortest, reflecting typical travel planning cycles.
Recommendations for Hosts
- Use the overall average lead time (61 days) as a baseline for your pricing and availability strategy in Salbris.
- For July stays, consider implementing length-of-stay discounts or slightly higher rates for bookings made less than 153 days out to capitalize on advance planning.
- Target marketing efforts for the Summer season well in advance (at least 106 days) to capture early planners.
- Monitor your own booking lead times against these Salbris averages to identify opportunities for dynamic pricing adjustments.
Popular & Essential Airbnb Amenities in Salbris (2025)
Amenity Prevalence
Amenity Insights for Salbris
- Essential amenities in Salbris that guests expect include: Free parking on premises, Kitchen, Heating. Lacking these (any) could significantly impact bookings.
- Popular amenities like Hot water, TV, Dishes and silverware are common but not universal. Offering these can provide a competitive edge.
Recommendations for Hosts
- Ensure your listing includes all essential amenities for Salbris: Free parking on premises, Kitchen, Heating.
- Prioritize adding missing essentials: Free parking on premises, Kitchen, Heating.
- Consider adding popular differentiators like Hot water or TV to increase appeal.
- Highlight unique or less common amenities you offer (e.g., hot tub, dedicated workspace, EV charger) in your listing description and photos.
- Regularly check competitor amenities in Salbris to stay competitive.
Salbris Airbnb Guest Demographics & Profile Analysis (2025)
Guest Profile Summary for Salbris
- The typical guest profile for Airbnb in Salbris consists of primarily domestic travelers (77%), often arriving from nearby Paris, typically belonging to the Post-2000s (Gen Z/Alpha) group (50%), primarily speaking French or English.
- Domestic travelers account for 76.6% of guests.
- Key international markets include France (76.6%) and United Kingdom (5.4%).
- Top languages spoken are French (38.8%) followed by English (31.9%).
- A significant demographic segment is the Post-2000s (Gen Z/Alpha) group, representing 50% of guests.
Recommendations for Hosts
- Target domestic marketing efforts towards travelers from Paris and Ballan-Miré.
- Tailor amenities and listing descriptions to appeal to the dominant Post-2000s (Gen Z/Alpha) demographic (e.g., highlight fast WiFi, smart home features, local guides).
- Highlight unique local experiences or amenities relevant to the primary guest profile.
- Consider seasonal promotions aligned with peak travel times for key origin markets.
Nearby Short-Term Rental Market Comparison
How does the Salbris Airbnb market stack up against its neighbors? Compare key performance metrics like average monthly revenue, ADR, and occupancy rates in surrounding areas to understand the broader regional STR landscape.
| Market | Active Properties | Monthly Revenue | Daily Rate | Avg. Occupancy |
|---|---|---|---|---|
| Verdelot | 13 | $3,885 | $300.79 | 46% |
| La Couture-Boussey | 12 | $3,620 | $378.08 | 28% |
| Dourdan | 15 | $3,576 | $223.06 | 52% |
| Millançay | 11 | $3,476 | $370.42 | 39% |
| Chaintreaux | 11 | $3,136 | $278.28 | 34% |
| Langon-sur-Cher | 12 | $3,127 | $400.27 | 35% |
| Mesnils-sur-Iton | 22 | $3,028 | $309.05 | 40% |
| Tournan-en-Brie | 16 | $3,020 | $249.98 | 47% |
| Saint-Rémy-l'Honoré | 17 | $2,840 | $355.86 | 41% |
| Barbizon | 44 | $2,803 | $303.25 | 41% |