Saint-Satur Airbnb Market Analysis 2025: Short Term Rental Data & Vacation Rental Statistics in Centre-Val de Loire, France
Is Airbnb profitable in Saint-Satur in 2025? Explore comprehensive Airbnb analytics for Saint-Satur, Centre-Val de Loire, France to uncover income potential. This 2025 STR market report for Saint-Satur, based on AirROI data from April 2024 to March 2025, reveals key trends in the niche market of 18 active listings.
Whether you're considering an Airbnb investment in Saint-Satur, optimizing your existing vacation rental, or exploring rental arbitrage opportunities, understanding the Saint-Satur Airbnb data is crucial. Leveraging the low regulation environment is key to maximizing your short term rental income potential. Let's dive into the specifics.
Key Saint-Satur Airbnb Performance Metrics Overview
Monthly Airbnb Revenue Variations & Income Potential in Saint-Satur (2025)
Understanding the monthly revenue variations for Airbnb listings in Saint-Satur is key to maximizing your short term rental income potential. Seasonality significantly impacts earnings. Our analysis, based on data from the past 12 months, shows that the peak revenue month for STRs in Saint-Satur is typically August, while February often presents the lowest earnings, highlighting opportunities for strategic pricing adjustments during shoulder and low seasons. Explore the typical Airbnb income in Saint-Satur across different performance tiers:
- Best-in-class properties (Top 10%) achieve $3,828+ monthly, often utilizing dynamic pricing and superior guest experiences.
- Strong performing properties (Top 25%) earn $1,971 or more, indicating effective management and desirable locations/amenities.
- Typical properties (Median) generate around $1,013 per month, representing the average market performance.
- Entry-level properties (Bottom 25%) see earnings around $504, often with potential for optimization.
Average Monthly Airbnb Earnings Trend in Saint-Satur
Saint-Satur Airbnb Occupancy Rate Trends (2025)
Maximize your bookings by understanding the Saint-Satur STR occupancy trends. Seasonal demand shifts significantly influence how often properties are booked. Typically, Julysees the highest demand (peak season occupancy), while February experiences the lowest (low season). Effective strategies, like adjusting minimum stays or offering promotions, can boost occupancy during slower periods. Here's how different property tiers perform in Saint-Satur:
- Best-in-class properties (Top 10%) achieve 57%+ occupancy, indicating high desirability and potentially optimized availability.
- Strong performing properties (Top 25%) maintain 35% or higher occupancy, suggesting good market fit and guest satisfaction.
- Typical properties (Median) have an occupancy rate around 20%.
- Entry-level properties (Bottom 25%) average 9% occupancy, potentially facing higher vacancy.
Average Monthly Occupancy Rate Trend in Saint-Satur
Average Daily Rate (ADR) Airbnb Trends in Saint-Satur (2025)
Effective short term rental pricing strategy in Saint-Satur involves understanding monthly ADR fluctuations. The Average Daily Rate (ADR) for Airbnb in Saint-Satur typically peaks in November and dips lowest during April. Leveraging Airbnb dynamic pricing tools or strategies based on this seasonality can significantly boost revenue. Here's a look at the typical nightly rates achieved:
- Best-in-class properties (Top 10%) command rates of $554+ per night, often due to premium features or locations.
- Strong performing properties (Top 25%) achieve nightly rates of $206 or more.
- Typical properties (Median) charge around $126 per night.
- Entry-level properties (Bottom 25%) earn around $98 per night.
Average Daily Rate (ADR) Trend by Month in Saint-Satur
Get Live Saint-Satur Market Intelligence 👇

Explore Real-time Analytics
Airbnb Seasonality Analysis & Trends in Saint-Satur (2025)
Peak Season (August, May, December)
- Revenue averages $2,337 per month
- Occupancy rates average 31.6%
- Daily rates average $196
Shoulder Season
- Revenue averages $1,563 per month
- Occupancy maintains around 27.6%
- Daily rates hold near $197
Low Season (February, March, October)
- Revenue drops to average $636 per month
- Occupancy decreases to average 17.2%
- Daily rates adjust to average $204
Seasonality Insights for Saint-Satur
- The Airbnb seasonality in Saint-Satur shows highly seasonal trends requiring careful strategy. While the sections above show seasonal averages, it's also insightful to look at the extremes:
- During the high season, the absolute peak month showcases Saint-Satur's highest earning potential, with monthly revenues capable of climbing to $2,549, occupancy reaching a high of 36.2%, and ADRs peaking at $222.
- Conversely, the slowest single month of the year, typically falling within the low season, marks the market's lowest point. In this month, revenue might dip to $333, occupancy could drop to 15.4%, and ADRs may adjust down to $184.
- Understanding both the seasonal averages and these monthly peaks and troughs in revenue, occupancy, and ADR is crucial for maximizing your Airbnb profit potential in Saint-Satur.
Seasonal Strategies for Maximizing Profit
- Peak Season: Maximize revenue through premium pricing and potentially longer minimum stays. Ensure high availability.
- Low Season: Offer competitive pricing, special promotions (e.g., extended stay discounts), and flexible cancellation policies. Target off-season travelers like remote workers or budget-conscious guests.
- Shoulder Seasons: Implement dynamic pricing that balances peak and low rates. Target weekend travelers or specific events. Offer slightly more flexible terms than peak season.
- Regularly analyze your own performance against these Saint-Satur seasonality benchmarks and adjust your pricing and availability strategy accordingly.
Best Areas for Airbnb Investment in Saint-Satur (2025)
Exploring the top neighborhoods for short-term rentals in Saint-Satur? This section highlights key areas, outlining why they are attractive for hosts and guests, along with notable local attractions. Consider these locations based on your target guest profile and investment strategy.
| Neighborhood / Area | Why Host Here? (Target Guests & Appeal) | Key Attractions & Landmarks |
|---|---|---|
| Saint-Satur Center | A quaint village atmosphere with proximity to the historic city of Sancerre, making it ideal for guests who want to explore the Loire Valley's vineyards. | Sancerre Vineyards, The Loire River, Château de Sancerre, La Pomme au Sancerrois, Eglise Saint-Satur |
| Sancerre Village | Famous for its white wine, this picturesque hilltop village offers stunning views and a rich cultural experience, great for wine enthusiasts. | Sancerre Wine Tasting, Belfry of Sancerre, Sancerre Museum, Château de Sancerre, Local Wine Bars |
| Cosne-Cours-sur-Loire | A nearby town with a mix of history and nature, attractive to visitors looking for more local experiences away from the tourist crowds. | Loire Museum, Bridge of Cosne, Regional Natural Park of the Bocage, Historic town center, Local markets |
| Zinswald | A charming suburb known for its rustic charm and proximity to nature, appealing to families and nature lovers. | Walking trails, Local farms, Peaceful countryside, Nearby rivers, Cultural festivals |
| Chavignol | Known for its delicious goat cheese, this village attracts culinary tourists seeking authentic local flavors. | Goat cheese farms, Savoir-Faire de Chavignol, Cheese tasting tours, Scenic countryside, Wine pairings |
| Menetou-Salon | Another wine-producing region nearby, Menetou-Salon offers beautiful landscapes and a rich gastronomic agenda. | Menetou-Salon vineyards, Wine tasting events, Historic churches, Picturesque villages, Local cuisine |
| Celebration | A small area known for its celebrations and festivals, bringing in visitors year-round for its local festivities and community spirit. | Cultural festivals, Local markets, Art exhibitions, Community events, Riverside walks |
| Saint-Père | A peaceful village ideal for relaxation, providing a serene environment for guests intent on unwinding and exploring the local area. | Local parks, Nature trails, Quiet churches, Traditional cuisine, Community gatherings |
Understanding Airbnb License Requirements & STR Laws in Saint-Satur (2025)
While Saint-Satur, Centre-Val de Loire, France currently shows low STR regulations, specific Airbnb license requirements might still exist or change. Always verify the latest short term rental regulations and Airbnb license requirements directly with local government authorities for Saint-Satur to ensure full compliance before hosting.
(Source: AirROI data, 2025, based on 6% licensed listings)
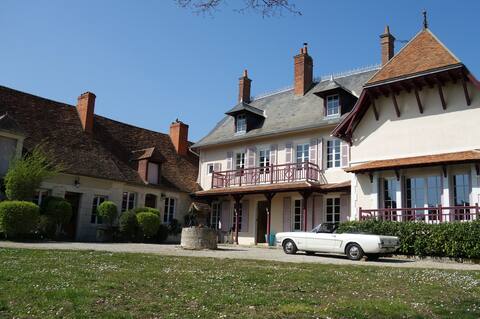
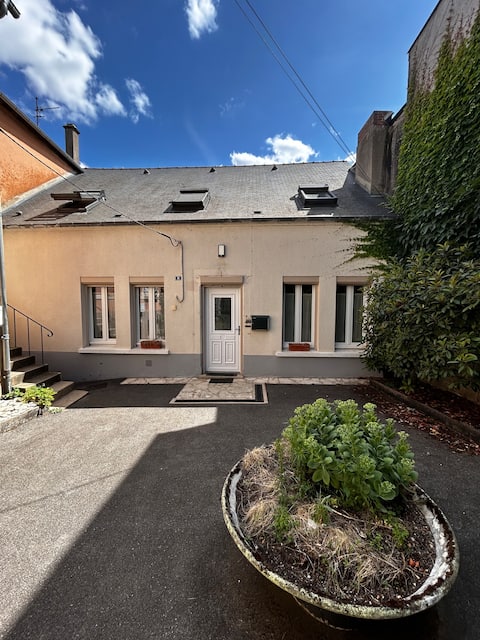
Top Performing Airbnb Properties in Saint-Satur (2025)
Benchmark your potential! Explore examples of top-performing Airbnb properties in Saint-Saturbased on Trailing Twelve Month (TTM) revenue. Analyze their characteristics, revenue, occupancy rate, and ADR to understand what drives success in this market.

Welcome Sancerre (Villa Marlise)
Entire Place • 5 bedrooms
Demeure de charme à Sancerre
Entire Place • 6 bedrooms

Sancerre: Rent house with a view of the Loire
Entire Place • 2 bedrooms

In the foot of Sancerre, fully-equipped cozy accommodation
Entire Place • 1 bedroom

FEEL AT HOME 23 pers p'tit dej offered meal poss
Entire Place • 5 bedrooms
La Gordonienne
Entire Place • 3 bedrooms
Note: Performance varies based on location, size, amenities, seasonality, and management quality. Data reflects the past 12 months.
Top Performing Airbnb Hosts in Saint-Satur (2025)
Learn from the best! This table showcases top-performing Airbnb hosts in Saint-Satur based on the number of properties managed and estimated total revenue over the past year. Analyze their scale and performance metrics.
| Host Name | Properties | Grossing Revenue | Stay Reviews | Avg Rating |
|---|---|---|---|---|
| Stéphanie | 2 | $39,794 | 78 | 4.82/5.0 |
| La Mesangerie | 2 | $37,343 | 7 | 2.50/5.0 |
| Laure | 4 | $30,406 | 86 | 4.68/5.0 |
| Marjolaine | 1 | $20,052 | 40 | 4.78/5.0 |
| Nina | 1 | $14,664 | 26 | 4.88/5.0 |
| Host #359004769 | 1 | $11,128 | 13 | 4.92/5.0 |
| Bruno | 1 | $10,883 | 5 | 4.80/5.0 |
| Chloé | 1 | $10,796 | 12 | 4.83/5.0 |
| Leo | 1 | $8,074 | 63 | 4.81/5.0 |
| Pascal Et Christelle | 1 | $5,814 | 31 | 4.68/5.0 |
Analyzing the strategies of top hosts, such as their property selection, pricing, and guest communication, can offer valuable lessons for optimizing your own Airbnb operations in Saint-Satur.
Dive Deeper: Advanced Saint-Satur STR Market Data (2025)
Ready to unlock more insights? AirROI provides access to advanced metrics and comprehensive Airbnb data for Saint-Satur. Explore detailed analytics beyond this report to refine your investment strategy, optimize pricing, and maximize your vacation rental profits.
Explore Advanced MetricsSaint-Satur Short-Term Rental Market Composition (2025): Property & Room Types
Room Type Distribution
Property Type Distribution
Market Composition Insights for Saint-Satur
- The Saint-Satur Airbnb market composition is heavily skewed towards Entire Home/Apt listings, which make up 83.3% of the 18 active rentals. This indicates strong guest preference for privacy and space.
- Looking at the property type distribution in Saint-Satur, House properties are the most common (77.8%), reflecting the local real estate landscape.
- Houses represent a significant 77.8% portion, catering likely to families or larger groups.
- The presence of 11.1% Hotel/Boutique listings indicates integration with traditional hospitality.
Saint-Satur Airbnb Room Capacity Analysis (2025): Bedroom Distribution
Distribution of Listings by Number of Bedrooms
Room Capacity Insights for Saint-Satur
- The dominant room capacity in Saint-Satur is 1 bedroom listings, making up 22.2% of the market. This suggests a strong demand for properties suitable for couples or solo travelers.
- Together, 1 bedroom and 2 bedrooms properties represent 38.9% of the active Airbnb listings in Saint-Satur, indicating a high concentration in these sizes.
- A significant 50.1% of listings offer 3+ bedrooms, catering to larger groups and families seeking more space in Saint-Satur.
Saint-Satur Vacation Rental Guest Capacity Trends (2025)
Distribution of Listings by Guest Capacity
Guest Capacity Insights for Saint-Satur
- The most common guest capacity trend in Saint-Satur vacation rentals is listings accommodating 8+ guests (38.9%). This suggests the primary traveler segment is likely larger groups.
- Properties designed for 8+ guests and 4 guests dominate the Saint-Satur STR market, accounting for 61.1% of listings.
- 55.6% of properties accommodate 6+ guests, serving the market segment for larger families or group travel in Saint-Satur.
- On average, properties in Saint-Satur are equipped to host 5.3 guests.
Saint-Satur Airbnb Booking Patterns (2025): Available vs. Booked Days
Available Days Distribution
Booked Days Distribution
Booking Pattern Insights for Saint-Satur
- The most common availability pattern in Saint-Satur falls within the 271-366 days range, representing 77.8% of listings. This suggests many properties have significant open periods on their calendars.
- Approximately 94.5% of listings show high availability (181+ days open annually), indicating potential for increased bookings or specific owner usage patterns.
- For booked days, the 31-90 days range is most frequent in Saint-Satur (50%), reflecting common guest stay durations or potential owner blocking patterns.
- A notable 5.6% of properties secure long booking periods (181+ days booked per year), highlighting successful long-term rental strategies or significant owner usage.
Saint-Satur Airbnb Minimum Stay Requirements Analysis
Distribution of Listings by Minimum Night Requirement
1 Night
8 listings
50% of total
2 Nights
7 listings
43.8% of total
7-29 Nights
1 listings
6.3% of total
Key Insights
- The most prevalent minimum stay requirement in Saint-Satur is 1 Night, adopted by 50% of listings. This highlights the market's preference for shorter, flexible bookings.
- A strong majority (93.8%) of the Saint-Satur Airbnb data shows acceptance of very short stays (1-2 nights), indicating a dynamic, high-turnover market.
Recommendations
- Align with the market by considering a 1 Night minimum stay, as 50% of Saint-Satur hosts use this setting.
- Adjust minimum nights based on seasonality – potentially shorter during low season and longer during peak demand periods in Saint-Satur.
Saint-Satur Airbnb Cancellation Policy Trends Analysis (2025)
Flexible
9 listings
60% of total
Moderate
2 listings
13.3% of total
Firm
3 listings
20% of total
Strict
1 listings
6.7% of total
Cancellation Policy Insights for Saint-Satur
- The prevailing Airbnb cancellation policy trend in Saint-Satur is Flexible, used by 60% of listings.
- The market strongly favors guest-friendly terms, with 73.3% of listings offering Flexible or Moderate policies. This suggests guests in Saint-Satur may expect booking flexibility.
- Strict cancellation policies are quite rare (6.7%), potentially making listings with this policy less competitive unless justified by high demand or property type.
Recommendations for Hosts
- Consider adopting a Flexible policy to align with the 60% market standard in Saint-Satur.
- Given the high prevalence of Flexible policies (60%), offering this can enhance booking appeal, especially during shoulder seasons.
- Using a Strict policy might deter some guests, as only 6.7% of listings use it. Evaluate if potential revenue protection outweighs possible lower booking rates.
- Regularly review your cancellation policy against competitors and market demand shifts in Saint-Satur.
Saint-Satur STR Booking Lead Time Analysis (2025)
Average Booking Lead Time by Month
Booking Lead Time Insights for Saint-Satur
- The overall average booking lead time for vacation rentals in Saint-Satur is 36 days.
- Guests book furthest in advance for stays during May (average 99 days), likely coinciding with peak travel demand or local events.
- The shortest booking windows occur for stays in February (average 16 days), indicating more last-minute travel plans during this time.
- Seasonally, Spring (55 days avg.) sees the longest lead times, while Winter (24 days avg.) has the shortest, reflecting typical travel planning cycles.
Recommendations for Hosts
- Use the overall average lead time (36 days) as a baseline for your pricing and availability strategy in Saint-Satur.
- For May stays, consider implementing length-of-stay discounts or slightly higher rates for bookings made less than 99 days out to capitalize on advance planning.
- Target marketing efforts for the Spring season well in advance (at least 55 days) to capture early planners.
- Monitor your own booking lead times against these Saint-Satur averages to identify opportunities for dynamic pricing adjustments.
Popular & Essential Airbnb Amenities in Saint-Satur (2025)
Amenity Prevalence
Amenity Insights for Saint-Satur
- Popular amenities like Kitchen, Heating, Hot water are common but not universal. Offering these can provide a competitive edge.
- Warning: Wifi is not universally provided but is considered essential globally. Ensure reliable Wifi is offered.
Recommendations for Hosts
- Consider adding popular differentiators like Kitchen or Heating to increase appeal.
- Highlight unique or less common amenities you offer (e.g., hot tub, dedicated workspace, EV charger) in your listing description and photos.
- Regularly check competitor amenities in Saint-Satur to stay competitive.
Saint-Satur Airbnb Guest Demographics & Profile Analysis (2025)
Guest Profile Summary for Saint-Satur
- The typical guest profile for Airbnb in Saint-Satur consists of primarily domestic travelers (76%), often arriving from nearby Paris, typically belonging to the Post-2000s (Gen Z/Alpha) group (50%), primarily speaking French or English.
- Domestic travelers account for 75.9% of guests.
- Key international markets include France (75.9%) and United States (6.3%).
- Top languages spoken are French (43.1%) followed by English (36.9%).
- A significant demographic segment is the Post-2000s (Gen Z/Alpha) group, representing 50% of guests.
Recommendations for Hosts
- Target domestic marketing efforts towards travelers from Paris and Meudon.
- Tailor amenities and listing descriptions to appeal to the dominant Post-2000s (Gen Z/Alpha) demographic (e.g., highlight fast WiFi, smart home features, local guides).
- Highlight unique local experiences or amenities relevant to the primary guest profile.
- Consider seasonal promotions aligned with peak travel times for key origin markets.
Nearby Short-Term Rental Market Comparison
How does the Saint-Satur Airbnb market stack up against its neighbors? Compare key performance metrics like average monthly revenue, ADR, and occupancy rates in surrounding areas to understand the broader regional STR landscape.
| Market | Active Properties | Monthly Revenue | Daily Rate | Avg. Occupancy |
|---|---|---|---|---|
| Verdelot | 13 | $3,885 | $300.79 | 46% |
| La Couture-Boussey | 12 | $3,620 | $378.08 | 28% |
| Dourdan | 15 | $3,576 | $223.06 | 52% |
| Millançay | 11 | $3,476 | $370.42 | 39% |
| Chaintreaux | 11 | $3,136 | $278.28 | 34% |
| Langon-sur-Cher | 12 | $3,127 | $400.27 | 35% |
| Mesnils-sur-Iton | 22 | $3,028 | $309.05 | 40% |
| Tournan-en-Brie | 16 | $3,020 | $249.98 | 47% |
| Saint-Rémy-l'Honoré | 17 | $2,840 | $355.86 | 41% |
| Barbizon | 44 | $2,803 | $303.25 | 41% |