Saint-Jean-de-la-Ruelle Airbnb Market Analysis 2025: Short Term Rental Data & Vacation Rental Statistics in Centre-Val de Loire, France
Is Airbnb profitable in Saint-Jean-de-la-Ruelle in 2025? Explore comprehensive Airbnb analytics for Saint-Jean-de-la-Ruelle, Centre-Val de Loire, France to uncover income potential. This 2025 STR market report for Saint-Jean-de-la-Ruelle, based on AirROI data from April 2024 to March 2025, reveals key trends in the niche market of 27 active listings.
Whether you're considering an Airbnb investment in Saint-Jean-de-la-Ruelle, optimizing your existing vacation rental, or exploring rental arbitrage opportunities, understanding the Saint-Jean-de-la-Ruelle Airbnb data is crucial. Leveraging the low regulation environment is key to maximizing your short term rental income potential. Let's dive into the specifics.
Key Saint-Jean-de-la-Ruelle Airbnb Performance Metrics Overview
Monthly Airbnb Revenue Variations & Income Potential in Saint-Jean-de-la-Ruelle (2025)
Understanding the monthly revenue variations for Airbnb listings in Saint-Jean-de-la-Ruelle is key to maximizing your short term rental income potential. Seasonality significantly impacts earnings. Our analysis, based on data from the past 12 months, shows that the peak revenue month for STRs in Saint-Jean-de-la-Ruelle is typically June, while February often presents the lowest earnings, highlighting opportunities for strategic pricing adjustments during shoulder and low seasons. Explore the typical Airbnb income in Saint-Jean-de-la-Ruelle across different performance tiers:
- Best-in-class properties (Top 10%) achieve $1,692+ monthly, often utilizing dynamic pricing and superior guest experiences.
- Strong performing properties (Top 25%) earn $1,116 or more, indicating effective management and desirable locations/amenities.
- Typical properties (Median) generate around $668 per month, representing the average market performance.
- Entry-level properties (Bottom 25%) see earnings around $359, often with potential for optimization.
Average Monthly Airbnb Earnings Trend in Saint-Jean-de-la-Ruelle
Saint-Jean-de-la-Ruelle Airbnb Occupancy Rate Trends (2025)
Maximize your bookings by understanding the Saint-Jean-de-la-Ruelle STR occupancy trends. Seasonal demand shifts significantly influence how often properties are booked. Typically, Augustsees the highest demand (peak season occupancy), while February experiences the lowest (low season). Effective strategies, like adjusting minimum stays or offering promotions, can boost occupancy during slower periods. Here's how different property tiers perform in Saint-Jean-de-la-Ruelle:
- Best-in-class properties (Top 10%) achieve 75%+ occupancy, indicating high desirability and potentially optimized availability.
- Strong performing properties (Top 25%) maintain 62% or higher occupancy, suggesting good market fit and guest satisfaction.
- Typical properties (Median) have an occupancy rate around 42%.
- Entry-level properties (Bottom 25%) average 21% occupancy, potentially facing higher vacancy.
Average Monthly Occupancy Rate Trend in Saint-Jean-de-la-Ruelle
Average Daily Rate (ADR) Airbnb Trends in Saint-Jean-de-la-Ruelle (2025)
Effective short term rental pricing strategy in Saint-Jean-de-la-Ruelle involves understanding monthly ADR fluctuations. The Average Daily Rate (ADR) for Airbnb in Saint-Jean-de-la-Ruelle typically peaks in July and dips lowest during March. Leveraging Airbnb dynamic pricing tools or strategies based on this seasonality can significantly boost revenue. Here's a look at the typical nightly rates achieved:
- Best-in-class properties (Top 10%) command rates of $135+ per night, often due to premium features or locations.
- Strong performing properties (Top 25%) achieve nightly rates of $80 or more.
- Typical properties (Median) charge around $50 per night.
- Entry-level properties (Bottom 25%) earn around $36 per night.
Average Daily Rate (ADR) Trend by Month in Saint-Jean-de-la-Ruelle
Get Live Saint-Jean-de-la-Ruelle Market Intelligence 👇

Explore Real-time Analytics
Airbnb Seasonality Analysis & Trends in Saint-Jean-de-la-Ruelle (2025)
Peak Season (June, April, May)
- Revenue averages $1,390 per month
- Occupancy rates average 39.6%
- Daily rates average $73
Shoulder Season
- Revenue averages $914 per month
- Occupancy maintains around 45.6%
- Daily rates hold near $70
Low Season (February, March, October)
- Revenue drops to average $556 per month
- Occupancy decreases to average 37.9%
- Daily rates adjust to average $67
Seasonality Insights for Saint-Jean-de-la-Ruelle
- The Airbnb seasonality in Saint-Jean-de-la-Ruelle shows highly seasonal trends requiring careful strategy. While the sections above show seasonal averages, it's also insightful to look at the extremes:
- During the high season, the absolute peak month showcases Saint-Jean-de-la-Ruelle's highest earning potential, with monthly revenues capable of climbing to $1,439, occupancy reaching a high of 60.1%, and ADRs peaking at $77.
- Conversely, the slowest single month of the year, typically falling within the low season, marks the market's lowest point. In this month, revenue might dip to $441, occupancy could drop to 32.9%, and ADRs may adjust down to $64.
- Understanding both the seasonal averages and these monthly peaks and troughs in revenue, occupancy, and ADR is crucial for maximizing your Airbnb profit potential in Saint-Jean-de-la-Ruelle.
Seasonal Strategies for Maximizing Profit
- Peak Season: Maximize revenue through premium pricing and potentially longer minimum stays. Ensure high availability.
- Low Season: Offer competitive pricing, special promotions (e.g., extended stay discounts), and flexible cancellation policies. Target off-season travelers like remote workers or budget-conscious guests.
- Shoulder Seasons: Implement dynamic pricing that balances peak and low rates. Target weekend travelers or specific events. Offer slightly more flexible terms than peak season.
- Regularly analyze your own performance against these Saint-Jean-de-la-Ruelle seasonality benchmarks and adjust your pricing and availability strategy accordingly.
Best Areas for Airbnb Investment in Saint-Jean-de-la-Ruelle (2025)
Exploring the top neighborhoods for short-term rentals in Saint-Jean-de-la-Ruelle? This section highlights key areas, outlining why they are attractive for hosts and guests, along with notable local attractions. Consider these locations based on your target guest profile and investment strategy.
| Neighborhood / Area | Why Host Here? (Target Guests & Appeal) | Key Attractions & Landmarks |
|---|---|---|
| Centre-Ville | The city center offers a vibrant atmosphere with a mix of shops, restaurants, and cultural attractions. It's ideal for tourists wanting to immerse themselves in local life with easy access to amenities. | Saint-Jean-de-la-Ruelle Market, City Hall, Local dining options, Parks and recreational areas, Cultural events |
| Parc de l'Erdre | A beautiful area known for its park and greenery, attracting families and nature lovers. It's perfect for those looking for a peaceful stay close to nature yet near city conveniences. | Erdre Park, Walking trails, Playgrounds, Picnic areas, Close proximity to public transport |
| Les Alisiers | This neighborhood is popular for its residential charm and community feel, drawing families and long-term visitors. The local amenities and parks make it ideal for families visiting the area. | Community parks, Local shops, Cafés and bakeries, Schools and educational facilities, Community events |
| Les Violettes | Known for its friendly atmosphere and family-oriented features, it attracts visitors looking for a quieter experience while still being connected to the main attractions of the city. | Local parks, Family-friendly activities, Nearby shopping centers, Cultural heritage sites, Local festivals |
| Rue des Écoles | A historical area that offers cultural and educational sights, perfect for those interested in the local history and heritage. | Historical landmarks, Local museums, Cultural centers, Educational institutions, Guided tours |
| La Châtaigneraie | A great suburban neighborhood offering a mix of tranquility and proximity to urban facilities, it's attractive for visitors looking to relax while being near the city. | Suburban parks, Walking and cycling paths, Local grocery stores, Community engagement activities, Cafés and local eateries |
| La Gare | Close to public transport, this area is ideal for travelers using the train system, providing easy access to nearby cities and tourist destinations. | Train station, Local transport links, Nearby attractions in Orléans, Cafés and shops, Accessibility to regional tours |
| Pôle d'activités | An area with a mix of business and leisure, it's popular among business travelers and tourists who prefer a functional environment with necessary amenities available. | Business centers, Restaurants and cafés, Local offices, Event venues, Quick access to main highways |
Understanding Airbnb License Requirements & STR Laws in Saint-Jean-de-la-Ruelle (2025)
While Saint-Jean-de-la-Ruelle, Centre-Val de Loire, France currently shows low STR regulations, specific Airbnb license requirements might still exist or change. Always verify the latest short term rental regulations and Airbnb license requirements directly with local government authorities for Saint-Jean-de-la-Ruelle to ensure full compliance before hosting.
(Source: AirROI data, 2025, finding no licensed listings among those analyzed)
Top Performing Airbnb Properties in Saint-Jean-de-la-Ruelle (2025)
Benchmark your potential! Explore examples of top-performing Airbnb properties in Saint-Jean-de-la-Ruellebased on Trailing Twelve Month (TTM) revenue. Analyze their characteristics, revenue, occupancy rate, and ADR to understand what drives success in this market.
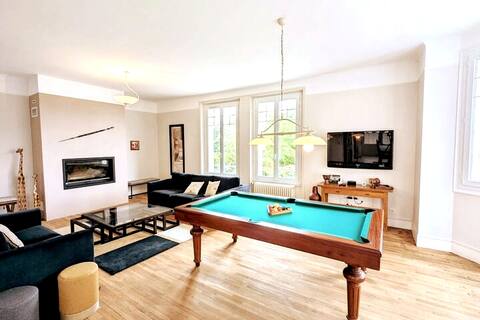
Villa * Loire View * Garden * Terrace * Parking
Entire Place • 4 bedrooms
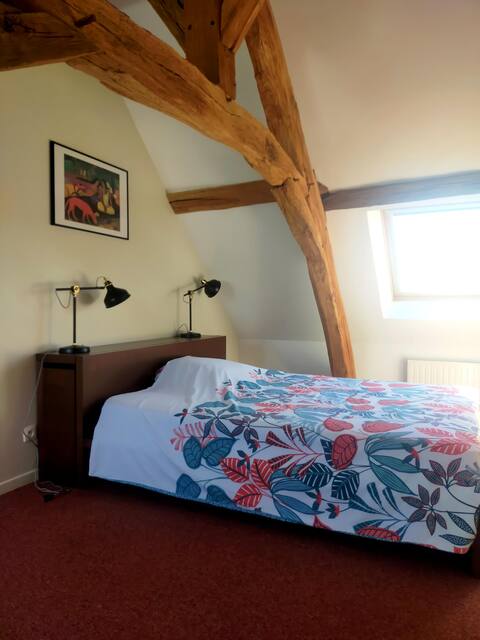
La Vaudière - Rooms in a local home
Private Room • 3 bedrooms
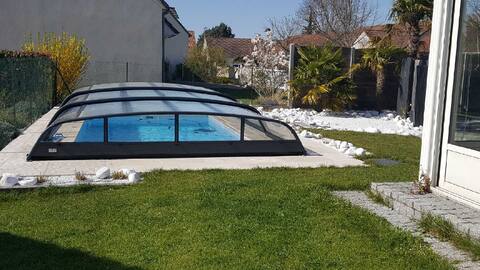
Renovated duplex, parking, garden.
Entire Place • 4 bedrooms
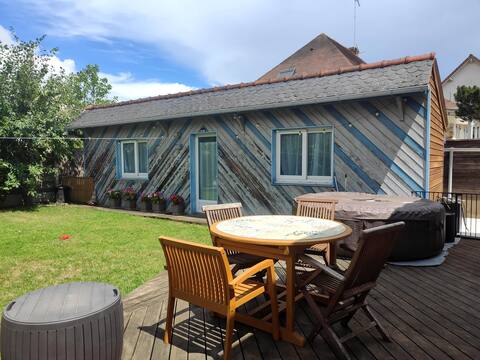
Casita in the spirit of the Loire
Entire Place • 1 bedroom
Beautiful townhouse!
Entire Place • 2 bedrooms
Chaleureux apartment
Entire Place • 2 bedrooms
Note: Performance varies based on location, size, amenities, seasonality, and management quality. Data reflects the past 12 months.
Top Performing Airbnb Hosts in Saint-Jean-de-la-Ruelle (2025)
Learn from the best! This table showcases top-performing Airbnb hosts in Saint-Jean-de-la-Ruelle based on the number of properties managed and estimated total revenue over the past year. Analyze their scale and performance metrics.
| Host Name | Properties | Grossing Revenue | Stay Reviews | Avg Rating |
|---|---|---|---|---|
| H Conciergerie | 1 | $45,230 | 20 | 4.70/5.0 |
| Didier | 3 | $28,790 | 128 | 4.93/5.0 |
| Charles | 1 | $13,671 | 5 | 4.60/5.0 |
| Matthieu Et Eugenia | 1 | $12,339 | 71 | 4.87/5.0 |
| Palakiyem | 1 | $10,657 | 13 | 4.62/5.0 |
| Steven | 1 | $10,579 | 69 | 4.74/5.0 |
| Guil'Home | 1 | $10,492 | 67 | 4.58/5.0 |
| Host #306459849 | 1 | $8,679 | 14 | 4.79/5.0 |
| Jodie | 1 | $8,178 | 150 | 4.48/5.0 |
| Emma | 1 | $8,101 | 10 | 5.00/5.0 |
Analyzing the strategies of top hosts, such as their property selection, pricing, and guest communication, can offer valuable lessons for optimizing your own Airbnb operations in Saint-Jean-de-la-Ruelle.
Dive Deeper: Advanced Saint-Jean-de-la-Ruelle STR Market Data (2025)
Ready to unlock more insights? AirROI provides access to advanced metrics and comprehensive Airbnb data for Saint-Jean-de-la-Ruelle. Explore detailed analytics beyond this report to refine your investment strategy, optimize pricing, and maximize your vacation rental profits.
Explore Advanced MetricsSaint-Jean-de-la-Ruelle Short-Term Rental Market Composition (2025): Property & Room Types
Room Type Distribution
Property Type Distribution
Market Composition Insights for Saint-Jean-de-la-Ruelle
- The Saint-Jean-de-la-Ruelle Airbnb market composition is heavily skewed towards Entire Home/Apt listings, which make up 63% of the 27 active rentals. This indicates strong guest preference for privacy and space.
- However, a notable 33.3% share for Private Rooms suggests opportunities for budget-conscious travelers or hosts renting out spare rooms.
- Looking at the property type distribution in Saint-Jean-de-la-Ruelle, Apartment/Condo properties are the most common (55.6%), reflecting the local real estate landscape.
- Houses represent a significant 40.7% portion, catering likely to families or larger groups.
- Smaller segments like hotel/boutique (combined 3.7%) offer potential for unique stay experiences.
Saint-Jean-de-la-Ruelle Airbnb Room Capacity Analysis (2025): Bedroom Distribution
Distribution of Listings by Number of Bedrooms
Room Capacity Insights for Saint-Jean-de-la-Ruelle
- The dominant room capacity in Saint-Jean-de-la-Ruelle is 1 bedroom listings, making up 33.3% of the market. This suggests a strong demand for properties suitable for couples or solo travelers.
- Together, 1 bedroom and 2 bedrooms properties represent 59.2% of the active Airbnb listings in Saint-Jean-de-la-Ruelle, indicating a high concentration in these sizes.
Saint-Jean-de-la-Ruelle Vacation Rental Guest Capacity Trends (2025)
Distribution of Listings by Guest Capacity
Guest Capacity Insights for Saint-Jean-de-la-Ruelle
- The most common guest capacity trend in Saint-Jean-de-la-Ruelle vacation rentals is listings accommodating 2 guests (22.2%). This suggests the primary traveler segment is likely couples or solo travelers.
- Properties designed for 2 guests and 4 guests dominate the Saint-Jean-de-la-Ruelle STR market, accounting for 37.0% of listings.
- 14.8% of properties accommodate 6+ guests, serving the market segment for larger families or group travel in Saint-Jean-de-la-Ruelle.
- On average, properties in Saint-Jean-de-la-Ruelle are equipped to host 2.7 guests.
Saint-Jean-de-la-Ruelle Airbnb Booking Patterns (2025): Available vs. Booked Days
Available Days Distribution
Booked Days Distribution
Booking Pattern Insights for Saint-Jean-de-la-Ruelle
- The most common availability pattern in Saint-Jean-de-la-Ruelle falls within the 181-270 days range, representing 40.7% of listings. This suggests many properties have significant open periods on their calendars.
- Approximately 74.0% of listings show high availability (181+ days open annually), indicating potential for increased bookings or specific owner usage patterns.
- For booked days, the 91-180 days range is most frequent in Saint-Jean-de-la-Ruelle (44.4%), reflecting common guest stay durations or potential owner blocking patterns.
- A notable 25.9% of properties secure long booking periods (181+ days booked per year), highlighting successful long-term rental strategies or significant owner usage.
Saint-Jean-de-la-Ruelle Airbnb Minimum Stay Requirements Analysis
Distribution of Listings by Minimum Night Requirement
1 Night
12 listings
48% of total
2 Nights
6 listings
24% of total
3 Nights
2 listings
8% of total
7-29 Nights
2 listings
8% of total
30+ Nights
3 listings
12% of total
Key Insights
- The most prevalent minimum stay requirement in Saint-Jean-de-la-Ruelle is 1 Night, adopted by 48% of listings. This highlights the market's preference for shorter, flexible bookings.
- A strong majority (72.0%) of the Saint-Jean-de-la-Ruelle Airbnb data shows acceptance of very short stays (1-2 nights), indicating a dynamic, high-turnover market.
- A significant segment (12%) caters to monthly stays (30+ nights) in Saint-Jean-de-la-Ruelle, pointing to opportunities in the extended-stay market.
Recommendations
- Align with the market by considering a 1 Night minimum stay, as 48% of Saint-Jean-de-la-Ruelle hosts use this setting.
- Explore offering discounts for stays of 30+ nights to attract the 12% of the market seeking extended stays.
- Adjust minimum nights based on seasonality – potentially shorter during low season and longer during peak demand periods in Saint-Jean-de-la-Ruelle.
Saint-Jean-de-la-Ruelle Airbnb Cancellation Policy Trends Analysis (2025)
Flexible
8 listings
33.3% of total
Moderate
9 listings
37.5% of total
Firm
2 listings
8.3% of total
Strict
5 listings
20.8% of total
Cancellation Policy Insights for Saint-Jean-de-la-Ruelle
- The prevailing Airbnb cancellation policy trend in Saint-Jean-de-la-Ruelle is Moderate, used by 37.5% of listings.
- The market strongly favors guest-friendly terms, with 70.8% of listings offering Flexible or Moderate policies. This suggests guests in Saint-Jean-de-la-Ruelle may expect booking flexibility.
Recommendations for Hosts
- Consider adopting a Moderate policy to align with the 37.5% market standard in Saint-Jean-de-la-Ruelle.
- Regularly review your cancellation policy against competitors and market demand shifts in Saint-Jean-de-la-Ruelle.
Saint-Jean-de-la-Ruelle STR Booking Lead Time Analysis (2025)
Average Booking Lead Time by Month
Booking Lead Time Insights for Saint-Jean-de-la-Ruelle
- The overall average booking lead time for vacation rentals in Saint-Jean-de-la-Ruelle is 42 days.
- Guests book furthest in advance for stays during July (average 82 days), likely coinciding with peak travel demand or local events.
- The shortest booking windows occur for stays in December (average 20 days), indicating more last-minute travel plans during this time.
- Seasonally, Summer (67 days avg.) sees the longest lead times, while Winter (26 days avg.) has the shortest, reflecting typical travel planning cycles.
Recommendations for Hosts
- Use the overall average lead time (42 days) as a baseline for your pricing and availability strategy in Saint-Jean-de-la-Ruelle.
- For July stays, consider implementing length-of-stay discounts or slightly higher rates for bookings made less than 82 days out to capitalize on advance planning.
- Target marketing efforts for the Summer season well in advance (at least 67 days) to capture early planners.
- Monitor your own booking lead times against these Saint-Jean-de-la-Ruelle averages to identify opportunities for dynamic pricing adjustments.
Popular & Essential Airbnb Amenities in Saint-Jean-de-la-Ruelle (2025)
Amenity Prevalence
Amenity Insights for Saint-Jean-de-la-Ruelle
- Popular amenities like Heating, Kitchen, Hot water are common but not universal. Offering these can provide a competitive edge.
- Warning: Wifi is not universally provided but is considered essential globally. Ensure reliable Wifi is offered.
Recommendations for Hosts
- Consider adding popular differentiators like Heating or Kitchen to increase appeal.
- Highlight unique or less common amenities you offer (e.g., hot tub, dedicated workspace, EV charger) in your listing description and photos.
- Regularly check competitor amenities in Saint-Jean-de-la-Ruelle to stay competitive.
Saint-Jean-de-la-Ruelle Airbnb Guest Demographics & Profile Analysis (2025)
Guest Profile Summary for Saint-Jean-de-la-Ruelle
- The typical guest profile for Airbnb in Saint-Jean-de-la-Ruelle consists of primarily domestic travelers (73%), often arriving from nearby Paris, typically belonging to the Post-2000s (Gen Z/Alpha) group (50%), primarily speaking French or English.
- Domestic travelers account for 73.4% of guests.
- Key international markets include France (73.4%) and Netherlands (7.9%).
- Top languages spoken are French (42.8%) followed by English (29.6%).
- A significant demographic segment is the Post-2000s (Gen Z/Alpha) group, representing 50% of guests.
Recommendations for Hosts
- Target domestic marketing efforts towards travelers from Paris and Orléans.
- Tailor amenities and listing descriptions to appeal to the dominant Post-2000s (Gen Z/Alpha) demographic (e.g., highlight fast WiFi, smart home features, local guides).
- Highlight unique local experiences or amenities relevant to the primary guest profile.
- Consider seasonal promotions aligned with peak travel times for key origin markets.
Nearby Short-Term Rental Market Comparison
How does the Saint-Jean-de-la-Ruelle Airbnb market stack up against its neighbors? Compare key performance metrics like average monthly revenue, ADR, and occupancy rates in surrounding areas to understand the broader regional STR landscape.
| Market | Active Properties | Monthly Revenue | Daily Rate | Avg. Occupancy |
|---|---|---|---|---|
| La Couture-Boussey | 12 | $3,620 | $378.08 | 28% |
| Dourdan | 15 | $3,576 | $223.06 | 52% |
| Millançay | 11 | $3,476 | $370.42 | 39% |
| Coteaux-sur-Loire | 19 | $3,328 | $270.00 | 41% |
| Chaintreaux | 11 | $3,136 | $278.28 | 34% |
| Langon-sur-Cher | 12 | $3,127 | $400.27 | 35% |
| Mesnils-sur-Iton | 22 | $3,028 | $309.05 | 40% |
| Tournan-en-Brie | 16 | $3,020 | $249.98 | 47% |
| Villiers-sur-Loir | 10 | $2,967 | $216.51 | 41% |
| Artannes-sur-Indre | 21 | $2,949 | $275.91 | 41% |