Mont-près-Chambord Airbnb Market Analysis 2025: Short Term Rental Data & Vacation Rental Statistics in Centre-Val de Loire, France
Is Airbnb profitable in Mont-près-Chambord in 2025? Explore comprehensive Airbnb analytics for Mont-près-Chambord, Centre-Val de Loire, France to uncover income potential. This 2025 STR market report for Mont-près-Chambord, based on AirROI data from April 2024 to March 2025, reveals key trends in the niche market of 50 active listings.
Whether you're considering an Airbnb investment in Mont-près-Chambord, optimizing your existing vacation rental, or exploring rental arbitrage opportunities, understanding the Mont-près-Chambord Airbnb data is crucial. Leveraging the low regulation environment is key to maximizing your short term rental income potential. Let's dive into the specifics.
Key Mont-près-Chambord Airbnb Performance Metrics Overview
Monthly Airbnb Revenue Variations & Income Potential in Mont-près-Chambord (2025)
Understanding the monthly revenue variations for Airbnb listings in Mont-près-Chambord is key to maximizing your short term rental income potential. Seasonality significantly impacts earnings. Our analysis, based on data from the past 12 months, shows that the peak revenue month for STRs in Mont-près-Chambord is typically August, while February often presents the lowest earnings, highlighting opportunities for strategic pricing adjustments during shoulder and low seasons. Explore the typical Airbnb income in Mont-près-Chambord across different performance tiers:
- Best-in-class properties (Top 10%) achieve $3,324+ monthly, often utilizing dynamic pricing and superior guest experiences.
- Strong performing properties (Top 25%) earn $1,878 or more, indicating effective management and desirable locations/amenities.
- Typical properties (Median) generate around $1,172 per month, representing the average market performance.
- Entry-level properties (Bottom 25%) see earnings around $615, often with potential for optimization.
Average Monthly Airbnb Earnings Trend in Mont-près-Chambord
Mont-près-Chambord Airbnb Occupancy Rate Trends (2025)
Maximize your bookings by understanding the Mont-près-Chambord STR occupancy trends. Seasonal demand shifts significantly influence how often properties are booked. Typically, Augustsees the highest demand (peak season occupancy), while January experiences the lowest (low season). Effective strategies, like adjusting minimum stays or offering promotions, can boost occupancy during slower periods. Here's how different property tiers perform in Mont-près-Chambord:
- Best-in-class properties (Top 10%) achieve 77%+ occupancy, indicating high desirability and potentially optimized availability.
- Strong performing properties (Top 25%) maintain 61% or higher occupancy, suggesting good market fit and guest satisfaction.
- Typical properties (Median) have an occupancy rate around 37%.
- Entry-level properties (Bottom 25%) average 19% occupancy, potentially facing higher vacancy.
Average Monthly Occupancy Rate Trend in Mont-près-Chambord
Average Daily Rate (ADR) Airbnb Trends in Mont-près-Chambord (2025)
Effective short term rental pricing strategy in Mont-près-Chambord involves understanding monthly ADR fluctuations. The Average Daily Rate (ADR) for Airbnb in Mont-près-Chambord typically peaks in May and dips lowest during March. Leveraging Airbnb dynamic pricing tools or strategies based on this seasonality can significantly boost revenue. Here's a look at the typical nightly rates achieved:
- Best-in-class properties (Top 10%) command rates of $301+ per night, often due to premium features or locations.
- Strong performing properties (Top 25%) achieve nightly rates of $158 or more.
- Typical properties (Median) charge around $95 per night.
- Entry-level properties (Bottom 25%) earn around $66 per night.
Average Daily Rate (ADR) Trend by Month in Mont-près-Chambord
Get Live Mont-près-Chambord Market Intelligence 👇

Explore Real-time Analytics
Airbnb Seasonality Analysis & Trends in Mont-près-Chambord (2025)
Peak Season (August, May, April)
- Revenue averages $2,442 per month
- Occupancy rates average 48.7%
- Daily rates average $167
Shoulder Season
- Revenue averages $1,785 per month
- Occupancy maintains around 42.7%
- Daily rates hold near $163
Low Season (January, February, March)
- Revenue drops to average $813 per month
- Occupancy decreases to average 30.5%
- Daily rates adjust to average $152
Seasonality Insights for Mont-près-Chambord
- The Airbnb seasonality in Mont-près-Chambord shows highly seasonal trends requiring careful strategy. While the sections above show seasonal averages, it's also insightful to look at the extremes:
- During the high season, the absolute peak month showcases Mont-près-Chambord's highest earning potential, with monthly revenues capable of climbing to $2,655, occupancy reaching a high of 66.2%, and ADRs peaking at $169.
- Conversely, the slowest single month of the year, typically falling within the low season, marks the market's lowest point. In this month, revenue might dip to $688, occupancy could drop to 21.5%, and ADRs may adjust down to $151.
- Understanding both the seasonal averages and these monthly peaks and troughs in revenue, occupancy, and ADR is crucial for maximizing your Airbnb profit potential in Mont-près-Chambord.
Seasonal Strategies for Maximizing Profit
- Peak Season: Maximize revenue through premium pricing and potentially longer minimum stays. Ensure high availability.
- Low Season: Offer competitive pricing, special promotions (e.g., extended stay discounts), and flexible cancellation policies. Target off-season travelers like remote workers or budget-conscious guests.
- Shoulder Seasons: Implement dynamic pricing that balances peak and low rates. Target weekend travelers or specific events. Offer slightly more flexible terms than peak season.
- Regularly analyze your own performance against these Mont-près-Chambord seasonality benchmarks and adjust your pricing and availability strategy accordingly.
Best Areas for Airbnb Investment in Mont-près-Chambord (2025)
Exploring the top neighborhoods for short-term rentals in Mont-près-Chambord? This section highlights key areas, outlining why they are attractive for hosts and guests, along with notable local attractions. Consider these locations based on your target guest profile and investment strategy.
| Neighborhood / Area | Why Host Here? (Target Guests & Appeal) | Key Attractions & Landmarks |
|---|---|---|
| Château de Chambord | One of the most recognizable châteaux in the world, known for its stunning French Renaissance architecture and beautiful grounds. A major tourist attraction, perfect for hosting guests. | Château de Chambord, Chambord Forest, Loire Valley vineyards, Canal de Briare, Parc Naturel Régional de la Brenne |
| Brouage | A charming fortified town with a rich history and beautiful architecture. Attracts visitors interested in history and picturesque scenery. | Brouage Citadel, Historical museum, Old port, Saint Louis Church, Local markets |
| St. Laurent Nouan | A quaint village located close to major attractions, offering tranquility and easy access to the surrounding nature and historical sites. | Nature trails, Lakes and parks, Local cuisine, Cycling routes |
| Beaugency | A lovely historic town along the Loire with beautiful medieval buildings and a charming ambiance. A perfect spot for visitors exploring the Loire Valley. | Beaugency Abbey, Loire River promenade, Historic town center, Local artisan shops |
| Blois | A vibrant city known for its rich history and proximity to many châteaux. Popular with tourists wanting to explore the Loire Valley. | Château de Blois, Maison de la Magie, Cloister of Sancta-Croix, Historic center |
| Amboise | Located on the banks of the Loire River, famous for its royal château and ties to Leonardo da Vinci. A great destination for history lovers. | Château d'Amboise, Clos Lucé, Val da Loire Wine Route, Scenic river views |
| Chaumont-sur-Loire | Known for its stunning château and international garden festival. Attracts tourists interested in arts and garden design. | Château de Chaumont, Garden Festival, Loire River views, Cycling paths |
| Cheverny | Famous for its grand château and picturesque landscapes. Offers insights into French nobility history and is a peaceful retreat. | Château de Cheverny, Wine tasting tours, Hunting grounds, Parks and gardens |
Understanding Airbnb License Requirements & STR Laws in Mont-près-Chambord (2025)
While Mont-près-Chambord, Centre-Val de Loire, France currently shows low STR regulations, specific Airbnb license requirements might still exist or change. Always verify the latest short term rental regulations and Airbnb license requirements directly with local government authorities for Mont-près-Chambord to ensure full compliance before hosting.
(Source: AirROI data, 2025, based on 4% licensed listings)
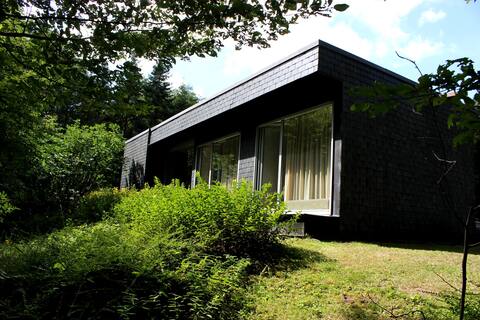
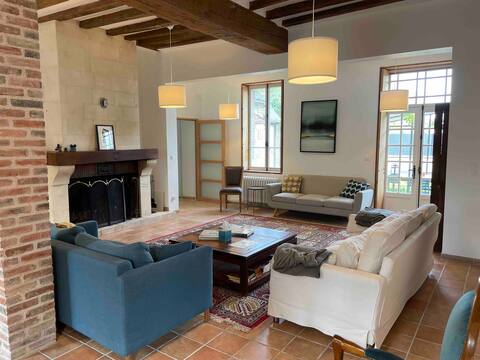
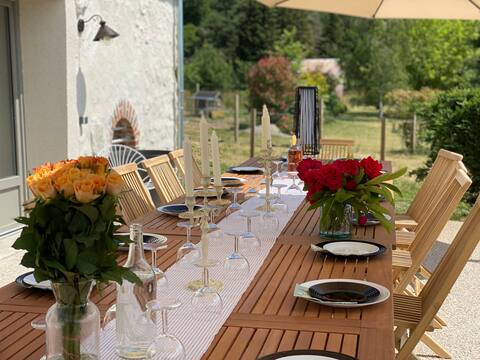
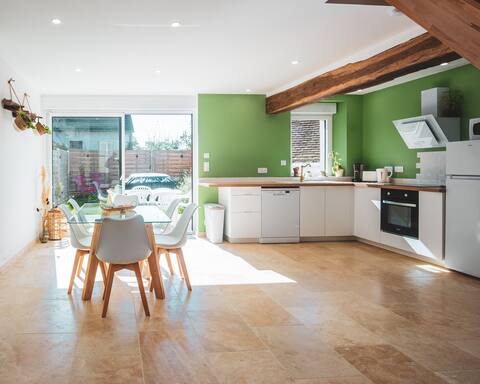
Top Performing Airbnb Properties in Mont-près-Chambord (2025)
Benchmark your potential! Explore examples of top-performing Airbnb properties in Mont-près-Chambordbased on Trailing Twelve Month (TTM) revenue. Analyze their characteristics, revenue, occupancy rate, and ADR to understand what drives success in this market.
VILL'ATYPICAL
Entire Place • 6 bedrooms
Gîte de Mont-Près-Chambord
Entire Place • 6 bedrooms
Le Verger Des Pierres Blanches, Pool 11.5m, 35p
Entire Place • 11 bedrooms

In the heart of the country of castles: Le Pres Chambord
Entire Place • 4 bedrooms
My(t) Gîte Near Chambord 3* Massage&Photo
Entire Place • 2 bedrooms

Gite de la chabardière
Entire Place • 4 bedrooms
Note: Performance varies based on location, size, amenities, seasonality, and management quality. Data reflects the past 12 months.
Top Performing Airbnb Hosts in Mont-près-Chambord (2025)
Learn from the best! This table showcases top-performing Airbnb hosts in Mont-près-Chambord based on the number of properties managed and estimated total revenue over the past year. Analyze their scale and performance metrics.
| Host Name | Properties | Grossing Revenue | Stay Reviews | Avg Rating |
|---|---|---|---|---|
| Elodie | 1 | $123,263 | 50 | 4.94/5.0 |
| Severine | 4 | $51,324 | 955 | 4.86/5.0 |
| Hussein | 1 | $51,127 | 6 | 4.67/5.0 |
| Alain | 1 | $48,783 | 5 | 4.40/5.0 |
| Christophe | 1 | $38,591 | 197 | 4.90/5.0 |
| Gaëlle | 1 | $36,850 | 54 | 4.89/5.0 |
| Quentin | 2 | $34,351 | 86 | 4.92/5.0 |
| Fanny | 2 | $32,453 | 160 | 4.77/5.0 |
| Gite De La Chabardière | 1 | $29,563 | 33 | 4.94/5.0 |
| Ulysse | 5 | $28,795 | 36 | 3.73/5.0 |
Analyzing the strategies of top hosts, such as their property selection, pricing, and guest communication, can offer valuable lessons for optimizing your own Airbnb operations in Mont-près-Chambord.
Dive Deeper: Advanced Mont-près-Chambord STR Market Data (2025)
Ready to unlock more insights? AirROI provides access to advanced metrics and comprehensive Airbnb data for Mont-près-Chambord. Explore detailed analytics beyond this report to refine your investment strategy, optimize pricing, and maximize your vacation rental profits.
Explore Advanced MetricsMont-près-Chambord Short-Term Rental Market Composition (2025): Property & Room Types
Room Type Distribution
Property Type Distribution
Market Composition Insights for Mont-près-Chambord
- The Mont-près-Chambord Airbnb market composition is heavily skewed towards Entire Home/Apt listings, which make up 88% of the 50 active rentals. This indicates strong guest preference for privacy and space.
- Looking at the property type distribution in Mont-près-Chambord, House properties are the most common (72%), reflecting the local real estate landscape.
- Houses represent a significant 72% portion, catering likely to families or larger groups.
- The presence of 8% Hotel/Boutique listings indicates integration with traditional hospitality.
- Smaller segments like others (combined 4.0%) offer potential for unique stay experiences.
Mont-près-Chambord Airbnb Room Capacity Analysis (2025): Bedroom Distribution
Distribution of Listings by Number of Bedrooms
Room Capacity Insights for Mont-près-Chambord
- The dominant room capacity in Mont-près-Chambord is 1 bedroom listings, making up 36% of the market. This suggests a strong demand for properties suitable for couples or solo travelers.
- Together, 1 bedroom and 2 bedrooms properties represent 56.0% of the active Airbnb listings in Mont-près-Chambord, indicating a high concentration in these sizes.
- A significant 34.0% of listings offer 3+ bedrooms, catering to larger groups and families seeking more space in Mont-près-Chambord.
Mont-près-Chambord Vacation Rental Guest Capacity Trends (2025)
Distribution of Listings by Guest Capacity
Guest Capacity Insights for Mont-près-Chambord
- The most common guest capacity trend in Mont-près-Chambord vacation rentals is listings accommodating 4 guests (20%). This suggests the primary traveler segment is likely small families or groups.
- Properties designed for 4 guests and 8+ guests dominate the Mont-près-Chambord STR market, accounting for 40.0% of listings.
- 38.0% of properties accommodate 6+ guests, serving the market segment for larger families or group travel in Mont-près-Chambord.
- On average, properties in Mont-près-Chambord are equipped to host 4.4 guests.
Mont-près-Chambord Airbnb Booking Patterns (2025): Available vs. Booked Days
Available Days Distribution
Booked Days Distribution
Booking Pattern Insights for Mont-près-Chambord
- The most common availability pattern in Mont-près-Chambord falls within the 271-366 days range, representing 42% of listings. This suggests many properties have significant open periods on their calendars.
- Approximately 64.0% of listings show high availability (181+ days open annually), indicating potential for increased bookings or specific owner usage patterns.
- For booked days, the 181-270 days range is most frequent in Mont-près-Chambord (34%), reflecting common guest stay durations or potential owner blocking patterns.
- A notable 36.0% of properties secure long booking periods (181+ days booked per year), highlighting successful long-term rental strategies or significant owner usage.
Mont-près-Chambord Airbnb Minimum Stay Requirements Analysis
Distribution of Listings by Minimum Night Requirement
1 Night
11 listings
22.4% of total
2 Nights
27 listings
55.1% of total
3 Nights
5 listings
10.2% of total
4-6 Nights
2 listings
4.1% of total
30+ Nights
4 listings
8.2% of total
Key Insights
- The most prevalent minimum stay requirement in Mont-près-Chambord is 2 Nights, adopted by 55.1% of listings. This highlights the market's preference for shorter, flexible bookings.
- A strong majority (77.5%) of the Mont-près-Chambord Airbnb data shows acceptance of very short stays (1-2 nights), indicating a dynamic, high-turnover market.
Recommendations
- Align with the market by considering a 2 Nights minimum stay, as 55.1% of Mont-près-Chambord hosts use this setting.
- If feasible, allowing 1-night stays, especially midweek or during low season, could capture last-minute bookings, as only 22.4% currently do.
- Explore offering discounts for stays of 30+ nights to attract the 8.2% of the market seeking extended stays.
- Adjust minimum nights based on seasonality – potentially shorter during low season and longer during peak demand periods in Mont-près-Chambord.
Mont-près-Chambord Airbnb Cancellation Policy Trends Analysis (2025)
Flexible
18 listings
37.5% of total
Moderate
13 listings
27.1% of total
Firm
9 listings
18.8% of total
Strict
8 listings
16.7% of total
Cancellation Policy Insights for Mont-près-Chambord
- The prevailing Airbnb cancellation policy trend in Mont-près-Chambord is Flexible, used by 37.5% of listings.
- There's a relatively balanced mix between guest-friendly (64.6%) and stricter (35.5%) policies, offering choices for different guest needs.
Recommendations for Hosts
- Consider adopting a Flexible policy to align with the 37.5% market standard in Mont-près-Chambord.
- Regularly review your cancellation policy against competitors and market demand shifts in Mont-près-Chambord.
Mont-près-Chambord STR Booking Lead Time Analysis (2025)
Average Booking Lead Time by Month
Booking Lead Time Insights for Mont-près-Chambord
- The overall average booking lead time for vacation rentals in Mont-près-Chambord is 55 days.
- Guests book furthest in advance for stays during July (average 78 days), likely coinciding with peak travel demand or local events.
- The shortest booking windows occur for stays in February (average 21 days), indicating more last-minute travel plans during this time.
- Seasonally, Summer (69 days avg.) sees the longest lead times, while Winter (39 days avg.) has the shortest, reflecting typical travel planning cycles.
Recommendations for Hosts
- Use the overall average lead time (55 days) as a baseline for your pricing and availability strategy in Mont-près-Chambord.
- For July stays, consider implementing length-of-stay discounts or slightly higher rates for bookings made less than 78 days out to capitalize on advance planning.
- Target marketing efforts for the Summer season well in advance (at least 69 days) to capture early planners.
- Monitor your own booking lead times against these Mont-près-Chambord averages to identify opportunities for dynamic pricing adjustments.
Popular & Essential Airbnb Amenities in Mont-près-Chambord (2025)
Amenity Prevalence
Amenity Insights for Mont-près-Chambord
- Essential amenities in Mont-près-Chambord that guests expect include: Free parking on premises, Heating. Lacking these (any) could significantly impact bookings.
- Popular amenities like Kitchen, TV, Hot water are common but not universal. Offering these can provide a competitive edge.
Recommendations for Hosts
- Ensure your listing includes all essential amenities for Mont-près-Chambord: Free parking on premises, Heating.
- Prioritize adding missing essentials: Heating.
- Consider adding popular differentiators like Kitchen or TV to increase appeal.
- Highlight unique or less common amenities you offer (e.g., hot tub, dedicated workspace, EV charger) in your listing description and photos.
- Regularly check competitor amenities in Mont-près-Chambord to stay competitive.
Mont-près-Chambord Airbnb Guest Demographics & Profile Analysis (2025)
Guest Profile Summary for Mont-près-Chambord
- The typical guest profile for Airbnb in Mont-près-Chambord consists of primarily domestic travelers (89%), often arriving from nearby Paris, typically belonging to the Post-2000s (Gen Z/Alpha) group (50%), primarily speaking French or English.
- Domestic travelers account for 89.4% of guests.
- Key international markets include France (89.4%) and Netherlands (2.1%).
- Top languages spoken are French (49.2%) followed by English (28.9%).
- A significant demographic segment is the Post-2000s (Gen Z/Alpha) group, representing 50% of guests.
Recommendations for Hosts
- Target domestic marketing efforts towards travelers from Paris and Bordeaux.
- Tailor amenities and listing descriptions to appeal to the dominant Post-2000s (Gen Z/Alpha) demographic (e.g., highlight fast WiFi, smart home features, local guides).
- Highlight unique local experiences or amenities relevant to the primary guest profile.
- Consider seasonal promotions aligned with peak travel times for key origin markets.
Nearby Short-Term Rental Market Comparison
How does the Mont-près-Chambord Airbnb market stack up against its neighbors? Compare key performance metrics like average monthly revenue, ADR, and occupancy rates in surrounding areas to understand the broader regional STR landscape.
| Market | Active Properties | Monthly Revenue | Daily Rate | Avg. Occupancy |
|---|---|---|---|---|
| La Couture-Boussey | 12 | $3,620 | $378.08 | 28% |
| Dourdan | 15 | $3,576 | $223.06 | 52% |
| Millançay | 11 | $3,476 | $370.42 | 39% |
| Coteaux-sur-Loire | 19 | $3,328 | $270.00 | 41% |
| Chaintreaux | 11 | $3,136 | $278.28 | 34% |
| Langon-sur-Cher | 12 | $3,127 | $400.27 | 35% |
| Mesnils-sur-Iton | 22 | $3,028 | $309.05 | 40% |
| Tournan-en-Brie | 16 | $3,020 | $249.98 | 47% |
| Villiers-sur-Loir | 10 | $2,967 | $216.51 | 41% |
| Artannes-sur-Indre | 21 | $2,949 | $275.91 | 41% |