Les Montils Airbnb Market Analysis 2025: Short Term Rental Data & Vacation Rental Statistics in Centre-Val de Loire, France
Is Airbnb profitable in Les Montils in 2025? Explore comprehensive Airbnb analytics for Les Montils, Centre-Val de Loire, France to uncover income potential. This 2025 STR market report for Les Montils, based on AirROI data from April 2024 to March 2025, reveals key trends in the niche market of 17 active listings.
Whether you're considering an Airbnb investment in Les Montils, optimizing your existing vacation rental, or exploring rental arbitrage opportunities, understanding the Les Montils Airbnb data is crucial. Leveraging the low regulation environment is key to maximizing your short term rental income potential. Let's dive into the specifics.
Key Les Montils Airbnb Performance Metrics Overview
Monthly Airbnb Revenue Variations & Income Potential in Les Montils (2025)
Understanding the monthly revenue variations for Airbnb listings in Les Montils is key to maximizing your short term rental income potential. Seasonality significantly impacts earnings. Our analysis, based on data from the past 12 months, shows that the peak revenue month for STRs in Les Montils is typically August, while March often presents the lowest earnings, highlighting opportunities for strategic pricing adjustments during shoulder and low seasons. Explore the typical Airbnb income in Les Montils across different performance tiers:
- Best-in-class properties (Top 10%) achieve $2,548+ monthly, often utilizing dynamic pricing and superior guest experiences.
- Strong performing properties (Top 25%) earn $1,672 or more, indicating effective management and desirable locations/amenities.
- Typical properties (Median) generate around $952 per month, representing the average market performance.
- Entry-level properties (Bottom 25%) see earnings around $606, often with potential for optimization.
Average Monthly Airbnb Earnings Trend in Les Montils
Les Montils Airbnb Occupancy Rate Trends (2025)
Maximize your bookings by understanding the Les Montils STR occupancy trends. Seasonal demand shifts significantly influence how often properties are booked. Typically, Augustsees the highest demand (peak season occupancy), while March experiences the lowest (low season). Effective strategies, like adjusting minimum stays or offering promotions, can boost occupancy during slower periods. Here's how different property tiers perform in Les Montils:
- Best-in-class properties (Top 10%) achieve 64%+ occupancy, indicating high desirability and potentially optimized availability.
- Strong performing properties (Top 25%) maintain 49% or higher occupancy, suggesting good market fit and guest satisfaction.
- Typical properties (Median) have an occupancy rate around 31%.
- Entry-level properties (Bottom 25%) average 16% occupancy, potentially facing higher vacancy.
Average Monthly Occupancy Rate Trend in Les Montils
Average Daily Rate (ADR) Airbnb Trends in Les Montils (2025)
Effective short term rental pricing strategy in Les Montils involves understanding monthly ADR fluctuations. The Average Daily Rate (ADR) for Airbnb in Les Montils typically peaks in July and dips lowest during January. Leveraging Airbnb dynamic pricing tools or strategies based on this seasonality can significantly boost revenue. Here's a look at the typical nightly rates achieved:
- Best-in-class properties (Top 10%) command rates of $225+ per night, often due to premium features or locations.
- Strong performing properties (Top 25%) achieve nightly rates of $134 or more.
- Typical properties (Median) charge around $91 per night.
- Entry-level properties (Bottom 25%) earn around $65 per night.
Average Daily Rate (ADR) Trend by Month in Les Montils
Get Live Les Montils Market Intelligence 👇

Explore Real-time Analytics
Airbnb Seasonality Analysis & Trends in Les Montils (2025)
Peak Season (August, July, May)
- Revenue averages $2,194 per month
- Occupancy rates average 56.4%
- Daily rates average $194
Shoulder Season
- Revenue averages $1,071 per month
- Occupancy maintains around 31.8%
- Daily rates hold near $161
Low Season (February, March, December)
- Revenue drops to average $608 per month
- Occupancy decreases to average 20.5%
- Daily rates adjust to average $105
Seasonality Insights for Les Montils
- The Airbnb seasonality in Les Montils shows highly seasonal trends requiring careful strategy. While the sections above show seasonal averages, it's also insightful to look at the extremes:
- During the high season, the absolute peak month showcases Les Montils's highest earning potential, with monthly revenues capable of climbing to $2,479, occupancy reaching a high of 69.3%, and ADRs peaking at $196.
- Conversely, the slowest single month of the year, typically falling within the low season, marks the market's lowest point. In this month, revenue might dip to $548, occupancy could drop to 18.1%, and ADRs may adjust down to $103.
- Understanding both the seasonal averages and these monthly peaks and troughs in revenue, occupancy, and ADR is crucial for maximizing your Airbnb profit potential in Les Montils.
Seasonal Strategies for Maximizing Profit
- Peak Season: Maximize revenue through premium pricing and potentially longer minimum stays. Ensure high availability.
- Low Season: Offer competitive pricing, special promotions (e.g., extended stay discounts), and flexible cancellation policies. Target off-season travelers like remote workers or budget-conscious guests.
- Shoulder Seasons: Implement dynamic pricing that balances peak and low rates. Target weekend travelers or specific events. Offer slightly more flexible terms than peak season.
- Regularly analyze your own performance against these Les Montils seasonality benchmarks and adjust your pricing and availability strategy accordingly.
Best Areas for Airbnb Investment in Les Montils (2025)
Exploring the top neighborhoods for short-term rentals in Les Montils? This section highlights key areas, outlining why they are attractive for hosts and guests, along with notable local attractions. Consider these locations based on your target guest profile and investment strategy.
| Neighborhood / Area | Why Host Here? (Target Guests & Appeal) | Key Attractions & Landmarks |
|---|---|---|
| Les Montils Centre | Quaint village setting in the heart of the Loire Valley, perfect for tourists seeking a tranquil getaway amidst beautiful nature and historic sites. | Château de Chambord, Château de Blois, Beauval Zoo, Loire Valley vineyards, Cycling routes along the Loire river |
| Historic Blois | Nearby town rich in history and architecture, ideal for travelers wanting to explore Loire's châteaux and heritage sites. | Blois Castle, Maison de la Magie, St. Louis Cathedral, Loire river banks, Les Jardins de l'Ancien Évêché |
| Château de Chambord | One of the most iconic châteaux in France, attracting visitors year-round who are interested in architecture and French history. | Château de Chambord, Gardens of Chambord, Cycling paths, Loire river views, Wildlife parks |
| Cheverny | Famous for its château and gardens, which attract visitors interested in grandeur of French noble estates. | Château de Cheverny, Cheverny's gardens, Hunting museum, Local wine tastings, Cycling nearby |
| Villandry | Home to stunning Renaissance gardens, popular with families and couples looking for romantic getaways and picturesque vistas. | Château de Villandry, Gardens of Villandry, Nearby vineyards, Historic town center, Cycling routes |
| Amboise | Charming town that once housed Leonardo da Vinci, perfect for tourists interested in art and history with a vibrant market and eateries. | Château d'Amboise, Clos Lucé, Amboise market, View over the Loire, Wine tasting opportunities |
| Touraine | A region known for its beautiful landscapes and rich cultural heritage, ideal for visitors who want a deeper experience of French life and history. | Local vineyards, Historic châteaux, Cycling along the Loire, Artisan crafts fair, Wine festivals |
| Chevrette | A peaceful hamlet ideal for country lovers, providing a rustic escape for guests looking for a quiet retreat yet close to main attractions of Loire Valley. | Natural trails, Farm visits, Bird watching, Local festivals, Wine tastings |
Understanding Airbnb License Requirements & STR Laws in Les Montils (2025)
While Les Montils, Centre-Val de Loire, France currently shows low STR regulations, specific Airbnb license requirements might still exist or change. Always verify the latest short term rental regulations and Airbnb license requirements directly with local government authorities for Les Montils to ensure full compliance before hosting.
(Source: AirROI data, 2025, based on 6% licensed listings)
Top Performing Airbnb Properties in Les Montils (2025)
Benchmark your potential! Explore examples of top-performing Airbnb properties in Les Montilsbased on Trailing Twelve Month (TTM) revenue. Analyze their characteristics, revenue, occupancy rate, and ADR to understand what drives success in this market.
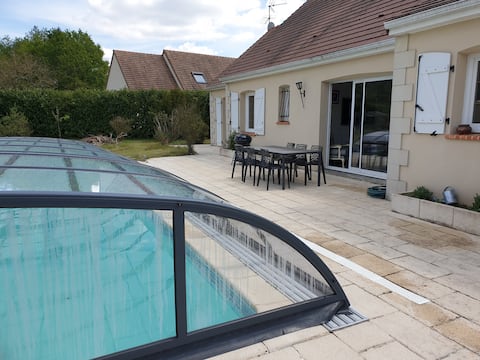
Quiet house for 6 people
Entire Place • 3 bedrooms

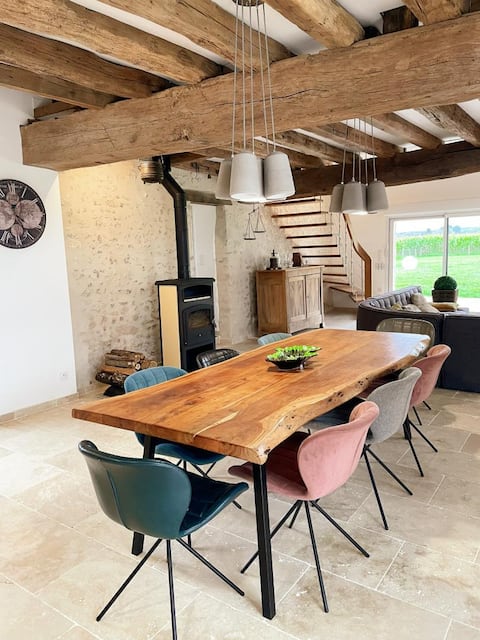
La Moyendrie: Exceptional cottage in the field.
Entire Place • 2 bedrooms
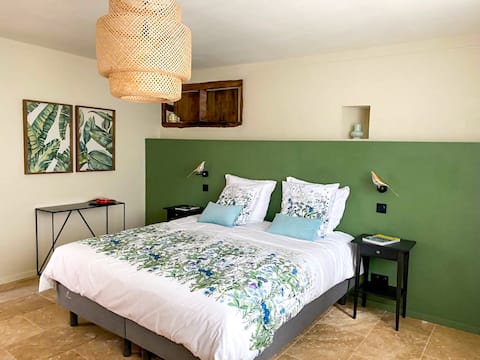
La Molinière, beautiful house with cathedral stay
Entire Place • 4 bedrooms
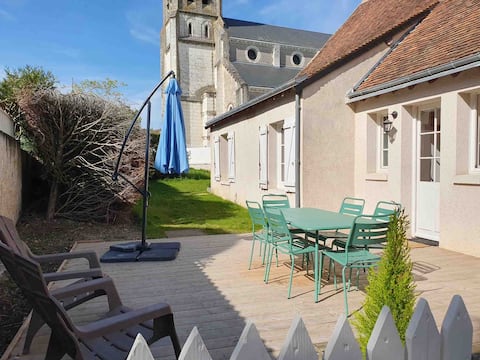
Le gîte des vieux Montils
Entire Place • 1 bedroom
The Presbytery
Entire Place • 2 bedrooms
A wing in a farmhouse
Entire Place • 2 bedrooms
Note: Performance varies based on location, size, amenities, seasonality, and management quality. Data reflects the past 12 months.
Top Performing Airbnb Hosts in Les Montils (2025)
Learn from the best! This table showcases top-performing Airbnb hosts in Les Montils based on the number of properties managed and estimated total revenue over the past year. Analyze their scale and performance metrics.
| Host Name | Properties | Grossing Revenue | Stay Reviews | Avg Rating |
|---|---|---|---|---|
| Doriane Et Laura | 2 | $26,741 | 55 | 4.83/5.0 |
| Ann-Gaelle | 1 | $19,808 | 46 | 4.93/5.0 |
| Quentin | 1 | $18,514 | 50 | 4.96/5.0 |
| Elise Et Fabrice | 1 | $18,393 | 30 | 5.00/5.0 |
| Conciergerie Du Domaine Des Ch | 1 | $17,836 | 6 | 4.67/5.0 |
| Caroline | 1 | $15,290 | 38 | 4.97/5.0 |
| Agnès | 1 | $15,278 | 34 | 4.82/5.0 |
| Nico Et Audrey | 1 | $12,433 | 208 | 4.85/5.0 |
| Annie | 1 | $8,222 | 51 | 4.98/5.0 |
| Sandrine | 1 | $7,394 | 16 | 4.50/5.0 |
Analyzing the strategies of top hosts, such as their property selection, pricing, and guest communication, can offer valuable lessons for optimizing your own Airbnb operations in Les Montils.
Dive Deeper: Advanced Les Montils STR Market Data (2025)
Ready to unlock more insights? AirROI provides access to advanced metrics and comprehensive Airbnb data for Les Montils. Explore detailed analytics beyond this report to refine your investment strategy, optimize pricing, and maximize your vacation rental profits.
Explore Advanced MetricsLes Montils Short-Term Rental Market Composition (2025): Property & Room Types
Room Type Distribution
Property Type Distribution
Market Composition Insights for Les Montils
- The Les Montils Airbnb market composition is heavily skewed towards Entire Home/Apt listings, which make up 76.5% of the 17 active rentals. This indicates strong guest preference for privacy and space.
- Looking at the property type distribution in Les Montils, House properties are the most common (88.2%), reflecting the local real estate landscape.
- Houses represent a significant 88.2% portion, catering likely to families or larger groups.
Les Montils Airbnb Room Capacity Analysis (2025): Bedroom Distribution
Distribution of Listings by Number of Bedrooms
Room Capacity Insights for Les Montils
- The dominant room capacity in Les Montils is 2 bedrooms listings, making up 35.3% of the market. This suggests a strong demand for properties suitable for couples or solo travelers.
- Together, 2 bedrooms and 1 bedroom properties represent 58.8% of the active Airbnb listings in Les Montils, indicating a high concentration in these sizes.
- A significant 23.6% of listings offer 3+ bedrooms, catering to larger groups and families seeking more space in Les Montils.
Les Montils Vacation Rental Guest Capacity Trends (2025)
Distribution of Listings by Guest Capacity
Guest Capacity Insights for Les Montils
- The most common guest capacity trend in Les Montils vacation rentals is listings accommodating 6 guests (23.5%). This suggests the primary traveler segment is likely larger groups.
- Properties designed for 6 guests and 2 guests dominate the Les Montils STR market, accounting for 41.1% of listings.
- 35.3% of properties accommodate 6+ guests, serving the market segment for larger families or group travel in Les Montils.
- On average, properties in Les Montils are equipped to host 4.0 guests.
Les Montils Airbnb Booking Patterns (2025): Available vs. Booked Days
Available Days Distribution
Booked Days Distribution
Booking Pattern Insights for Les Montils
- The most common availability pattern in Les Montils falls within the 271-366 days range, representing 52.9% of listings. This suggests many properties have significant open periods on their calendars.
- Approximately 88.2% of listings show high availability (181+ days open annually), indicating potential for increased bookings or specific owner usage patterns.
- For booked days, the 91-180 days range is most frequent in Les Montils (41.2%), reflecting common guest stay durations or potential owner blocking patterns.
- A notable 17.6% of properties secure long booking periods (181+ days booked per year), highlighting successful long-term rental strategies or significant owner usage.
Les Montils Airbnb Minimum Stay Requirements Analysis
Distribution of Listings by Minimum Night Requirement
1 Night
7 listings
41.2% of total
2 Nights
9 listings
52.9% of total
30+ Nights
1 listings
5.9% of total
Key Insights
- The most prevalent minimum stay requirement in Les Montils is 2 Nights, adopted by 52.9% of listings. This highlights the market's preference for shorter, flexible bookings.
- A strong majority (94.1%) of the Les Montils Airbnb data shows acceptance of very short stays (1-2 nights), indicating a dynamic, high-turnover market.
Recommendations
- Align with the market by considering a 2 Nights minimum stay, as 52.9% of Les Montils hosts use this setting.
- Explore offering discounts for stays of 30+ nights to attract the 5.9% of the market seeking extended stays.
- Adjust minimum nights based on seasonality – potentially shorter during low season and longer during peak demand periods in Les Montils.
Les Montils Airbnb Cancellation Policy Trends Analysis (2025)
Super Strict 60 Days
1 listings
5.9% of total
Flexible
6 listings
35.3% of total
Moderate
6 listings
35.3% of total
Firm
2 listings
11.8% of total
Strict
2 listings
11.8% of total
Cancellation Policy Insights for Les Montils
- The prevailing Airbnb cancellation policy trend in Les Montils is Flexible, used by 35.3% of listings.
- The market strongly favors guest-friendly terms, with 70.6% of listings offering Flexible or Moderate policies. This suggests guests in Les Montils may expect booking flexibility.
Recommendations for Hosts
- Consider adopting a Flexible policy to align with the 35.3% market standard in Les Montils.
- Using a Strict policy might deter some guests, as only 11.8% of listings use it. Evaluate if potential revenue protection outweighs possible lower booking rates.
- Regularly review your cancellation policy against competitors and market demand shifts in Les Montils.
Les Montils STR Booking Lead Time Analysis (2025)
Average Booking Lead Time by Month
Booking Lead Time Insights for Les Montils
- The overall average booking lead time for vacation rentals in Les Montils is 40 days.
- Guests book furthest in advance for stays during July (average 78 days), likely coinciding with peak travel demand or local events.
- The shortest booking windows occur for stays in February (average 18 days), indicating more last-minute travel plans during this time.
- Seasonally, Summer (63 days avg.) sees the longest lead times, while Winter (25 days avg.) has the shortest, reflecting typical travel planning cycles.
Recommendations for Hosts
- Use the overall average lead time (40 days) as a baseline for your pricing and availability strategy in Les Montils.
- For July stays, consider implementing length-of-stay discounts or slightly higher rates for bookings made less than 78 days out to capitalize on advance planning.
- Target marketing efforts for the Summer season well in advance (at least 63 days) to capture early planners.
- Monitor your own booking lead times against these Les Montils averages to identify opportunities for dynamic pricing adjustments.
Popular & Essential Airbnb Amenities in Les Montils (2025)
Amenity Prevalence
Amenity Insights for Les Montils
- Popular amenities like Kitchen, Wifi, Free parking on premises are common but not universal. Offering these can provide a competitive edge.
- Warning: Wifi is not universally provided but is considered essential globally. Ensure reliable Wifi is offered.
Recommendations for Hosts
- Consider adding popular differentiators like Kitchen or Wifi to increase appeal.
- Highlight unique or less common amenities you offer (e.g., hot tub, dedicated workspace, EV charger) in your listing description and photos.
- Regularly check competitor amenities in Les Montils to stay competitive.
Les Montils Airbnb Guest Demographics & Profile Analysis (2025)
Guest Profile Summary for Les Montils
- The typical guest profile for Airbnb in Les Montils consists of primarily domestic travelers (89%), often arriving from nearby Paris, typically belonging to the Post-2000s (Gen Z/Alpha) group (50%), primarily speaking French or English.
- Domestic travelers account for 89.2% of guests.
- Key international markets include France (89.2%) and Germany (2%).
- Top languages spoken are French (47.2%) followed by English (34%).
- A significant demographic segment is the Post-2000s (Gen Z/Alpha) group, representing 50% of guests.
Recommendations for Hosts
- Target domestic marketing efforts towards travelers from Paris and Nantes.
- Tailor amenities and listing descriptions to appeal to the dominant Post-2000s (Gen Z/Alpha) demographic (e.g., highlight fast WiFi, smart home features, local guides).
- Highlight unique local experiences or amenities relevant to the primary guest profile.
- Consider seasonal promotions aligned with peak travel times for key origin markets.
Nearby Short-Term Rental Market Comparison
How does the Les Montils Airbnb market stack up against its neighbors? Compare key performance metrics like average monthly revenue, ADR, and occupancy rates in surrounding areas to understand the broader regional STR landscape.
| Market | Active Properties | Monthly Revenue | Daily Rate | Avg. Occupancy |
|---|---|---|---|---|
| La Couture-Boussey | 12 | $3,620 | $378.08 | 28% |
| Dourdan | 15 | $3,576 | $223.06 | 52% |
| Millançay | 11 | $3,476 | $370.42 | 39% |
| Coteaux-sur-Loire | 19 | $3,328 | $270.00 | 41% |
| Chaintreaux | 11 | $3,136 | $278.28 | 34% |
| Langon-sur-Cher | 12 | $3,127 | $400.27 | 35% |
| Mesnils-sur-Iton | 22 | $3,028 | $309.05 | 40% |
| Tournan-en-Brie | 16 | $3,020 | $249.98 | 47% |
| Villiers-sur-Loir | 10 | $2,967 | $216.51 | 41% |
| Artannes-sur-Indre | 21 | $2,949 | $275.91 | 41% |