La Ville-aux-Dames Airbnb Market Analysis 2025: Short Term Rental Data & Vacation Rental Statistics in Centre-Val de Loire, France
Is Airbnb profitable in La Ville-aux-Dames in 2025? Explore comprehensive Airbnb analytics for La Ville-aux-Dames, Centre-Val de Loire, France to uncover income potential. This 2025 STR market report for La Ville-aux-Dames, based on AirROI data from April 2024 to March 2025, reveals key trends in the niche market of 22 active listings.
Whether you're considering an Airbnb investment in La Ville-aux-Dames, optimizing your existing vacation rental, or exploring rental arbitrage opportunities, understanding the La Ville-aux-Dames Airbnb data is crucial. Leveraging the low regulation environment is key to maximizing your short term rental income potential. Let's dive into the specifics.
Key La Ville-aux-Dames Airbnb Performance Metrics Overview
Monthly Airbnb Revenue Variations & Income Potential in La Ville-aux-Dames (2025)
Understanding the monthly revenue variations for Airbnb listings in La Ville-aux-Dames is key to maximizing your short term rental income potential. Seasonality significantly impacts earnings. Our analysis, based on data from the past 12 months, shows that the peak revenue month for STRs in La Ville-aux-Dames is typically August, while March often presents the lowest earnings, highlighting opportunities for strategic pricing adjustments during shoulder and low seasons. Explore the typical Airbnb income in La Ville-aux-Dames across different performance tiers:
- Best-in-class properties (Top 10%) achieve $2,093+ monthly, often utilizing dynamic pricing and superior guest experiences.
- Strong performing properties (Top 25%) earn $1,401 or more, indicating effective management and desirable locations/amenities.
- Typical properties (Median) generate around $599 per month, representing the average market performance.
- Entry-level properties (Bottom 25%) see earnings around $200, often with potential for optimization.
Average Monthly Airbnb Earnings Trend in La Ville-aux-Dames
La Ville-aux-Dames Airbnb Occupancy Rate Trends (2025)
Maximize your bookings by understanding the La Ville-aux-Dames STR occupancy trends. Seasonal demand shifts significantly influence how often properties are booked. Typically, Augustsees the highest demand (peak season occupancy), while June experiences the lowest (low season). Effective strategies, like adjusting minimum stays or offering promotions, can boost occupancy during slower periods. Here's how different property tiers perform in La Ville-aux-Dames:
- Best-in-class properties (Top 10%) achieve 75%+ occupancy, indicating high desirability and potentially optimized availability.
- Strong performing properties (Top 25%) maintain 55% or higher occupancy, suggesting good market fit and guest satisfaction.
- Typical properties (Median) have an occupancy rate around 26%.
- Entry-level properties (Bottom 25%) average 12% occupancy, potentially facing higher vacancy.
Average Monthly Occupancy Rate Trend in La Ville-aux-Dames
Average Daily Rate (ADR) Airbnb Trends in La Ville-aux-Dames (2025)
Effective short term rental pricing strategy in La Ville-aux-Dames involves understanding monthly ADR fluctuations. The Average Daily Rate (ADR) for Airbnb in La Ville-aux-Dames typically peaks in August and dips lowest during April. Leveraging Airbnb dynamic pricing tools or strategies based on this seasonality can significantly boost revenue. Here's a look at the typical nightly rates achieved:
- Best-in-class properties (Top 10%) command rates of $161+ per night, often due to premium features or locations.
- Strong performing properties (Top 25%) achieve nightly rates of $113 or more.
- Typical properties (Median) charge around $78 per night.
- Entry-level properties (Bottom 25%) earn around $38 per night.
Average Daily Rate (ADR) Trend by Month in La Ville-aux-Dames
Get Live La Ville-aux-Dames Market Intelligence 👇

Explore Real-time Analytics
Airbnb Seasonality Analysis & Trends in La Ville-aux-Dames (2025)
Peak Season (August, July, May)
- Revenue averages $1,544 per month
- Occupancy rates average 47.4%
- Daily rates average $88
Shoulder Season
- Revenue averages $1,000 per month
- Occupancy maintains around 33.5%
- Daily rates hold near $86
Low Season (January, February, March)
- Revenue drops to average $483 per month
- Occupancy decreases to average 27.8%
- Daily rates adjust to average $87
Seasonality Insights for La Ville-aux-Dames
- The Airbnb seasonality in La Ville-aux-Dames shows highly seasonal trends requiring careful strategy. While the sections above show seasonal averages, it's also insightful to look at the extremes:
- During the high season, the absolute peak month showcases La Ville-aux-Dames's highest earning potential, with monthly revenues capable of climbing to $1,667, occupancy reaching a high of 50.4%, and ADRs peaking at $91.
- Conversely, the slowest single month of the year, typically falling within the low season, marks the market's lowest point. In this month, revenue might dip to $407, occupancy could drop to 23.3%, and ADRs may adjust down to $83.
- Understanding both the seasonal averages and these monthly peaks and troughs in revenue, occupancy, and ADR is crucial for maximizing your Airbnb profit potential in La Ville-aux-Dames.
Seasonal Strategies for Maximizing Profit
- Peak Season: Maximize revenue through premium pricing and potentially longer minimum stays. Ensure high availability.
- Low Season: Offer competitive pricing, special promotions (e.g., extended stay discounts), and flexible cancellation policies. Target off-season travelers like remote workers or budget-conscious guests.
- Shoulder Seasons: Implement dynamic pricing that balances peak and low rates. Target weekend travelers or specific events. Offer slightly more flexible terms than peak season.
- Regularly analyze your own performance against these La Ville-aux-Dames seasonality benchmarks and adjust your pricing and availability strategy accordingly.
Best Areas for Airbnb Investment in La Ville-aux-Dames (2025)
Exploring the top neighborhoods for short-term rentals in La Ville-aux-Dames? This section highlights key areas, outlining why they are attractive for hosts and guests, along with notable local attractions. Consider these locations based on your target guest profile and investment strategy.
| Neighborhood / Area | Why Host Here? (Target Guests & Appeal) | Key Attractions & Landmarks |
|---|---|---|
| La Ville-aux-Dames Centre | Close proximity to Tours, offering charm and convenience. Ideal for tourists seeking a quiet retreat while still having access to city amenities. | Château de Villandry, Château de Langeais, Tours city center, Loire Valley vineyards, Parc de la Perraudière, Rives du Cher |
| Historic Centre | Rich in history and culture, this area will appeal to visitors interested in heritage sites and local cuisine. Offers a unique blend of historical charm and modern conveniences. | Cathédrale Saint-Gatien, Place Plumereau, Musée des Beaux-Arts, Cloister of la Psalette, Rue Nationale, Gastronomic restaurants |
| Bois de la Rousselière | Surrounded by woods, this area provides a serene escape for nature lovers. A great spot for hosting guests looking for outdoor activities. | Bois de la Rousselière park, Walking trails, Cycling paths, Nature observation spots, Picnic areas, Nearby river |
| Vineyard Regions | A short drive from La Ville-aux-Dames, the vineyards of the Loire Valley attract wine enthusiasts. Perfect for wine tourism and related events. | Wine tasting tours, Vineyard tours, Châteaux, Local markets, Gastronomy events, Cycling through vineyards |
| Cultural Tours | Proximity to numerous historical landmarks and cultural sites, suitable for tourists interested in heritage and the arts. | Château de Chenonceau, Château de Amboise, Local art galleries, Historical societies, Cultural events, Museums |
| Les Halles de Tours | A vibrant marketplace with local produce and goods, ideal for guests wanting an authentic French experience. Frequented by locals and tourists alike. | Tourist markets, Local cafes, Gastronomy events, Culinary classes, Cultural exhibitions, Street performances |
| Le Parc des Expositions | Hosts various events and fairs, attracting tourists and business travelers. A great location for event-based stays. | Annual trade fairs, Exposition events, Business conventions, Local shows, Theater performances, Gastropubs nearby |
| Île Simon | An island on the Cher River, providing a picturesque setting for relaxation and scenic views. A hidden gem for visitors looking for tranquility. | Parks and gardens, Walking paths, Picnic spots, River activities, Photographic opportunities, Birdwatching |
Understanding Airbnb License Requirements & STR Laws in La Ville-aux-Dames (2025)
While La Ville-aux-Dames, Centre-Val de Loire, France currently shows low STR regulations, specific Airbnb license requirements might still exist or change. Always verify the latest short term rental regulations and Airbnb license requirements directly with local government authorities for La Ville-aux-Dames to ensure full compliance before hosting.
(Source: AirROI data, 2025, based on 5% licensed listings)
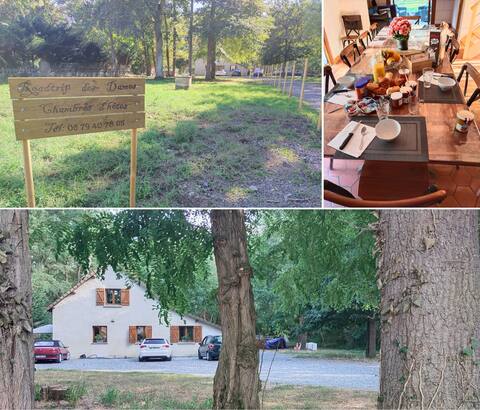
Top Performing Airbnb Properties in La Ville-aux-Dames (2025)
Benchmark your potential! Explore examples of top-performing Airbnb properties in La Ville-aux-Damesbased on Trailing Twelve Month (TTM) revenue. Analyze their characteristics, revenue, occupancy rate, and ADR to understand what drives success in this market.
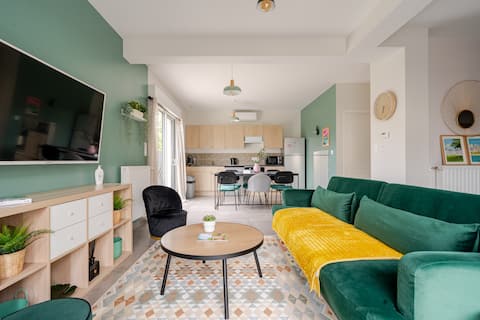
New Villa 6 pers - 5mn Tours - Cosy - Castles
Entire Place • 3 bedrooms
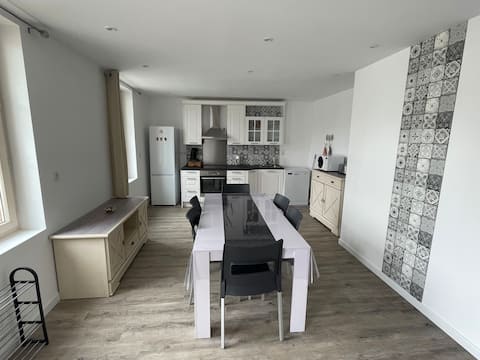
House in the heart of the castles of the Loire by bike
Entire Place • 3 bedrooms
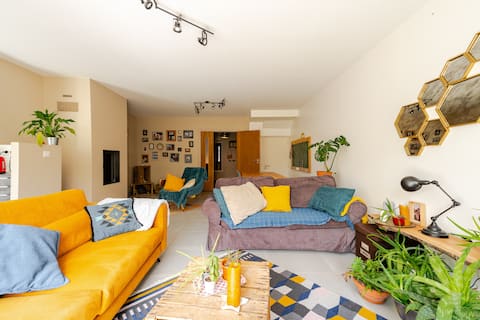
Private house in the heart of the castles of the Loire Valley
Entire Place • 5 bedrooms
Arizona bed and breakfasts with SPA ACCESS
Private Room • N/A
Cozy little tourangelle farmhouse
Entire Place • 1 bedroom
Road Trip des Dames - Bed and breakfasts Texas
Private Room • N/A
Note: Performance varies based on location, size, amenities, seasonality, and management quality. Data reflects the past 12 months.
Top Performing Airbnb Hosts in La Ville-aux-Dames (2025)
Learn from the best! This table showcases top-performing Airbnb hosts in La Ville-aux-Dames based on the number of properties managed and estimated total revenue over the past year. Analyze their scale and performance metrics.
| Host Name | Properties | Grossing Revenue | Stay Reviews | Avg Rating |
|---|---|---|---|---|
| Kary | 1 | $46,689 | 55 | 4.98/5.0 |
| Nadia | 3 | $31,779 | 152 | 4.92/5.0 |
| Frédéric | 7 | $23,405 | 50 | 1.25/5.0 |
| Christophe | 2 | $18,611 | 101 | 4.92/5.0 |
| Michael | 1 | $18,362 | 29 | 4.86/5.0 |
| Julie | 1 | $13,157 | 12 | 4.92/5.0 |
| Julie | 1 | $9,270 | 51 | 4.96/5.0 |
| Jean-Marc & Dalila | 3 | $8,981 | 425 | 4.59/5.0 |
| Christelle | 2 | $1,499 | 69 | 4.87/5.0 |
| Annie | 1 | $794 | 20 | 4.25/5.0 |
Analyzing the strategies of top hosts, such as their property selection, pricing, and guest communication, can offer valuable lessons for optimizing your own Airbnb operations in La Ville-aux-Dames.
Dive Deeper: Advanced La Ville-aux-Dames STR Market Data (2025)
Ready to unlock more insights? AirROI provides access to advanced metrics and comprehensive Airbnb data for La Ville-aux-Dames. Explore detailed analytics beyond this report to refine your investment strategy, optimize pricing, and maximize your vacation rental profits.
Explore Advanced MetricsLa Ville-aux-Dames Short-Term Rental Market Composition (2025): Property & Room Types
Room Type Distribution
Property Type Distribution
Market Composition Insights for La Ville-aux-Dames
- The La Ville-aux-Dames Airbnb market composition is heavily skewed towards Entire Home/Apt listings, which make up 54.5% of the 22 active rentals. This indicates strong guest preference for privacy and space.
- However, a notable 45.5% share for Private Rooms suggests opportunities for budget-conscious travelers or hosts renting out spare rooms.
- Looking at the property type distribution in La Ville-aux-Dames, House properties are the most common (72.7%), reflecting the local real estate landscape.
- Houses represent a significant 72.7% portion, catering likely to families or larger groups.
- The presence of 22.7% Hotel/Boutique listings indicates integration with traditional hospitality.
- Smaller segments like apartment/condo (combined 4.5%) offer potential for unique stay experiences.
La Ville-aux-Dames Airbnb Room Capacity Analysis (2025): Bedroom Distribution
Distribution of Listings by Number of Bedrooms
Room Capacity Insights for La Ville-aux-Dames
- The dominant room capacity in La Ville-aux-Dames is 1 bedroom listings, making up 31.8% of the market. This suggests a strong demand for properties suitable for couples or solo travelers.
- Together, 1 bedroom and 3 bedrooms properties represent 63.6% of the active Airbnb listings in La Ville-aux-Dames, indicating a high concentration in these sizes.
- A significant 36.3% of listings offer 3+ bedrooms, catering to larger groups and families seeking more space in La Ville-aux-Dames.
La Ville-aux-Dames Vacation Rental Guest Capacity Trends (2025)
Distribution of Listings by Guest Capacity
Guest Capacity Insights for La Ville-aux-Dames
- The most common guest capacity trend in La Ville-aux-Dames vacation rentals is listings accommodating 6 guests (27.3%). This suggests the primary traveler segment is likely larger groups.
- Properties designed for 6 guests and 2 guests dominate the La Ville-aux-Dames STR market, accounting for 40.9% of listings.
- 36.3% of properties accommodate 6+ guests, serving the market segment for larger families or group travel in La Ville-aux-Dames.
- On average, properties in La Ville-aux-Dames are equipped to host 3.1 guests.
La Ville-aux-Dames Airbnb Booking Patterns (2025): Available vs. Booked Days
Available Days Distribution
Booked Days Distribution
Booking Pattern Insights for La Ville-aux-Dames
- The most common availability pattern in La Ville-aux-Dames falls within the 271-366 days range, representing 54.5% of listings. This suggests many properties have significant open periods on their calendars.
- Approximately 90.9% of listings show high availability (181+ days open annually), indicating potential for increased bookings or specific owner usage patterns.
- For booked days, the 91-180 days range is most frequent in La Ville-aux-Dames (36.4%), reflecting common guest stay durations or potential owner blocking patterns.
- A notable 9.0% of properties secure long booking periods (181+ days booked per year), highlighting successful long-term rental strategies or significant owner usage.
La Ville-aux-Dames Airbnb Minimum Stay Requirements Analysis
Distribution of Listings by Minimum Night Requirement
1 Night
11 listings
61.1% of total
2 Nights
5 listings
27.8% of total
3 Nights
1 listings
5.6% of total
4-6 Nights
1 listings
5.6% of total
Key Insights
- The most prevalent minimum stay requirement in La Ville-aux-Dames is 1 Night, adopted by 61.1% of listings. This highlights the market's preference for shorter, flexible bookings.
- A strong majority (88.9%) of the La Ville-aux-Dames Airbnb data shows acceptance of very short stays (1-2 nights), indicating a dynamic, high-turnover market.
Recommendations
- Align with the market by considering a 1 Night minimum stay, as 61.1% of La Ville-aux-Dames hosts use this setting.
- Adjust minimum nights based on seasonality – potentially shorter during low season and longer during peak demand periods in La Ville-aux-Dames.
La Ville-aux-Dames Airbnb Cancellation Policy Trends Analysis (2025)
Flexible
7 listings
41.2% of total
Moderate
9 listings
52.9% of total
Firm
1 listings
5.9% of total
Cancellation Policy Insights for La Ville-aux-Dames
- The prevailing Airbnb cancellation policy trend in La Ville-aux-Dames is Moderate, used by 52.9% of listings.
- The market strongly favors guest-friendly terms, with 94.1% of listings offering Flexible or Moderate policies. This suggests guests in La Ville-aux-Dames may expect booking flexibility.
Recommendations for Hosts
- Consider adopting a Moderate policy to align with the 52.9% market standard in La Ville-aux-Dames.
- Regularly review your cancellation policy against competitors and market demand shifts in La Ville-aux-Dames.
La Ville-aux-Dames STR Booking Lead Time Analysis (2025)
Average Booking Lead Time by Month
Booking Lead Time Insights for La Ville-aux-Dames
- The overall average booking lead time for vacation rentals in La Ville-aux-Dames is 24 days.
- Guests book furthest in advance for stays during July (average 50 days), likely coinciding with peak travel demand or local events.
- The shortest booking windows occur for stays in November (average 22 days), indicating more last-minute travel plans during this time.
- Seasonally, Summer (43 days avg.) sees the longest lead times, while Fall (27 days avg.) has the shortest, reflecting typical travel planning cycles.
Recommendations for Hosts
- Use the overall average lead time (24 days) as a baseline for your pricing and availability strategy in La Ville-aux-Dames.
- For July stays, consider implementing length-of-stay discounts or slightly higher rates for bookings made less than 50 days out to capitalize on advance planning.
- Target marketing efforts for the Summer season well in advance (at least 43 days) to capture early planners.
- Monitor your own booking lead times against these La Ville-aux-Dames averages to identify opportunities for dynamic pricing adjustments.
Popular & Essential Airbnb Amenities in La Ville-aux-Dames (2025)
Amenity Prevalence
Amenity Insights for La Ville-aux-Dames
- Essential amenities in La Ville-aux-Dames that guests expect include: Wifi, Kitchen, Heating, Hot water. Lacking these (any) could significantly impact bookings.
- Popular amenities like Free parking on premises, Essentials, Cooking basics are common but not universal. Offering these can provide a competitive edge.
Recommendations for Hosts
- Ensure your listing includes all essential amenities for La Ville-aux-Dames: Wifi, Kitchen, Heating, Hot water.
- Prioritize adding missing essentials: Kitchen, Heating, Hot water.
- Consider adding popular differentiators like Free parking on premises or Essentials to increase appeal.
- Highlight unique or less common amenities you offer (e.g., hot tub, dedicated workspace, EV charger) in your listing description and photos.
- Regularly check competitor amenities in La Ville-aux-Dames to stay competitive.
La Ville-aux-Dames Airbnb Guest Demographics & Profile Analysis (2025)
Guest Profile Summary for La Ville-aux-Dames
- The typical guest profile for Airbnb in La Ville-aux-Dames consists of primarily domestic travelers (83%), often arriving from nearby Paris, typically belonging to the Post-2000s (Gen Z/Alpha) group (50%), primarily speaking French or English.
- Domestic travelers account for 83.1% of guests.
- Key international markets include France (83.1%) and Belgium (3.7%).
- Top languages spoken are French (42.2%) followed by English (35.8%).
- A significant demographic segment is the Post-2000s (Gen Z/Alpha) group, representing 50% of guests.
Recommendations for Hosts
- Target domestic marketing efforts towards travelers from Paris and Lyon.
- Tailor amenities and listing descriptions to appeal to the dominant Post-2000s (Gen Z/Alpha) demographic (e.g., highlight fast WiFi, smart home features, local guides).
- Highlight unique local experiences or amenities relevant to the primary guest profile.
- Consider seasonal promotions aligned with peak travel times for key origin markets.
Nearby Short-Term Rental Market Comparison
How does the La Ville-aux-Dames Airbnb market stack up against its neighbors? Compare key performance metrics like average monthly revenue, ADR, and occupancy rates in surrounding areas to understand the broader regional STR landscape.
| Market | Active Properties | Monthly Revenue | Daily Rate | Avg. Occupancy |
|---|---|---|---|---|
| La Couture-Boussey | 12 | $3,620 | $378.08 | 28% |
| Millançay | 11 | $3,476 | $370.42 | 39% |
| Coteaux-sur-Loire | 19 | $3,328 | $270.00 | 41% |
| Moulins-le-Carbonnel | 11 | $3,213 | $320.85 | 35% |
| Langon-sur-Cher | 12 | $3,127 | $400.27 | 35% |
| Mesnils-sur-Iton | 22 | $3,028 | $309.05 | 40% |
| Villiers-sur-Loir | 10 | $2,967 | $216.51 | 41% |
| Artannes-sur-Indre | 21 | $2,949 | $275.91 | 41% |
| Vallon-sur-Gée | 11 | $2,913 | $379.01 | 30% |
| La Ferté-en-Ouche | 19 | $2,854 | $258.24 | 39% |