La Riche Airbnb Market Analysis 2025: Short Term Rental Data & Vacation Rental Statistics in Centre-Val de Loire, France
Is Airbnb profitable in La Riche in 2025? Explore comprehensive Airbnb analytics for La Riche, Centre-Val de Loire, France to uncover income potential. This 2025 STR market report for La Riche, based on AirROI data from April 2024 to March 2025, reveals key trends in the niche market of 30 active listings.
Whether you're considering an Airbnb investment in La Riche, optimizing your existing vacation rental, or exploring rental arbitrage opportunities, understanding the La Riche Airbnb data is crucial. Leveraging the low regulation environment is key to maximizing your short term rental income potential. Let's dive into the specifics.
Key La Riche Airbnb Performance Metrics Overview
Monthly Airbnb Revenue Variations & Income Potential in La Riche (2025)
Understanding the monthly revenue variations for Airbnb listings in La Riche is key to maximizing your short term rental income potential. Seasonality significantly impacts earnings. Our analysis, based on data from the past 12 months, shows that the peak revenue month for STRs in La Riche is typically May, while March often presents the lowest earnings, highlighting opportunities for strategic pricing adjustments during shoulder and low seasons. Explore the typical Airbnb income in La Riche across different performance tiers:
- Best-in-class properties (Top 10%) achieve $2,545+ monthly, often utilizing dynamic pricing and superior guest experiences.
- Strong performing properties (Top 25%) earn $1,556 or more, indicating effective management and desirable locations/amenities.
- Typical properties (Median) generate around $862 per month, representing the average market performance.
- Entry-level properties (Bottom 25%) see earnings around $494, often with potential for optimization.
Average Monthly Airbnb Earnings Trend in La Riche
La Riche Airbnb Occupancy Rate Trends (2025)
Maximize your bookings by understanding the La Riche STR occupancy trends. Seasonal demand shifts significantly influence how often properties are booked. Typically, Maysees the highest demand (peak season occupancy), while January experiences the lowest (low season). Effective strategies, like adjusting minimum stays or offering promotions, can boost occupancy during slower periods. Here's how different property tiers perform in La Riche:
- Best-in-class properties (Top 10%) achieve 84%+ occupancy, indicating high desirability and potentially optimized availability.
- Strong performing properties (Top 25%) maintain 68% or higher occupancy, suggesting good market fit and guest satisfaction.
- Typical properties (Median) have an occupancy rate around 42%.
- Entry-level properties (Bottom 25%) average 22% occupancy, potentially facing higher vacancy.
Average Monthly Occupancy Rate Trend in La Riche
Average Daily Rate (ADR) Airbnb Trends in La Riche (2025)
Effective short term rental pricing strategy in La Riche involves understanding monthly ADR fluctuations. The Average Daily Rate (ADR) for Airbnb in La Riche typically peaks in July and dips lowest during February. Leveraging Airbnb dynamic pricing tools or strategies based on this seasonality can significantly boost revenue. Here's a look at the typical nightly rates achieved:
- Best-in-class properties (Top 10%) command rates of $124+ per night, often due to premium features or locations.
- Strong performing properties (Top 25%) achieve nightly rates of $88 or more.
- Typical properties (Median) charge around $64 per night.
- Entry-level properties (Bottom 25%) earn around $45 per night.
Average Daily Rate (ADR) Trend by Month in La Riche
Get Live La Riche Market Intelligence 👇

Explore Real-time Analytics
Airbnb Seasonality Analysis & Trends in La Riche (2025)
Peak Season (May, April, August)
- Revenue averages $1,486 per month
- Occupancy rates average 52.3%
- Daily rates average $83
Shoulder Season
- Revenue averages $1,195 per month
- Occupancy maintains around 46.4%
- Daily rates hold near $80
Low Season (January, February, March)
- Revenue drops to average $867 per month
- Occupancy decreases to average 35.9%
- Daily rates adjust to average $72
Seasonality Insights for La Riche
- The Airbnb seasonality in La Riche shows moderate seasonality with distinct peak and low periods. While the sections above show seasonal averages, it's also insightful to look at the extremes:
- During the high season, the absolute peak month showcases La Riche's highest earning potential, with monthly revenues capable of climbing to $1,605, occupancy reaching a high of 54.8%, and ADRs peaking at $85.
- Conversely, the slowest single month of the year, typically falling within the low season, marks the market's lowest point. In this month, revenue might dip to $825, occupancy could drop to 32.4%, and ADRs may adjust down to $71.
- Understanding both the seasonal averages and these monthly peaks and troughs in revenue, occupancy, and ADR is crucial for maximizing your Airbnb profit potential in La Riche.
Seasonal Strategies for Maximizing Profit
- Peak Season: Maximize revenue through premium pricing and potentially longer minimum stays. Ensure high availability.
- Low Season: Offer competitive pricing, special promotions (e.g., extended stay discounts), and flexible cancellation policies. Target off-season travelers like remote workers or budget-conscious guests.
- Shoulder Seasons: Implement dynamic pricing that balances peak and low rates. Target weekend travelers or specific events. Offer slightly more flexible terms than peak season.
- Regularly analyze your own performance against these La Riche seasonality benchmarks and adjust your pricing and availability strategy accordingly.
Best Areas for Airbnb Investment in La Riche (2025)
Exploring the top neighborhoods for short-term rentals in La Riche? This section highlights key areas, outlining why they are attractive for hosts and guests, along with notable local attractions. Consider these locations based on your target guest profile and investment strategy.
| Neighborhood / Area | Why Host Here? (Target Guests & Appeal) | Key Attractions & Landmarks |
|---|---|---|
| Centre-ville | The city center of La Riche offers proximity to shops, restaurants, and local attractions. Ideal for tourists wanting to explore the area without traveling far. | Château de Rigny, Église Saint-Jean-Baptiste, Local markets, Cafés and bistros, Shopping districts |
| Parc des Expositions | An area known for hosting various events and exhibitions, making it ideal for business travelers. It's conveniently located near transportation links as well. | Parc des Expositions, Railway station, Nearby hotels, Restaurants, Exhibition centers |
| Lac de la Riche | A serene lakeside area perfect for relaxation and outdoor activities. Great location for families and those seeking a nature experience close to the city. | Lac de la Riche, Walking trails, Picnic areas, Water sports, Wildlife viewing |
| Les Hauts de la Riche | A residential area that offers a quiet retreat while still being close to the city's amenities. Attractive for long-term stays and peaceful getaways. | Local parks, Riverside walks, Playgrounds, Family-friendly amenities, Community events |
| Château de Tours | Very close to this historic château, attracting tourists and those interested in French heritage and culture. Perfect for historical tourism. | Château de Tours, Gardens, Local history museums, Cultural events, Guided tours |
| Cité des Arts | An artistic district showcasing local art and culture, attracting visitors who appreciate the creative scene. Perfect for those looking for a unique experience. | Art galleries, Performance venues, Workshops, Cultural festivals, Art markets |
| Les Graslin | A lively neighborhood known for its dining and nightlife, popular among young travelers looking for entertainment and social experiences. | Restaurants, Bars, Nightclubs, Live music venues, Cafés |
| Zone Commerciale | A hub for shopping and amenities, convenient for travelers who want easy access to stores and services during their stay. Ideal for longer visits. | Shopping centers, Restaurants, Supermarkets, Convenience stores, Entertainment options |
Understanding Airbnb License Requirements & STR Laws in La Riche (2025)
While La Riche, Centre-Val de Loire, France currently shows low STR regulations, specific Airbnb license requirements might still exist or change. Always verify the latest short term rental regulations and Airbnb license requirements directly with local government authorities for La Riche to ensure full compliance before hosting.
(Source: AirROI data, 2025, based on 3% licensed listings)
Top Performing Airbnb Properties in La Riche (2025)
Benchmark your potential! Explore examples of top-performing Airbnb properties in La Richebased on Trailing Twelve Month (TTM) revenue. Analyze their characteristics, revenue, occupancy rate, and ADR to understand what drives success in this market.
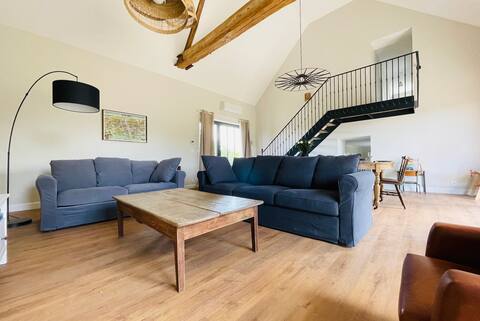
La grange du Pigeonnier authenticity and
Entire Place • 4 bedrooms
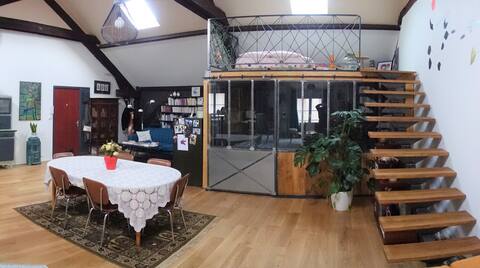
Loft/Atelier
Entire Place • 1 bedroom

Apartment 4-6 people
Entire Place • 2 bedrooms
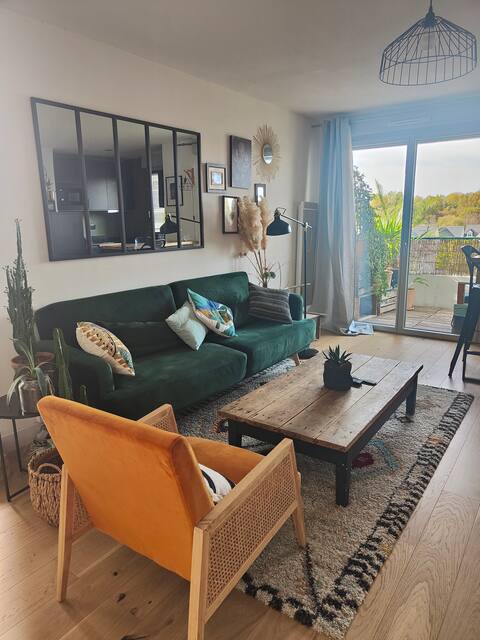
Bright F2 with large terrace
Entire Place • 1 bedroom
Le Dahlia / Botanical Garden/ Ground Floor
Entire Place • 1 bedroom

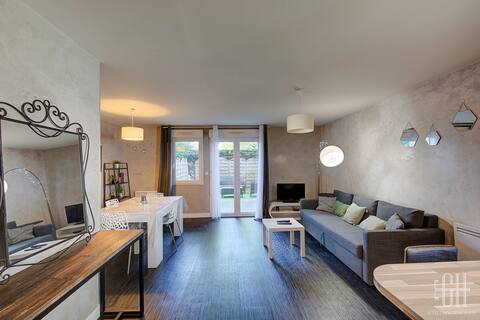
Apartment near city center
Entire Place • 1 bedroom
Note: Performance varies based on location, size, amenities, seasonality, and management quality. Data reflects the past 12 months.
Top Performing Airbnb Hosts in La Riche (2025)
Learn from the best! This table showcases top-performing Airbnb hosts in La Riche based on the number of properties managed and estimated total revenue over the past year. Analyze their scale and performance metrics.
| Host Name | Properties | Grossing Revenue | Stay Reviews | Avg Rating |
|---|---|---|---|---|
| Inbed | 1 | $43,996 | 84 | 4.93/5.0 |
| Helene | 1 | $41,947 | 19 | 5.00/5.0 |
| Jacques | 4 | $29,098 | 34 | 4.87/5.0 |
| Sylène | 2 | $25,113 | 119 | 4.60/5.0 |
| Alexis | 1 | $24,112 | 15 | 4.67/5.0 |
| Gwenael | 1 | $21,319 | 18 | 4.94/5.0 |
| Alexandra | 1 | $19,551 | 13 | 4.54/5.0 |
| Amandine | 1 | $14,897 | 31 | 4.87/5.0 |
| Franck | 1 | $12,464 | 8 | 4.88/5.0 |
| Welhome Conciergerie | 1 | $12,111 | 7 | 4.29/5.0 |
Analyzing the strategies of top hosts, such as their property selection, pricing, and guest communication, can offer valuable lessons for optimizing your own Airbnb operations in La Riche.
Dive Deeper: Advanced La Riche STR Market Data (2025)
Ready to unlock more insights? AirROI provides access to advanced metrics and comprehensive Airbnb data for La Riche. Explore detailed analytics beyond this report to refine your investment strategy, optimize pricing, and maximize your vacation rental profits.
Explore Advanced MetricsLa Riche Short-Term Rental Market Composition (2025): Property & Room Types
Room Type Distribution
Property Type Distribution
Market Composition Insights for La Riche
- The La Riche Airbnb market composition is heavily skewed towards Entire Home/Apt listings, which make up 80% of the 30 active rentals. This indicates strong guest preference for privacy and space.
- Looking at the property type distribution in La Riche, Apartment/Condo properties are the most common (60%), reflecting the local real estate landscape.
- Houses represent a significant 36.7% portion, catering likely to families or larger groups.
- Smaller segments like others (combined 3.3%) offer potential for unique stay experiences.
La Riche Airbnb Room Capacity Analysis (2025): Bedroom Distribution
Distribution of Listings by Number of Bedrooms
Room Capacity Insights for La Riche
- The dominant room capacity in La Riche is 1 bedroom listings, making up 46.7% of the market. This suggests a strong demand for properties suitable for couples or solo travelers.
- Together, 1 bedroom and 2 bedrooms properties represent 60.0% of the active Airbnb listings in La Riche, indicating a high concentration in these sizes.
La Riche Vacation Rental Guest Capacity Trends (2025)
Distribution of Listings by Guest Capacity
Guest Capacity Insights for La Riche
- The most common guest capacity trend in La Riche vacation rentals is listings accommodating 2 guests (30%). This suggests the primary traveler segment is likely couples or solo travelers.
- Properties designed for 2 guests and 4 guests dominate the La Riche STR market, accounting for 56.7% of listings.
- 13.4% of properties accommodate 6+ guests, serving the market segment for larger families or group travel in La Riche.
- On average, properties in La Riche are equipped to host 2.9 guests.
La Riche Airbnb Booking Patterns (2025): Available vs. Booked Days
Available Days Distribution
Booked Days Distribution
Booking Pattern Insights for La Riche
- The most common availability pattern in La Riche falls within the 181-270 days range, representing 36.7% of listings. This suggests many properties have significant open periods on their calendars.
- Approximately 73.4% of listings show high availability (181+ days open annually), indicating potential for increased bookings or specific owner usage patterns.
- For booked days, the 91-180 days range is most frequent in La Riche (36.7%), reflecting common guest stay durations or potential owner blocking patterns.
- A notable 30.0% of properties secure long booking periods (181+ days booked per year), highlighting successful long-term rental strategies or significant owner usage.
La Riche Airbnb Minimum Stay Requirements Analysis
Distribution of Listings by Minimum Night Requirement
1 Night
10 listings
34.5% of total
2 Nights
10 listings
34.5% of total
3 Nights
6 listings
20.7% of total
4-6 Nights
2 listings
6.9% of total
30+ Nights
1 listings
3.4% of total
Key Insights
- The most prevalent minimum stay requirement in La Riche is 1 Night, adopted by 34.5% of listings. This highlights the market's preference for shorter, flexible bookings.
- A strong majority (69.0%) of the La Riche Airbnb data shows acceptance of very short stays (1-2 nights), indicating a dynamic, high-turnover market.
Recommendations
- Align with the market by considering a 1 Night minimum stay, as 34.5% of La Riche hosts use this setting.
- Adjust minimum nights based on seasonality – potentially shorter during low season and longer during peak demand periods in La Riche.
La Riche Airbnb Cancellation Policy Trends Analysis (2025)
Flexible
10 listings
34.5% of total
Moderate
12 listings
41.4% of total
Firm
3 listings
10.3% of total
Strict
4 listings
13.8% of total
Cancellation Policy Insights for La Riche
- The prevailing Airbnb cancellation policy trend in La Riche is Moderate, used by 41.4% of listings.
- The market strongly favors guest-friendly terms, with 75.9% of listings offering Flexible or Moderate policies. This suggests guests in La Riche may expect booking flexibility.
Recommendations for Hosts
- Consider adopting a Moderate policy to align with the 41.4% market standard in La Riche.
- Using a Strict policy might deter some guests, as only 13.8% of listings use it. Evaluate if potential revenue protection outweighs possible lower booking rates.
- Regularly review your cancellation policy against competitors and market demand shifts in La Riche.
La Riche STR Booking Lead Time Analysis (2025)
Average Booking Lead Time by Month
Booking Lead Time Insights for La Riche
- The overall average booking lead time for vacation rentals in La Riche is 49 days.
- Guests book furthest in advance for stays during April (average 82 days), likely coinciding with peak travel demand or local events.
- The shortest booking windows occur for stays in January (average 38 days), indicating more last-minute travel plans during this time.
- Seasonally, Fall (72 days avg.) sees the longest lead times, while Winter (42 days avg.) has the shortest, reflecting typical travel planning cycles.
Recommendations for Hosts
- Use the overall average lead time (49 days) as a baseline for your pricing and availability strategy in La Riche.
- For April stays, consider implementing length-of-stay discounts or slightly higher rates for bookings made less than 82 days out to capitalize on advance planning.
- Target marketing efforts for the Fall season well in advance (at least 72 days) to capture early planners.
- Monitor your own booking lead times against these La Riche averages to identify opportunities for dynamic pricing adjustments.
Popular & Essential Airbnb Amenities in La Riche (2025)
Amenity Prevalence
Amenity Insights for La Riche
- Essential amenities in La Riche that guests expect include: Wifi. Lacking these (this) could significantly impact bookings.
- Popular amenities like Heating, Bed linens, Refrigerator are common but not universal. Offering these can provide a competitive edge.
Recommendations for Hosts
- Ensure your listing includes all essential amenities for La Riche: Wifi.
- Consider adding popular differentiators like Heating or Bed linens to increase appeal.
- Highlight unique or less common amenities you offer (e.g., hot tub, dedicated workspace, EV charger) in your listing description and photos.
- Regularly check competitor amenities in La Riche to stay competitive.
La Riche Airbnb Guest Demographics & Profile Analysis (2025)
Guest Profile Summary for La Riche
- The typical guest profile for Airbnb in La Riche consists of primarily domestic travelers (89%), often arriving from nearby Paris, typically belonging to the Post-2000s (Gen Z/Alpha) group (50%), primarily speaking French or English.
- Domestic travelers account for 89.4% of guests.
- Key international markets include France (89.4%) and United Kingdom (1.5%).
- Top languages spoken are French (47.1%) followed by English (30.4%).
- A significant demographic segment is the Post-2000s (Gen Z/Alpha) group, representing 50% of guests.
Recommendations for Hosts
- Target domestic marketing efforts towards travelers from Paris and Tours.
- Tailor amenities and listing descriptions to appeal to the dominant Post-2000s (Gen Z/Alpha) demographic (e.g., highlight fast WiFi, smart home features, local guides).
- Highlight unique local experiences or amenities relevant to the primary guest profile.
- Consider seasonal promotions aligned with peak travel times for key origin markets.
Nearby Short-Term Rental Market Comparison
How does the La Riche Airbnb market stack up against its neighbors? Compare key performance metrics like average monthly revenue, ADR, and occupancy rates in surrounding areas to understand the broader regional STR landscape.
| Market | Active Properties | Monthly Revenue | Daily Rate | Avg. Occupancy |
|---|---|---|---|---|
| La Couture-Boussey | 12 | $3,620 | $378.08 | 28% |
| Millançay | 11 | $3,476 | $370.42 | 39% |
| Coteaux-sur-Loire | 19 | $3,328 | $270.00 | 41% |
| Moulins-le-Carbonnel | 11 | $3,213 | $320.85 | 35% |
| Langon-sur-Cher | 12 | $3,127 | $400.27 | 35% |
| Mesnils-sur-Iton | 22 | $3,028 | $309.05 | 40% |
| Villiers-sur-Loir | 10 | $2,967 | $216.51 | 41% |
| Artannes-sur-Indre | 21 | $2,949 | $275.91 | 41% |
| Vallon-sur-Gée | 11 | $2,913 | $379.01 | 30% |
| La Ferté-en-Ouche | 19 | $2,854 | $258.24 | 39% |