Huismes Airbnb Market Analysis 2025: Short Term Rental Data & Vacation Rental Statistics in Centre-Val de Loire, France
Is Airbnb profitable in Huismes in 2025? Explore comprehensive Airbnb analytics for Huismes, Centre-Val de Loire, France to uncover income potential. This 2025 STR market report for Huismes, based on AirROI data from April 2024 to March 2025, reveals key trends in the niche market of 24 active listings.
Whether you're considering an Airbnb investment in Huismes, optimizing your existing vacation rental, or exploring rental arbitrage opportunities, understanding the Huismes Airbnb data is crucial. Leveraging the low regulation environment is key to maximizing your short term rental income potential. Let's dive into the specifics.
Key Huismes Airbnb Performance Metrics Overview
Monthly Airbnb Revenue Variations & Income Potential in Huismes (2025)
Understanding the monthly revenue variations for Airbnb listings in Huismes is key to maximizing your short term rental income potential. Seasonality significantly impacts earnings. Our analysis, based on data from the past 12 months, shows that the peak revenue month for STRs in Huismes is typically August, while January often presents the lowest earnings, highlighting opportunities for strategic pricing adjustments during shoulder and low seasons. Explore the typical Airbnb income in Huismes across different performance tiers:
- Best-in-class properties (Top 10%) achieve $1,757+ monthly, often utilizing dynamic pricing and superior guest experiences.
- Strong performing properties (Top 25%) earn $1,278 or more, indicating effective management and desirable locations/amenities.
- Typical properties (Median) generate around $831 per month, representing the average market performance.
- Entry-level properties (Bottom 25%) see earnings around $482, often with potential for optimization.
Average Monthly Airbnb Earnings Trend in Huismes
Huismes Airbnb Occupancy Rate Trends (2025)
Maximize your bookings by understanding the Huismes STR occupancy trends. Seasonal demand shifts significantly influence how often properties are booked. Typically, Augustsees the highest demand (peak season occupancy), while January experiences the lowest (low season). Effective strategies, like adjusting minimum stays or offering promotions, can boost occupancy during slower periods. Here's how different property tiers perform in Huismes:
- Best-in-class properties (Top 10%) achieve 74%+ occupancy, indicating high desirability and potentially optimized availability.
- Strong performing properties (Top 25%) maintain 58% or higher occupancy, suggesting good market fit and guest satisfaction.
- Typical properties (Median) have an occupancy rate around 35%.
- Entry-level properties (Bottom 25%) average 20% occupancy, potentially facing higher vacancy.
Average Monthly Occupancy Rate Trend in Huismes
Average Daily Rate (ADR) Airbnb Trends in Huismes (2025)
Effective short term rental pricing strategy in Huismes involves understanding monthly ADR fluctuations. The Average Daily Rate (ADR) for Airbnb in Huismes typically peaks in March and dips lowest during October. Leveraging Airbnb dynamic pricing tools or strategies based on this seasonality can significantly boost revenue. Here's a look at the typical nightly rates achieved:
- Best-in-class properties (Top 10%) command rates of $256+ per night, often due to premium features or locations.
- Strong performing properties (Top 25%) achieve nightly rates of $175 or more.
- Typical properties (Median) charge around $66 per night.
- Entry-level properties (Bottom 25%) earn around $51 per night.
Average Daily Rate (ADR) Trend by Month in Huismes
Get Live Huismes Market Intelligence 👇

Explore Real-time Analytics
Airbnb Seasonality Analysis & Trends in Huismes (2025)
Peak Season (August, July, May)
- Revenue averages $1,728 per month
- Occupancy rates average 50.4%
- Daily rates average $114
Shoulder Season
- Revenue averages $904 per month
- Occupancy maintains around 37.9%
- Daily rates hold near $115
Low Season (January, February, March)
- Revenue drops to average $619 per month
- Occupancy decreases to average 36.2%
- Daily rates adjust to average $131
Seasonality Insights for Huismes
- The Airbnb seasonality in Huismes shows highly seasonal trends requiring careful strategy. While the sections above show seasonal averages, it's also insightful to look at the extremes:
- During the high season, the absolute peak month showcases Huismes's highest earning potential, with monthly revenues capable of climbing to $2,326, occupancy reaching a high of 58.7%, and ADRs peaking at $134.
- Conversely, the slowest single month of the year, typically falling within the low season, marks the market's lowest point. In this month, revenue might dip to $526, occupancy could drop to 30.2%, and ADRs may adjust down to $110.
- Understanding both the seasonal averages and these monthly peaks and troughs in revenue, occupancy, and ADR is crucial for maximizing your Airbnb profit potential in Huismes.
Seasonal Strategies for Maximizing Profit
- Peak Season: Maximize revenue through premium pricing and potentially longer minimum stays. Ensure high availability.
- Low Season: Offer competitive pricing, special promotions (e.g., extended stay discounts), and flexible cancellation policies. Target off-season travelers like remote workers or budget-conscious guests.
- Shoulder Seasons: Implement dynamic pricing that balances peak and low rates. Target weekend travelers or specific events. Offer slightly more flexible terms than peak season.
- Regularly analyze your own performance against these Huismes seasonality benchmarks and adjust your pricing and availability strategy accordingly.
Best Areas for Airbnb Investment in Huismes (2025)
Exploring the top neighborhoods for short-term rentals in Huismes? This section highlights key areas, outlining why they are attractive for hosts and guests, along with notable local attractions. Consider these locations based on your target guest profile and investment strategy.
| Neighborhood / Area | Why Host Here? (Target Guests & Appeal) | Key Attractions & Landmarks |
|---|---|---|
| Huismes Village | A charming French village known for its rich history and scenery. It offers a peaceful retreat for tourists who want to experience authentic French culture, with beautiful countryside views and proximity to vineyards. | Château de Rigny-Ussé, Vineyards of the Loire Valley, La Loire à Vélo cycling route, Église Saint-Denis, Local markets and cafes |
| Chinon | A picturesque town famous for its historic château and beautiful countryside. Popular with tourists seeking history, wine tours, and cultural experiences. | Château de Chinon, Vineyards of Chinon, Historical walking tours, Local wine cellars, The Loire River |
| Azay-le-Rideau | Known for its stunning château and beautiful gardens. A fantastic location for tourists interested in French Renaissance architecture and tranquil surroundings. | Château d'Azay-le-Rideau, Île de l'Île, Botanical Gardens, Local art galleries, Historical sites |
| Saumur | Famous for its château and equestrian events, Saumur attracts many visitors for its rich history and beautiful landscapes along the Loire River. | Château de Saumur, Caves and wine tasting, Saumur Horse Riding School, The Loire River, Local festivals |
| Montsoreau | This village is nestled on the banks of the Loire River and features stunning views and the impressive Château de Montsoreau, making it a perfect destination for cultural tourism. | Château de Montsoreau, Loire River Boat Tours, Local art galleries, Hiking trails, Picturesque streets |
| Langeais | Renowned for its medieval château, Langeais is a delightful town that offers visitors an insight into France's rich history and beautiful architecture. | Château de Langeais, Local festivals and markets, Historical architecture, Cycling routes, The Loire River |
| Candes-Saint-Martin | This small village is known for its beautiful views and is located at the confluence of the Loire and Vienne rivers, attracting those interested in nature and history. | Eglise de Saint-Martin, Riverside walks, Local cafes, Historical monuments, Cultural festivals |
| Villandry | Famous for its splendid gardens and château, Villandry attracts visitors with its beautiful landscape and rich agricultural heritage, perfect for nature lovers. | Château de Villandry, Gardens of Villandry, Local produce markets, Cycling paths, Wine tasting experiences |
Understanding Airbnb License Requirements & STR Laws in Huismes (2025)
While Huismes, Centre-Val de Loire, France currently shows low STR regulations, specific Airbnb license requirements might still exist or change. Always verify the latest short term rental regulations and Airbnb license requirements directly with local government authorities for Huismes to ensure full compliance before hosting.
(Source: AirROI data, 2025, based on 4% licensed listings)
Top Performing Airbnb Properties in Huismes (2025)
Benchmark your potential! Explore examples of top-performing Airbnb properties in Huismesbased on Trailing Twelve Month (TTM) revenue. Analyze their characteristics, revenue, occupancy rate, and ADR to understand what drives success in this market.
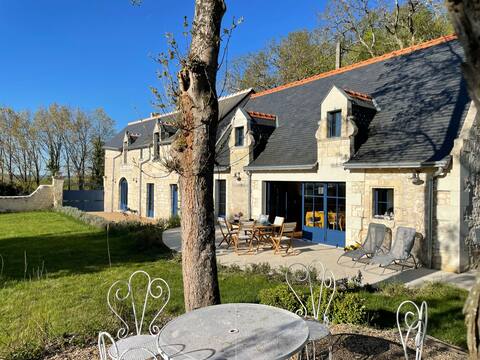
Beautiful renovated old house - stunning views
Entire Place • 5 bedrooms
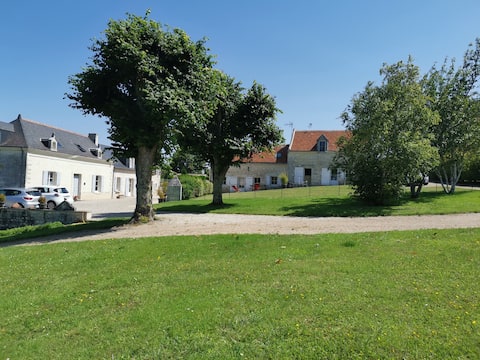
Gîte des Basses Rivières -Thalie 3*
Entire Place • 2 bedrooms

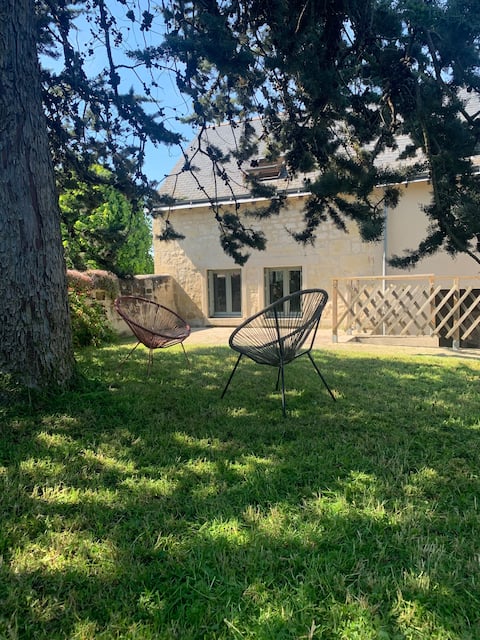
Quiet cozy cottage near the forest at 13 min C.N.P.E.
Entire Place • 2 bedrooms

Gîte de l 'Erault
Entire Place • 2 bedrooms
Gîte "la Fontaine"In the heart of the Loire Castles
Entire Place • 2 bedrooms
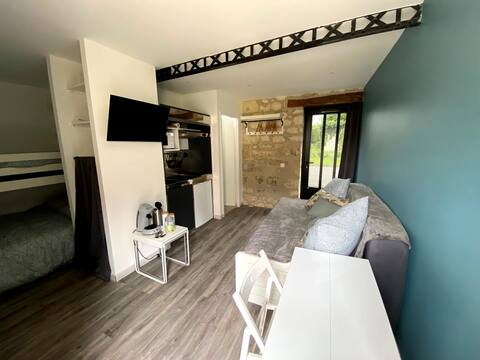
Studio Indre,la Halte de cuze,sur la Loire by bike
Entire Place • N/A
Note: Performance varies based on location, size, amenities, seasonality, and management quality. Data reflects the past 12 months.
Top Performing Airbnb Hosts in Huismes (2025)
Learn from the best! This table showcases top-performing Airbnb hosts in Huismes based on the number of properties managed and estimated total revenue over the past year. Analyze their scale and performance metrics.
| Host Name | Properties | Grossing Revenue | Stay Reviews | Avg Rating |
|---|---|---|---|---|
| Guillaume | 1 | $41,193 | 9 | 4.89/5.0 |
| Host #25354302 | 6 | $27,656 | 1 | 0.00/5.0 |
| Franck | 3 | $23,311 | 550 | 4.87/5.0 |
| Agnes | 2 | $19,936 | 215 | 4.88/5.0 |
| Frédéric | 1 | $18,451 | 68 | 4.96/5.0 |
| Michel | 1 | $12,965 | 94 | 4.97/5.0 |
| Sophie | 1 | $12,088 | 30 | 4.97/5.0 |
| Thomas | 1 | $10,341 | 9 | 4.67/5.0 |
| David | 1 | $9,920 | 36 | 4.89/5.0 |
| Marie Claire | 1 | $9,302 | 42 | 4.95/5.0 |
Analyzing the strategies of top hosts, such as their property selection, pricing, and guest communication, can offer valuable lessons for optimizing your own Airbnb operations in Huismes.
Dive Deeper: Advanced Huismes STR Market Data (2025)
Ready to unlock more insights? AirROI provides access to advanced metrics and comprehensive Airbnb data for Huismes. Explore detailed analytics beyond this report to refine your investment strategy, optimize pricing, and maximize your vacation rental profits.
Explore Advanced MetricsHuismes Short-Term Rental Market Composition (2025): Property & Room Types
Room Type Distribution
Property Type Distribution
Market Composition Insights for Huismes
- The Huismes Airbnb market composition is heavily skewed towards Entire Home/Apt listings, which make up 54.2% of the 24 active rentals. This indicates strong guest preference for privacy and space.
- However, a notable 45.8% share for Private Rooms suggests opportunities for budget-conscious travelers or hosts renting out spare rooms.
- Looking at the property type distribution in Huismes, Hotel/Boutique properties are the most common (54.2%), reflecting the local real estate landscape.
- Houses represent a significant 37.5% portion, catering likely to families or larger groups.
- The presence of 54.2% Hotel/Boutique listings indicates integration with traditional hospitality.
Huismes Airbnb Room Capacity Analysis (2025): Bedroom Distribution
Distribution of Listings by Number of Bedrooms
Room Capacity Insights for Huismes
- The dominant room capacity in Huismes is 1 bedroom listings, making up 54.2% of the market. This suggests a strong demand for properties suitable for couples or solo travelers.
- Together, 1 bedroom and 2 bedrooms properties represent 79.2% of the active Airbnb listings in Huismes, indicating a high concentration in these sizes.
- With over half the market (54.2%) consisting of studios or 1-bedroom units, Huismes is particularly well-suited for individuals or couples.
Huismes Vacation Rental Guest Capacity Trends (2025)
Distribution of Listings by Guest Capacity
Guest Capacity Insights for Huismes
- The most common guest capacity trend in Huismes vacation rentals is listings accommodating 2 guests (45.8%). This suggests the primary traveler segment is likely couples or solo travelers.
- Properties designed for 2 guests and 4 guests dominate the Huismes STR market, accounting for 62.5% of listings.
- A significant 50.0% of listings cater specifically to 1-2 guests, highlighting strong demand from couples and solo travelers in Huismes.
- 16.6% of properties accommodate 6+ guests, serving the market segment for larger families or group travel in Huismes.
- On average, properties in Huismes are equipped to host 3.3 guests.
Huismes Airbnb Booking Patterns (2025): Available vs. Booked Days
Available Days Distribution
Booked Days Distribution
Booking Pattern Insights for Huismes
- The most common availability pattern in Huismes falls within the 271-366 days range, representing 50% of listings. This suggests many properties have significant open periods on their calendars.
- Approximately 83.3% of listings show high availability (181+ days open annually), indicating potential for increased bookings or specific owner usage patterns.
- For booked days, the 91-180 days range is most frequent in Huismes (29.2%), reflecting common guest stay durations or potential owner blocking patterns.
- A notable 20.9% of properties secure long booking periods (181+ days booked per year), highlighting successful long-term rental strategies or significant owner usage.
Huismes Airbnb Minimum Stay Requirements Analysis
Distribution of Listings by Minimum Night Requirement
1 Night
13 listings
59.1% of total
2 Nights
3 listings
13.6% of total
3 Nights
5 listings
22.7% of total
4-6 Nights
1 listings
4.5% of total
Key Insights
- The most prevalent minimum stay requirement in Huismes is 1 Night, adopted by 59.1% of listings. This highlights the market's preference for shorter, flexible bookings.
- A strong majority (72.7%) of the Huismes Airbnb data shows acceptance of very short stays (1-2 nights), indicating a dynamic, high-turnover market.
Recommendations
- Align with the market by considering a 1 Night minimum stay, as 59.1% of Huismes hosts use this setting.
- Adjust minimum nights based on seasonality – potentially shorter during low season and longer during peak demand periods in Huismes.
Huismes Airbnb Cancellation Policy Trends Analysis (2025)
Flexible
7 listings
46.7% of total
Moderate
5 listings
33.3% of total
Strict
3 listings
20% of total
Cancellation Policy Insights for Huismes
- The prevailing Airbnb cancellation policy trend in Huismes is Flexible, used by 46.7% of listings.
- The market strongly favors guest-friendly terms, with 80.0% of listings offering Flexible or Moderate policies. This suggests guests in Huismes may expect booking flexibility.
Recommendations for Hosts
- Consider adopting a Flexible policy to align with the 46.7% market standard in Huismes.
- Regularly review your cancellation policy against competitors and market demand shifts in Huismes.
Huismes STR Booking Lead Time Analysis (2025)
Average Booking Lead Time by Month
Booking Lead Time Insights for Huismes
- The overall average booking lead time for vacation rentals in Huismes is 47 days.
- Guests book furthest in advance for stays during July (average 94 days), likely coinciding with peak travel demand or local events.
- The shortest booking windows occur for stays in March (average 31 days), indicating more last-minute travel plans during this time.
- Seasonally, Summer (75 days avg.) sees the longest lead times, while Spring (39 days avg.) has the shortest, reflecting typical travel planning cycles.
Recommendations for Hosts
- Use the overall average lead time (47 days) as a baseline for your pricing and availability strategy in Huismes.
- For July stays, consider implementing length-of-stay discounts or slightly higher rates for bookings made less than 94 days out to capitalize on advance planning.
- Target marketing efforts for the Summer season well in advance (at least 75 days) to capture early planners.
- Monitor your own booking lead times against these Huismes averages to identify opportunities for dynamic pricing adjustments.
Popular & Essential Airbnb Amenities in Huismes (2025)
Amenity Prevalence
Amenity Insights for Huismes
- Essential amenities in Huismes that guests expect include: Heating, Wifi, Smoke alarm, Hot water. Lacking these (any) could significantly impact bookings.
- Popular amenities like Kitchen, Hair dryer, Free parking on premises are common but not universal. Offering these can provide a competitive edge.
Recommendations for Hosts
- Ensure your listing includes all essential amenities for Huismes: Heating, Wifi, Smoke alarm, Hot water.
- Prioritize adding missing essentials: Wifi, Smoke alarm, Hot water.
- Consider adding popular differentiators like Kitchen or Hair dryer to increase appeal.
- Highlight unique or less common amenities you offer (e.g., hot tub, dedicated workspace, EV charger) in your listing description and photos.
- Regularly check competitor amenities in Huismes to stay competitive.
Huismes Airbnb Guest Demographics & Profile Analysis (2025)
Guest Profile Summary for Huismes
- The typical guest profile for Airbnb in Huismes consists of primarily domestic travelers (85%), often arriving from nearby Paris, typically belonging to the Post-2000s (Gen Z/Alpha) group (50%), primarily speaking French or English.
- Domestic travelers account for 85.2% of guests.
- Key international markets include France (85.2%) and United Kingdom (2.8%).
- Top languages spoken are French (40.8%) followed by English (34.6%).
- A significant demographic segment is the Post-2000s (Gen Z/Alpha) group, representing 50% of guests.
Recommendations for Hosts
- Target domestic marketing efforts towards travelers from Paris and Nantes.
- Tailor amenities and listing descriptions to appeal to the dominant Post-2000s (Gen Z/Alpha) demographic (e.g., highlight fast WiFi, smart home features, local guides).
- Highlight unique local experiences or amenities relevant to the primary guest profile.
- Consider seasonal promotions aligned with peak travel times for key origin markets.
Nearby Short-Term Rental Market Comparison
How does the Huismes Airbnb market stack up against its neighbors? Compare key performance metrics like average monthly revenue, ADR, and occupancy rates in surrounding areas to understand the broader regional STR landscape.
| Market | Active Properties | Monthly Revenue | Daily Rate | Avg. Occupancy |
|---|---|---|---|---|
| La Couture-Boussey | 12 | $3,620 | $378.08 | 28% |
| Millançay | 11 | $3,476 | $370.42 | 39% |
| Coteaux-sur-Loire | 19 | $3,328 | $270.00 | 41% |
| Moulins-le-Carbonnel | 11 | $3,213 | $320.85 | 35% |
| Langon-sur-Cher | 12 | $3,127 | $400.27 | 35% |
| Mesnils-sur-Iton | 22 | $3,028 | $309.05 | 40% |
| Villiers-sur-Loir | 10 | $2,967 | $216.51 | 41% |
| Artannes-sur-Indre | 21 | $2,949 | $275.91 | 41% |
| Vallon-sur-Gée | 11 | $2,913 | $379.01 | 30% |
| La Ferté-en-Ouche | 19 | $2,854 | $258.24 | 39% |