Cour-Cheverny Airbnb Market Analysis 2025: Short Term Rental Data & Vacation Rental Statistics in Centre-Val de Loire, France
Is Airbnb profitable in Cour-Cheverny in 2025? Explore comprehensive Airbnb analytics for Cour-Cheverny, Centre-Val de Loire, France to uncover income potential. This 2025 STR market report for Cour-Cheverny, based on AirROI data from April 2024 to March 2025, reveals key trends in the niche market of 69 active listings.
Whether you're considering an Airbnb investment in Cour-Cheverny, optimizing your existing vacation rental, or exploring rental arbitrage opportunities, understanding the Cour-Cheverny Airbnb data is crucial. Understanding the local regulations is key to maximizing your short term rental income potential. Let's dive into the specifics.
Key Cour-Cheverny Airbnb Performance Metrics Overview
Monthly Airbnb Revenue Variations & Income Potential in Cour-Cheverny (2025)
Understanding the monthly revenue variations for Airbnb listings in Cour-Cheverny is key to maximizing your short term rental income potential. Seasonality significantly impacts earnings. Our analysis, based on data from the past 12 months, shows that the peak revenue month for STRs in Cour-Cheverny is typically July, while March often presents the lowest earnings, highlighting opportunities for strategic pricing adjustments during shoulder and low seasons. Explore the typical Airbnb income in Cour-Cheverny across different performance tiers:
- Best-in-class properties (Top 10%) achieve $3,922+ monthly, often utilizing dynamic pricing and superior guest experiences.
- Strong performing properties (Top 25%) earn $2,237 or more, indicating effective management and desirable locations/amenities.
- Typical properties (Median) generate around $1,294 per month, representing the average market performance.
- Entry-level properties (Bottom 25%) see earnings around $695, often with potential for optimization.
Average Monthly Airbnb Earnings Trend in Cour-Cheverny
Cour-Cheverny Airbnb Occupancy Rate Trends (2025)
Maximize your bookings by understanding the Cour-Cheverny STR occupancy trends. Seasonal demand shifts significantly influence how often properties are booked. Typically, Augustsees the highest demand (peak season occupancy), while January experiences the lowest (low season). Effective strategies, like adjusting minimum stays or offering promotions, can boost occupancy during slower periods. Here's how different property tiers perform in Cour-Cheverny:
- Best-in-class properties (Top 10%) achieve 75%+ occupancy, indicating high desirability and potentially optimized availability.
- Strong performing properties (Top 25%) maintain 57% or higher occupancy, suggesting good market fit and guest satisfaction.
- Typical properties (Median) have an occupancy rate around 36%.
- Entry-level properties (Bottom 25%) average 19% occupancy, potentially facing higher vacancy.
Average Monthly Occupancy Rate Trend in Cour-Cheverny
Average Daily Rate (ADR) Airbnb Trends in Cour-Cheverny (2025)
Effective short term rental pricing strategy in Cour-Cheverny involves understanding monthly ADR fluctuations. The Average Daily Rate (ADR) for Airbnb in Cour-Cheverny typically peaks in November and dips lowest during March. Leveraging Airbnb dynamic pricing tools or strategies based on this seasonality can significantly boost revenue. Here's a look at the typical nightly rates achieved:
- Best-in-class properties (Top 10%) command rates of $329+ per night, often due to premium features or locations.
- Strong performing properties (Top 25%) achieve nightly rates of $176 or more.
- Typical properties (Median) charge around $103 per night.
- Entry-level properties (Bottom 25%) earn around $77 per night.
Average Daily Rate (ADR) Trend by Month in Cour-Cheverny
Get Live Cour-Cheverny Market Intelligence 👇

Explore Real-time Analytics
Airbnb Seasonality Analysis & Trends in Cour-Cheverny (2025)
Peak Season (July, August, May)
- Revenue averages $2,837 per month
- Occupancy rates average 56.4%
- Daily rates average $199
Shoulder Season
- Revenue averages $1,964 per month
- Occupancy maintains around 37.8%
- Daily rates hold near $198
Low Season (February, March, November)
- Revenue drops to average $1,021 per month
- Occupancy decreases to average 27.7%
- Daily rates adjust to average $194
Seasonality Insights for Cour-Cheverny
- The Airbnb seasonality in Cour-Cheverny shows highly seasonal trends requiring careful strategy. While the sections above show seasonal averages, it's also insightful to look at the extremes:
- During the high season, the absolute peak month showcases Cour-Cheverny's highest earning potential, with monthly revenues capable of climbing to $3,063, occupancy reaching a high of 63.6%, and ADRs peaking at $201.
- Conversely, the slowest single month of the year, typically falling within the low season, marks the market's lowest point. In this month, revenue might dip to $859, occupancy could drop to 26.6%, and ADRs may adjust down to $188.
- Understanding both the seasonal averages and these monthly peaks and troughs in revenue, occupancy, and ADR is crucial for maximizing your Airbnb profit potential in Cour-Cheverny.
Seasonal Strategies for Maximizing Profit
- Peak Season: Maximize revenue through premium pricing and potentially longer minimum stays. Ensure high availability.
- Low Season: Offer competitive pricing, special promotions (e.g., extended stay discounts), and flexible cancellation policies. Target off-season travelers like remote workers or budget-conscious guests.
- Shoulder Seasons: Implement dynamic pricing that balances peak and low rates. Target weekend travelers or specific events. Offer slightly more flexible terms than peak season.
- Regularly analyze your own performance against these Cour-Cheverny seasonality benchmarks and adjust your pricing and availability strategy accordingly.
Best Areas for Airbnb Investment in Cour-Cheverny (2025)
Exploring the top neighborhoods for short-term rentals in Cour-Cheverny? This section highlights key areas, outlining why they are attractive for hosts and guests, along with notable local attractions. Consider these locations based on your target guest profile and investment strategy.
| Neighborhood / Area | Why Host Here? (Target Guests & Appeal) | Key Attractions & Landmarks |
|---|---|---|
| Château de Cheverny | Famous for its stunning architecture and beautiful gardens, Cheverny attracts tourists interested in history and culture. It is perfect for guests looking for a luxurious countryside experience with historical significance. | Château de Cheverny, Gardens of Cheverny, Cheverny Wine Cellars, Hunting Museum, Nature Park of the Loire |
| Beauval Zoo | One of the most renowned zoos in Europe, it is a major attraction for families and nature lovers. Being close to the zoo often draws visitors looking for unique experiences with wildlife. | ZooParc de Beauval, Grande Volière, Aquarium, Animal exhibits, Interactive animal shows |
| Blois | A charming town with a rich history and stunning architecture, it serves as an excellent base for exploring the Loire Valley. Tourists often seek out Blois for its cultural offerings and proximity to various chateaux. | Château de Blois, Maison de la Magie, Blois Cathedral, Loire River Banks, Historic city center |
| Chaumont-sur-Loire | Home to the internationally renowned Chaumont International Garden Festival, it's a must-visit for gardening enthusiasts and those looking for natural beauty. | Château de Chaumont, International Garden Festival, Loire Valley Cycling paths, Chaumont Park |
| Contres | A small town that offers a true French countryside experience, popular for its vineyards and local cuisine. Guests looking for authenticity and tranquility will enjoy this area. | Local vineyards, Gastronomic experiences, Countryside walks, Château de Villesavin |
| Romorantin-Lanthenay | Known as the 'gateway to the Sologne region', this town is appreciated for its natural surroundings and nature-related activities. It's ideal for visitors interested in outdoor experiences. | Sologne Region, Local markets, Nature reserves, Museum of Sologne |
| Saint-Aignan | Home to several attractions, including the famous Beauval Zoo, this area offers fantastic views of the Loire River and beautiful landscapes, making it popular with families. | Historic town center, River Loire views, Local cuisine, Château de Saint-Aignan |
| Souvigny-en-Sologne | A quiet rural area perfect for those looking to escape the hustle and bustle. This area is great for relaxation, walking, and enjoying nature. | Sologne nature trails, Quiet countryside, Local farms, Bird watching spots |
Understanding Airbnb License Requirements & STR Laws in Cour-Cheverny (2025)
With 10% of listings showing registration in 2025, understanding potential Airbnb license requirements is crucial in Cour-Cheverny. Always verify the latest short term rental regulations and Airbnb license requirements directly with local government authorities for Cour-Cheverny to ensure full compliance before hosting.
(Source: AirROI data, 2025, based on 10% licensed listings)
Top Performing Airbnb Properties in Cour-Cheverny (2025)
Benchmark your potential! Explore examples of top-performing Airbnb properties in Cour-Chevernybased on Trailing Twelve Month (TTM) revenue. Analyze their characteristics, revenue, occupancy rate, and ADR to understand what drives success in this market.
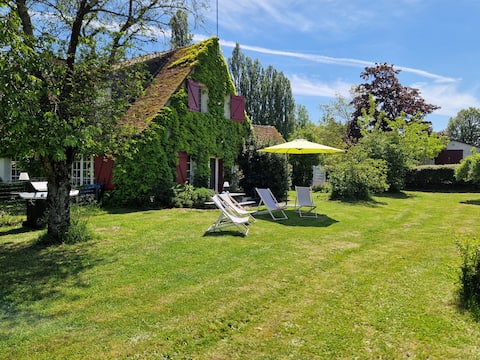
Lovely Family cottage in the middle of vineyards*
Entire Place • 7 bedrooms
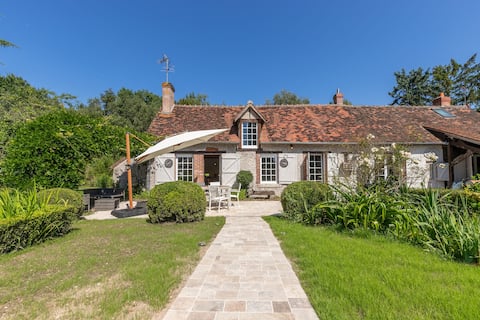
Cottage near Cheverny- tennis
Entire Place • 5 bedrooms
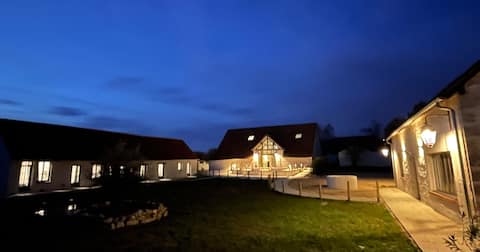
Vacances Mariage Réception Séminaire Anniversaire
Entire Place • 15 bedrooms
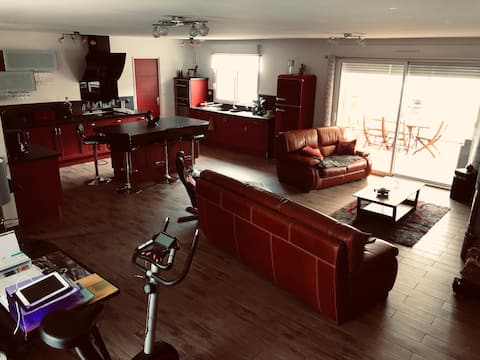
Property in Sologne beauval Cheverny Chambord
Entire Place • 4 bedrooms

4 bedroom family house in the Loire Valley
Entire Place • 4 bedrooms

Gite on one level, "La Maison d 'Alice" 6 people.
Entire Place • 3 bedrooms
Note: Performance varies based on location, size, amenities, seasonality, and management quality. Data reflects the past 12 months.
Top Performing Airbnb Hosts in Cour-Cheverny (2025)
Learn from the best! This table showcases top-performing Airbnb hosts in Cour-Cheverny based on the number of properties managed and estimated total revenue over the past year. Analyze their scale and performance metrics.
| Host Name | Properties | Grossing Revenue | Stay Reviews | Avg Rating |
|---|---|---|---|---|
| Maxime | 4 | $108,276 | 58 | 4.75/5.0 |
| Savina | 2 | $82,453 | 60 | 4.80/5.0 |
| Arlene | 3 | $77,554 | 487 | 4.89/5.0 |
| Host #67933834 | 1 | $69,624 | 0 | 0.00/5.0 |
| Carole | 3 | $54,219 | 248 | 3.15/5.0 |
| Laurent | 2 | $47,085 | 197 | 4.95/5.0 |
| Marion | 6 | $46,090 | 27 | 3.32/5.0 |
| Franck | 1 | $36,497 | 28 | 4.79/5.0 |
| Chantal | 1 | $35,733 | 74 | 5.00/5.0 |
| Amaury Et Constance | 2 | $31,784 | 62 | 4.86/5.0 |
Analyzing the strategies of top hosts, such as their property selection, pricing, and guest communication, can offer valuable lessons for optimizing your own Airbnb operations in Cour-Cheverny.
Dive Deeper: Advanced Cour-Cheverny STR Market Data (2025)
Ready to unlock more insights? AirROI provides access to advanced metrics and comprehensive Airbnb data for Cour-Cheverny. Explore detailed analytics beyond this report to refine your investment strategy, optimize pricing, and maximize your vacation rental profits.
Explore Advanced MetricsCour-Cheverny Short-Term Rental Market Composition (2025): Property & Room Types
Room Type Distribution
Property Type Distribution
Market Composition Insights for Cour-Cheverny
- The Cour-Cheverny Airbnb market composition is heavily skewed towards Entire Home/Apt listings, which make up 88.4% of the 69 active rentals. This indicates strong guest preference for privacy and space.
- Looking at the property type distribution in Cour-Cheverny, House properties are the most common (66.7%), reflecting the local real estate landscape.
- Houses represent a significant 66.7% portion, catering likely to families or larger groups.
- Smaller segments like hotel/boutique (combined 2.9%) offer potential for unique stay experiences.
Cour-Cheverny Airbnb Room Capacity Analysis (2025): Bedroom Distribution
Distribution of Listings by Number of Bedrooms
Room Capacity Insights for Cour-Cheverny
- The dominant room capacity in Cour-Cheverny is 1 bedroom listings, making up 36.2% of the market. This suggests a strong demand for properties suitable for couples or solo travelers.
- Together, 1 bedroom and 2 bedrooms properties represent 68.1% of the active Airbnb listings in Cour-Cheverny, indicating a high concentration in these sizes.
- A significant 24.5% of listings offer 3+ bedrooms, catering to larger groups and families seeking more space in Cour-Cheverny.
Cour-Cheverny Vacation Rental Guest Capacity Trends (2025)
Distribution of Listings by Guest Capacity
Guest Capacity Insights for Cour-Cheverny
- The most common guest capacity trend in Cour-Cheverny vacation rentals is listings accommodating 4 guests (37.7%). This suggests the primary traveler segment is likely small families or groups.
- Properties designed for 4 guests and 8+ guests dominate the Cour-Cheverny STR market, accounting for 58.0% of listings.
- 29.0% of properties accommodate 6+ guests, serving the market segment for larger families or group travel in Cour-Cheverny.
- On average, properties in Cour-Cheverny are equipped to host 4.4 guests.
Cour-Cheverny Airbnb Booking Patterns (2025): Available vs. Booked Days
Available Days Distribution
Booked Days Distribution
Booking Pattern Insights for Cour-Cheverny
- The most common availability pattern in Cour-Cheverny falls within the 271-366 days range, representing 44.9% of listings. This suggests many properties have significant open periods on their calendars.
- Approximately 84.0% of listings show high availability (181+ days open annually), indicating potential for increased bookings or specific owner usage patterns.
- For booked days, the 91-180 days range is most frequent in Cour-Cheverny (39.1%), reflecting common guest stay durations or potential owner blocking patterns.
- A notable 17.4% of properties secure long booking periods (181+ days booked per year), highlighting successful long-term rental strategies or significant owner usage.
Cour-Cheverny Airbnb Minimum Stay Requirements Analysis
Distribution of Listings by Minimum Night Requirement
1 Night
17 listings
25.8% of total
2 Nights
27 listings
40.9% of total
3 Nights
4 listings
6.1% of total
4-6 Nights
3 listings
4.5% of total
7-29 Nights
4 listings
6.1% of total
30+ Nights
11 listings
16.7% of total
Key Insights
- The most prevalent minimum stay requirement in Cour-Cheverny is 2 Nights, adopted by 40.9% of listings. This highlights the market's preference for shorter, flexible bookings.
- A strong majority (66.7%) of the Cour-Cheverny Airbnb data shows acceptance of very short stays (1-2 nights), indicating a dynamic, high-turnover market.
- A significant segment (16.7%) caters to monthly stays (30+ nights) in Cour-Cheverny, pointing to opportunities in the extended-stay market.
Recommendations
- Align with the market by considering a 2 Nights minimum stay, as 40.9% of Cour-Cheverny hosts use this setting.
- If feasible, allowing 1-night stays, especially midweek or during low season, could capture last-minute bookings, as only 25.8% currently do.
- Explore offering discounts for stays of 30+ nights to attract the 16.7% of the market seeking extended stays.
- Adjust minimum nights based on seasonality – potentially shorter during low season and longer during peak demand periods in Cour-Cheverny.
Cour-Cheverny Airbnb Cancellation Policy Trends Analysis (2025)
Flexible
16 listings
26.2% of total
Moderate
18 listings
29.5% of total
Firm
15 listings
24.6% of total
Strict
12 listings
19.7% of total
Cancellation Policy Insights for Cour-Cheverny
- The prevailing Airbnb cancellation policy trend in Cour-Cheverny is Moderate, used by 29.5% of listings.
- There's a relatively balanced mix between guest-friendly (55.7%) and stricter (44.3%) policies, offering choices for different guest needs.
Recommendations for Hosts
- Consider adopting a Moderate policy to align with the 29.5% market standard in Cour-Cheverny.
- Regularly review your cancellation policy against competitors and market demand shifts in Cour-Cheverny.
Cour-Cheverny STR Booking Lead Time Analysis (2025)
Average Booking Lead Time by Month
Booking Lead Time Insights for Cour-Cheverny
- The overall average booking lead time for vacation rentals in Cour-Cheverny is 54 days.
- Guests book furthest in advance for stays during June (average 91 days), likely coinciding with peak travel demand or local events.
- The shortest booking windows occur for stays in March (average 30 days), indicating more last-minute travel plans during this time.
- Seasonally, Summer (79 days avg.) sees the longest lead times, while Fall (45 days avg.) has the shortest, reflecting typical travel planning cycles.
Recommendations for Hosts
- Use the overall average lead time (54 days) as a baseline for your pricing and availability strategy in Cour-Cheverny.
- For June stays, consider implementing length-of-stay discounts or slightly higher rates for bookings made less than 91 days out to capitalize on advance planning.
- Target marketing efforts for the Summer season well in advance (at least 79 days) to capture early planners.
- Monitor your own booking lead times against these Cour-Cheverny averages to identify opportunities for dynamic pricing adjustments.
Popular & Essential Airbnb Amenities in Cour-Cheverny (2025)
Amenity Prevalence
Amenity Insights for Cour-Cheverny
- Popular amenities like Hot water, Heating, Kitchen are common but not universal. Offering these can provide a competitive edge.
- Warning: Wifi is not universally provided but is considered essential globally. Ensure reliable Wifi is offered.
Recommendations for Hosts
- Consider adding popular differentiators like Hot water or Heating to increase appeal.
- Highlight unique or less common amenities you offer (e.g., hot tub, dedicated workspace, EV charger) in your listing description and photos.
- Regularly check competitor amenities in Cour-Cheverny to stay competitive.
Cour-Cheverny Airbnb Guest Demographics & Profile Analysis (2025)
Guest Profile Summary for Cour-Cheverny
- The typical guest profile for Airbnb in Cour-Cheverny consists of primarily domestic travelers (88%), often arriving from nearby Paris, typically belonging to the Post-2000s (Gen Z/Alpha) group (50%), primarily speaking French or English.
- Domestic travelers account for 87.9% of guests.
- Key international markets include France (87.9%) and United Kingdom (2.9%).
- Top languages spoken are French (45.4%) followed by English (32.2%).
- A significant demographic segment is the Post-2000s (Gen Z/Alpha) group, representing 50% of guests.
Recommendations for Hosts
- Target domestic marketing efforts towards travelers from Paris and Rennes.
- Tailor amenities and listing descriptions to appeal to the dominant Post-2000s (Gen Z/Alpha) demographic (e.g., highlight fast WiFi, smart home features, local guides).
- Highlight unique local experiences or amenities relevant to the primary guest profile.
- Consider seasonal promotions aligned with peak travel times for key origin markets.
Nearby Short-Term Rental Market Comparison
How does the Cour-Cheverny Airbnb market stack up against its neighbors? Compare key performance metrics like average monthly revenue, ADR, and occupancy rates in surrounding areas to understand the broader regional STR landscape.
| Market | Active Properties | Monthly Revenue | Daily Rate | Avg. Occupancy |
|---|---|---|---|---|
| La Couture-Boussey | 12 | $3,620 | $378.08 | 28% |
| Dourdan | 15 | $3,576 | $223.06 | 52% |
| Millançay | 11 | $3,476 | $370.42 | 39% |
| Coteaux-sur-Loire | 19 | $3,328 | $270.00 | 41% |
| Chaintreaux | 11 | $3,136 | $278.28 | 34% |
| Langon-sur-Cher | 12 | $3,127 | $400.27 | 35% |
| Mesnils-sur-Iton | 22 | $3,028 | $309.05 | 40% |
| Tournan-en-Brie | 16 | $3,020 | $249.98 | 47% |
| Villiers-sur-Loir | 10 | $2,967 | $216.51 | 41% |
| Artannes-sur-Indre | 21 | $2,949 | $275.91 | 41% |