Cheverny Airbnb Market Analysis 2025: Short Term Rental Data & Vacation Rental Statistics in Centre-Val de Loire, France
Is Airbnb profitable in Cheverny in 2025? Explore comprehensive Airbnb analytics for Cheverny, Centre-Val de Loire, France to uncover income potential. This 2025 STR market report for Cheverny, based on AirROI data from April 2024 to March 2025, reveals key trends in the niche market of 29 active listings.
Whether you're considering an Airbnb investment in Cheverny, optimizing your existing vacation rental, or exploring rental arbitrage opportunities, understanding the Cheverny Airbnb data is crucial. Leveraging the low regulation environment is key to maximizing your short term rental income potential. Let's dive into the specifics.
Key Cheverny Airbnb Performance Metrics Overview
Monthly Airbnb Revenue Variations & Income Potential in Cheverny (2025)
Understanding the monthly revenue variations for Airbnb listings in Cheverny is key to maximizing your short term rental income potential. Seasonality significantly impacts earnings. Our analysis, based on data from the past 12 months, shows that the peak revenue month for STRs in Cheverny is typically August, while January often presents the lowest earnings, highlighting opportunities for strategic pricing adjustments during shoulder and low seasons. Explore the typical Airbnb income in Cheverny across different performance tiers:
- Best-in-class properties (Top 10%) achieve $3,403+ monthly, often utilizing dynamic pricing and superior guest experiences.
- Strong performing properties (Top 25%) earn $2,178 or more, indicating effective management and desirable locations/amenities.
- Typical properties (Median) generate around $1,127 per month, representing the average market performance.
- Entry-level properties (Bottom 25%) see earnings around $679, often with potential for optimization.
Average Monthly Airbnb Earnings Trend in Cheverny
Cheverny Airbnb Occupancy Rate Trends (2025)
Maximize your bookings by understanding the Cheverny STR occupancy trends. Seasonal demand shifts significantly influence how often properties are booked. Typically, Augustsees the highest demand (peak season occupancy), while January experiences the lowest (low season). Effective strategies, like adjusting minimum stays or offering promotions, can boost occupancy during slower periods. Here's how different property tiers perform in Cheverny:
- Best-in-class properties (Top 10%) achieve 73%+ occupancy, indicating high desirability and potentially optimized availability.
- Strong performing properties (Top 25%) maintain 49% or higher occupancy, suggesting good market fit and guest satisfaction.
- Typical properties (Median) have an occupancy rate around 29%.
- Entry-level properties (Bottom 25%) average 16% occupancy, potentially facing higher vacancy.
Average Monthly Occupancy Rate Trend in Cheverny
Average Daily Rate (ADR) Airbnb Trends in Cheverny (2025)
Effective short term rental pricing strategy in Cheverny involves understanding monthly ADR fluctuations. The Average Daily Rate (ADR) for Airbnb in Cheverny typically peaks in May and dips lowest during January. Leveraging Airbnb dynamic pricing tools or strategies based on this seasonality can significantly boost revenue. Here's a look at the typical nightly rates achieved:
- Best-in-class properties (Top 10%) command rates of $325+ per night, often due to premium features or locations.
- Strong performing properties (Top 25%) achieve nightly rates of $208 or more.
- Typical properties (Median) charge around $128 per night.
- Entry-level properties (Bottom 25%) earn around $98 per night.
Average Daily Rate (ADR) Trend by Month in Cheverny
Get Live Cheverny Market Intelligence 👇

Explore Real-time Analytics
Airbnb Seasonality Analysis & Trends in Cheverny (2025)
Peak Season (August, May, July)
- Revenue averages $2,148 per month
- Occupancy rates average 42.2%
- Daily rates average $188
Shoulder Season
- Revenue averages $1,532 per month
- Occupancy maintains around 34.4%
- Daily rates hold near $179
Low Season (January, February, November)
- Revenue drops to average $1,073 per month
- Occupancy decreases to average 30.4%
- Daily rates adjust to average $166
Seasonality Insights for Cheverny
- The Airbnb seasonality in Cheverny shows highly seasonal trends requiring careful strategy. While the sections above show seasonal averages, it's also insightful to look at the extremes:
- During the high season, the absolute peak month showcases Cheverny's highest earning potential, with monthly revenues capable of climbing to $2,243, occupancy reaching a high of 49.0%, and ADRs peaking at $190.
- Conversely, the slowest single month of the year, typically falling within the low season, marks the market's lowest point. In this month, revenue might dip to $1,027, occupancy could drop to 26.8%, and ADRs may adjust down to $162.
- Understanding both the seasonal averages and these monthly peaks and troughs in revenue, occupancy, and ADR is crucial for maximizing your Airbnb profit potential in Cheverny.
Seasonal Strategies for Maximizing Profit
- Peak Season: Maximize revenue through premium pricing and potentially longer minimum stays. Ensure high availability.
- Low Season: Offer competitive pricing, special promotions (e.g., extended stay discounts), and flexible cancellation policies. Target off-season travelers like remote workers or budget-conscious guests.
- Shoulder Seasons: Implement dynamic pricing that balances peak and low rates. Target weekend travelers or specific events. Offer slightly more flexible terms than peak season.
- Regularly analyze your own performance against these Cheverny seasonality benchmarks and adjust your pricing and availability strategy accordingly.
Best Areas for Airbnb Investment in Cheverny (2025)
Exploring the top neighborhoods for short-term rentals in Cheverny? This section highlights key areas, outlining why they are attractive for hosts and guests, along with notable local attractions. Consider these locations based on your target guest profile and investment strategy.
| Neighborhood / Area | Why Host Here? (Target Guests & Appeal) | Key Attractions & Landmarks |
|---|---|---|
| Château de Cheverny | A stunning historic chateau known for its beautiful architecture and lush gardens. Attracts tourists interested in French history and culture, making it a perfect spot for vacation rentals. | Château de Cheverny, The gardens of the château, Wine tasting tours, Nearby cycling routes, Local markets, Historical reenactments |
| Cheverny Village | A charming village with beautiful streets and local amenities. It offers a quaint atmosphere for travelers seeking a peaceful stay amidst nature and culture. | Local bakeries and cafes, Artisan shops, Cheverny market, Walking trails, Cycling paths, Community events |
| Beauval Zoo | One of the top zoos in Europe, known for its diverse animal species and conservation efforts. A prime location for families and animal enthusiasts visiting Cheverny. | ZooParc de Beauval, Animal shows, Safari tours, Wildlife exhibits, Family-friendly activities |
| Selles-sur-Cher | A nearby town known for its historic architecture and vibrant local culture, making it a good base for travelers exploring the Cher Valley. | St. Etienne Church, Local vineyards, Historical buildings, Art exhibitions, Riverside parks |
| Blois | A city rich in history and architecture, located a short drive from Cheverny. It provides various cultural experiences and attractions for visitors. | Château de Blois, Blois Cathedral, Maison de la Magie, Historical district, Local dining |
| Amboise | Known for its royal chateau and connections to Leonardo da Vinci. Attracts history lovers and tourists looking for rich cultural experiences. | Château d'Amboise, Clos Lucé, Diane de Poitiers Garden, River Loire views, Art shops |
| Chaumont-sur-Loire | Famous for its gardens and annual garden festival. A perfect destination for nature lovers and those interested in garden design. | Château de Chaumont, Chaumont-sur-Loire gardens, Cultural events, Cycling along the Loire, Scenic views |
| Puy du Fou | A historical theme park known for its extraordinary shows and attractions. Popular with families and those looking for unique entertainment experiences. | Historical reenactments, Themed shows, Adventure park, Family activities, Dining options |
Understanding Airbnb License Requirements & STR Laws in Cheverny (2025)
While Cheverny, Centre-Val de Loire, France currently shows low STR regulations, specific Airbnb license requirements might still exist or change. Always verify the latest short term rental regulations and Airbnb license requirements directly with local government authorities for Cheverny to ensure full compliance before hosting.
(Source: AirROI data, 2025, finding no licensed listings among those analyzed)
Top Performing Airbnb Properties in Cheverny (2025)
Benchmark your potential! Explore examples of top-performing Airbnb properties in Chevernybased on Trailing Twelve Month (TTM) revenue. Analyze their characteristics, revenue, occupancy rate, and ADR to understand what drives success in this market.
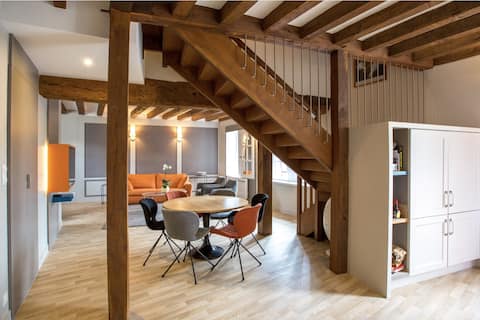
At the foot of the Castle!
Entire Place • 3 bedrooms

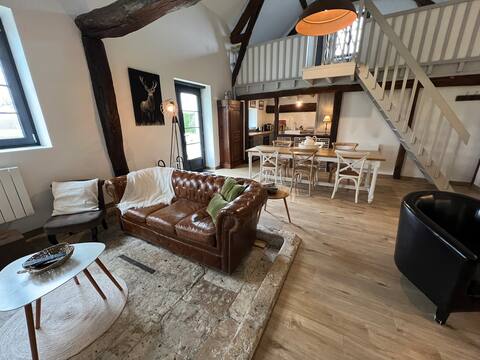
Large rural cottage "Noyer Rondin" in CHEVERNY
Entire Place • 4 bedrooms
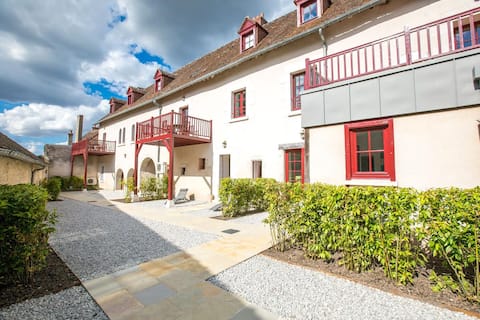
Le Pressoir de Cheverny~Château~Golf~
Entire Place • 2 bedrooms

Gîte de Château Gaillard, Cheverny.
Entire Place • 2 bedrooms

Quiet house between vineyards and field
Entire Place • 3 bedrooms
High End Accomodation in Cheverny
Entire Place • 2 bedrooms
Note: Performance varies based on location, size, amenities, seasonality, and management quality. Data reflects the past 12 months.
Top Performing Airbnb Hosts in Cheverny (2025)
Learn from the best! This table showcases top-performing Airbnb hosts in Cheverny based on the number of properties managed and estimated total revenue over the past year. Analyze their scale and performance metrics.
| Host Name | Properties | Grossing Revenue | Stay Reviews | Avg Rating |
|---|---|---|---|---|
| Les Suites De Cheverny | 4 | $95,863 | 33 | 4.98/5.0 |
| Eric | 1 | $39,001 | 104 | 4.95/5.0 |
| Arnaud | 1 | $34,514 | 16 | 5.00/5.0 |
| Jean Baptiste | 1 | $33,616 | 81 | 4.99/5.0 |
| Aurelie | 1 | $31,211 | 11 | 4.91/5.0 |
| Host #31027770 | 5 | $23,084 | 2 | 0.00/5.0 |
| Amandine | 2 | $21,761 | 296 | 4.90/5.0 |
| Stephane | 1 | $20,920 | 97 | 4.90/5.0 |
| Didier | 2 | $20,007 | 28 | 4.79/5.0 |
| Maud | 1 | $15,772 | 119 | 4.87/5.0 |
Analyzing the strategies of top hosts, such as their property selection, pricing, and guest communication, can offer valuable lessons for optimizing your own Airbnb operations in Cheverny.
Dive Deeper: Advanced Cheverny STR Market Data (2025)
Ready to unlock more insights? AirROI provides access to advanced metrics and comprehensive Airbnb data for Cheverny. Explore detailed analytics beyond this report to refine your investment strategy, optimize pricing, and maximize your vacation rental profits.
Explore Advanced MetricsCheverny Short-Term Rental Market Composition (2025): Property & Room Types
Room Type Distribution
Property Type Distribution
Market Composition Insights for Cheverny
- The Cheverny Airbnb market composition is heavily skewed towards Entire Home/Apt listings, which make up 65.5% of the 29 active rentals. This indicates strong guest preference for privacy and space.
- However, a notable 34.5% share for Private Rooms suggests opportunities for budget-conscious travelers or hosts renting out spare rooms.
- Looking at the property type distribution in Cheverny, House properties are the most common (51.7%), reflecting the local real estate landscape.
- Houses represent a significant 51.7% portion, catering likely to families or larger groups.
- The presence of 34.5% Hotel/Boutique listings indicates integration with traditional hospitality.
- Smaller segments like others (combined 3.4%) offer potential for unique stay experiences.
Cheverny Airbnb Room Capacity Analysis (2025): Bedroom Distribution
Distribution of Listings by Number of Bedrooms
Room Capacity Insights for Cheverny
- The dominant room capacity in Cheverny is 1 bedroom listings, making up 34.5% of the market. This suggests a strong demand for properties suitable for couples or solo travelers.
- Together, 1 bedroom and 2 bedrooms properties represent 62.1% of the active Airbnb listings in Cheverny, indicating a high concentration in these sizes.
- A significant 27.5% of listings offer 3+ bedrooms, catering to larger groups and families seeking more space in Cheverny.
Cheverny Vacation Rental Guest Capacity Trends (2025)
Distribution of Listings by Guest Capacity
Guest Capacity Insights for Cheverny
- The most common guest capacity trend in Cheverny vacation rentals is listings accommodating 2 guests (27.6%). This suggests the primary traveler segment is likely couples or solo travelers.
- Properties designed for 2 guests and 6 guests dominate the Cheverny STR market, accounting for 44.8% of listings.
- 30.9% of properties accommodate 6+ guests, serving the market segment for larger families or group travel in Cheverny.
- On average, properties in Cheverny are equipped to host 3.7 guests.
Cheverny Airbnb Booking Patterns (2025): Available vs. Booked Days
Available Days Distribution
Booked Days Distribution
Booking Pattern Insights for Cheverny
- The most common availability pattern in Cheverny falls within the 271-366 days range, representing 65.5% of listings. This suggests many properties have significant open periods on their calendars.
- Approximately 79.3% of listings show high availability (181+ days open annually), indicating potential for increased bookings or specific owner usage patterns.
- For booked days, the 31-90 days range is most frequent in Cheverny (51.7%), reflecting common guest stay durations or potential owner blocking patterns.
- A notable 20.6% of properties secure long booking periods (181+ days booked per year), highlighting successful long-term rental strategies or significant owner usage.
Cheverny Airbnb Minimum Stay Requirements Analysis
Distribution of Listings by Minimum Night Requirement
1 Night
10 listings
35.7% of total
2 Nights
16 listings
57.1% of total
30+ Nights
2 listings
7.1% of total
Key Insights
- The most prevalent minimum stay requirement in Cheverny is 2 Nights, adopted by 57.1% of listings. This highlights the market's preference for shorter, flexible bookings.
- A strong majority (92.8%) of the Cheverny Airbnb data shows acceptance of very short stays (1-2 nights), indicating a dynamic, high-turnover market.
Recommendations
- Align with the market by considering a 2 Nights minimum stay, as 57.1% of Cheverny hosts use this setting.
- Explore offering discounts for stays of 30+ nights to attract the 7.1% of the market seeking extended stays.
- Adjust minimum nights based on seasonality – potentially shorter during low season and longer during peak demand periods in Cheverny.
Cheverny Airbnb Cancellation Policy Trends Analysis (2025)
Flexible
7 listings
30.4% of total
Moderate
3 listings
13% of total
Firm
8 listings
34.8% of total
Strict
5 listings
21.7% of total
Cancellation Policy Insights for Cheverny
- The prevailing Airbnb cancellation policy trend in Cheverny is Firm, used by 34.8% of listings.
- A majority (56.5%) of hosts in Cheverny utilize Firm or Strict policies, indicating a market where hosts prioritize booking security.
Recommendations for Hosts
- Consider adopting a Firm policy to align with the 34.8% market standard in Cheverny.
- Regularly review your cancellation policy against competitors and market demand shifts in Cheverny.
Cheverny STR Booking Lead Time Analysis (2025)
Average Booking Lead Time by Month
Booking Lead Time Insights for Cheverny
- The overall average booking lead time for vacation rentals in Cheverny is 57 days.
- Guests book furthest in advance for stays during June (average 113 days), likely coinciding with peak travel demand or local events.
- The shortest booking windows occur for stays in January (average 36 days), indicating more last-minute travel plans during this time.
- Seasonally, Summer (91 days avg.) sees the longest lead times, while Winter (43 days avg.) has the shortest, reflecting typical travel planning cycles.
Recommendations for Hosts
- Use the overall average lead time (57 days) as a baseline for your pricing and availability strategy in Cheverny.
- For June stays, consider implementing length-of-stay discounts or slightly higher rates for bookings made less than 113 days out to capitalize on advance planning.
- Target marketing efforts for the Summer season well in advance (at least 91 days) to capture early planners.
- Monitor your own booking lead times against these Cheverny averages to identify opportunities for dynamic pricing adjustments.
Popular & Essential Airbnb Amenities in Cheverny (2025)
Amenity Prevalence
Amenity Insights for Cheverny
- Essential amenities in Cheverny that guests expect include: Free parking on premises, Heating. Lacking these (any) could significantly impact bookings.
- Popular amenities like Wifi, Hot water, Coffee maker are common but not universal. Offering these can provide a competitive edge.
- Warning: Wifi is not universally provided but is considered essential globally. Ensure reliable Wifi is offered.
Recommendations for Hosts
- Ensure your listing includes all essential amenities for Cheverny: Free parking on premises, Heating.
- Prioritize adding missing essentials: Heating.
- Consider adding popular differentiators like Wifi or Hot water to increase appeal.
- Highlight unique or less common amenities you offer (e.g., hot tub, dedicated workspace, EV charger) in your listing description and photos.
- Regularly check competitor amenities in Cheverny to stay competitive.
Cheverny Airbnb Guest Demographics & Profile Analysis (2025)
Guest Profile Summary for Cheverny
- The typical guest profile for Airbnb in Cheverny consists of primarily domestic travelers (83%), often arriving from nearby Paris, typically belonging to the Post-2000s (Gen Z/Alpha) group (50%), primarily speaking French or English.
- Domestic travelers account for 83.2% of guests.
- Key international markets include France (83.2%) and United Kingdom (3.6%).
- Top languages spoken are French (43.3%) followed by English (34.4%).
- A significant demographic segment is the Post-2000s (Gen Z/Alpha) group, representing 50% of guests.
Recommendations for Hosts
- Target domestic marketing efforts towards travelers from Paris and Nantes.
- Tailor amenities and listing descriptions to appeal to the dominant Post-2000s (Gen Z/Alpha) demographic (e.g., highlight fast WiFi, smart home features, local guides).
- Highlight unique local experiences or amenities relevant to the primary guest profile.
- Consider seasonal promotions aligned with peak travel times for key origin markets.
Nearby Short-Term Rental Market Comparison
How does the Cheverny Airbnb market stack up against its neighbors? Compare key performance metrics like average monthly revenue, ADR, and occupancy rates in surrounding areas to understand the broader regional STR landscape.
| Market | Active Properties | Monthly Revenue | Daily Rate | Avg. Occupancy |
|---|---|---|---|---|
| La Couture-Boussey | 12 | $3,620 | $378.08 | 28% |
| Dourdan | 15 | $3,576 | $223.06 | 52% |
| Millançay | 11 | $3,476 | $370.42 | 39% |
| Coteaux-sur-Loire | 19 | $3,328 | $270.00 | 41% |
| Chaintreaux | 11 | $3,136 | $278.28 | 34% |
| Langon-sur-Cher | 12 | $3,127 | $400.27 | 35% |
| Mesnils-sur-Iton | 22 | $3,028 | $309.05 | 40% |
| Tournan-en-Brie | 16 | $3,020 | $249.98 | 47% |
| Villiers-sur-Loir | 10 | $2,967 | $216.51 | 41% |
| Artannes-sur-Indre | 21 | $2,949 | $275.91 | 41% |