Chémery Airbnb Market Analysis 2025: Short Term Rental Data & Vacation Rental Statistics in Centre-Val de Loire, France
Is Airbnb profitable in Chémery in 2025? Explore comprehensive Airbnb analytics for Chémery, Centre-Val de Loire, France to uncover income potential. This 2025 STR market report for Chémery, based on AirROI data from April 2024 to March 2025, reveals key trends in the niche market of 31 active listings.
Whether you're considering an Airbnb investment in Chémery, optimizing your existing vacation rental, or exploring rental arbitrage opportunities, understanding the Chémery Airbnb data is crucial. Understanding the local regulations is key to maximizing your short term rental income potential. Let's dive into the specifics.
Key Chémery Airbnb Performance Metrics Overview
Monthly Airbnb Revenue Variations & Income Potential in Chémery (2025)
Understanding the monthly revenue variations for Airbnb listings in Chémery is key to maximizing your short term rental income potential. Seasonality significantly impacts earnings. Our analysis, based on data from the past 12 months, shows that the peak revenue month for STRs in Chémery is typically April, while February often presents the lowest earnings, highlighting opportunities for strategic pricing adjustments during shoulder and low seasons. Explore the typical Airbnb income in Chémery across different performance tiers:
- Best-in-class properties (Top 10%) achieve $3,868+ monthly, often utilizing dynamic pricing and superior guest experiences.
- Strong performing properties (Top 25%) earn $2,170 or more, indicating effective management and desirable locations/amenities.
- Typical properties (Median) generate around $1,389 per month, representing the average market performance.
- Entry-level properties (Bottom 25%) see earnings around $834, often with potential for optimization.
Average Monthly Airbnb Earnings Trend in Chémery
Chémery Airbnb Occupancy Rate Trends (2025)
Maximize your bookings by understanding the Chémery STR occupancy trends. Seasonal demand shifts significantly influence how often properties are booked. Typically, Augustsees the highest demand (peak season occupancy), while March experiences the lowest (low season). Effective strategies, like adjusting minimum stays or offering promotions, can boost occupancy during slower periods. Here's how different property tiers perform in Chémery:
- Best-in-class properties (Top 10%) achieve 76%+ occupancy, indicating high desirability and potentially optimized availability.
- Strong performing properties (Top 25%) maintain 60% or higher occupancy, suggesting good market fit and guest satisfaction.
- Typical properties (Median) have an occupancy rate around 35%.
- Entry-level properties (Bottom 25%) average 15% occupancy, potentially facing higher vacancy.
Average Monthly Occupancy Rate Trend in Chémery
Average Daily Rate (ADR) Airbnb Trends in Chémery (2025)
Effective short term rental pricing strategy in Chémery involves understanding monthly ADR fluctuations. The Average Daily Rate (ADR) for Airbnb in Chémery typically peaks in December and dips lowest during April. Leveraging Airbnb dynamic pricing tools or strategies based on this seasonality can significantly boost revenue. Here's a look at the typical nightly rates achieved:
- Best-in-class properties (Top 10%) command rates of $256+ per night, often due to premium features or locations.
- Strong performing properties (Top 25%) achieve nightly rates of $184 or more.
- Typical properties (Median) charge around $130 per night.
- Entry-level properties (Bottom 25%) earn around $94 per night.
Average Daily Rate (ADR) Trend by Month in Chémery
Get Live Chémery Market Intelligence 👇

Explore Real-time Analytics
Airbnb Seasonality Analysis & Trends in Chémery (2025)
Peak Season (April, June, May)
- Revenue averages $2,841 per month
- Occupancy rates average 47.1%
- Daily rates average $169
Shoulder Season
- Revenue averages $1,792 per month
- Occupancy maintains around 43.2%
- Daily rates hold near $176
Low Season (January, February, March)
- Revenue drops to average $1,041 per month
- Occupancy decreases to average 26.2%
- Daily rates adjust to average $182
Seasonality Insights for Chémery
- The Airbnb seasonality in Chémery shows highly seasonal trends requiring careful strategy. While the sections above show seasonal averages, it's also insightful to look at the extremes:
- During the high season, the absolute peak month showcases Chémery's highest earning potential, with monthly revenues capable of climbing to $3,060, occupancy reaching a high of 54.1%, and ADRs peaking at $187.
- Conversely, the slowest single month of the year, typically falling within the low season, marks the market's lowest point. In this month, revenue might dip to $918, occupancy could drop to 25.3%, and ADRs may adjust down to $167.
- Understanding both the seasonal averages and these monthly peaks and troughs in revenue, occupancy, and ADR is crucial for maximizing your Airbnb profit potential in Chémery.
Seasonal Strategies for Maximizing Profit
- Peak Season: Maximize revenue through premium pricing and potentially longer minimum stays. Ensure high availability.
- Low Season: Offer competitive pricing, special promotions (e.g., extended stay discounts), and flexible cancellation policies. Target off-season travelers like remote workers or budget-conscious guests.
- Shoulder Seasons: Implement dynamic pricing that balances peak and low rates. Target weekend travelers or specific events. Offer slightly more flexible terms than peak season.
- Regularly analyze your own performance against these Chémery seasonality benchmarks and adjust your pricing and availability strategy accordingly.
Best Areas for Airbnb Investment in Chémery (2025)
Exploring the top neighborhoods for short-term rentals in Chémery? This section highlights key areas, outlining why they are attractive for hosts and guests, along with notable local attractions. Consider these locations based on your target guest profile and investment strategy.
| Neighborhood / Area | Why Host Here? (Target Guests & Appeal) | Key Attractions & Landmarks |
|---|---|---|
| Château de Chémery | A beautiful historic castle known for its stunning architecture and rich history. Attracts tourists fascinated by historical landmarks and photography opportunities. | Château de Chémery, Historic gardens, Guided tours, Photography spots |
| Loire Valley Vineyards | Famous for its picturesque vineyards and wine-tasting experiences. A perfect stay for those looking to explore the French countryside and enjoy local wines. | Wine tastings, Vineyard tours, Scenic bike routes, Culinary experiences |
| Chémery Town Center | The heart of the town with local shops, cafes, and charming streets. An ideal location for guests wanting to experience local culture and cuisine. | Local markets, Cafés, Shops, Community events |
| Parc Naturel Régional de la Brenne | A regional natural park known for its stunning landscapes and biodiversity. Great for outdoor enthusiasts and nature lovers. | Birdwatching, Hiking trails, Picnic areas, Nature photography |
| Chateau de Blois | A short drive away from Chémery, this historic castle offers rich history and beautiful grounds. Ideal for families and history buffs. | Chateau tours, Beautiful gardens, Cultural events, Local exhibitions |
| Château de Chambord | One of the most recognizable châteaux in the Loire Valley, known for its distinctive French Renaissance architecture. A key attraction for international tourists. | Château tours, Gardens, Cycling paths, Cultural events |
| Villandry Gardens | Famous for its Renaissance gardens, attracting tourists interested in gardening and landscape design, as well as romantic getaways. | Unique garden designs, Guided garden tours, Seasonal events |
| Cultural Festivals in Chémery | The town hosts various cultural festivals, which attract both locals and tourists, offering a unique experience of local traditions and festivities. | Local arts and crafts, Food stalls, Music performances, Traditional dances |
Understanding Airbnb License Requirements & STR Laws in Chémery (2025)
With 13% of listings showing registration in 2025, understanding potential Airbnb license requirements is crucial in Chémery. Always verify the latest short term rental regulations and Airbnb license requirements directly with local government authorities for Chémery to ensure full compliance before hosting.
(Source: AirROI data, 2025, based on 13% licensed listings)
Top Performing Airbnb Properties in Chémery (2025)
Benchmark your potential! Explore examples of top-performing Airbnb properties in Chémerybased on Trailing Twelve Month (TTM) revenue. Analyze their characteristics, revenue, occupancy rate, and ADR to understand what drives success in this market.
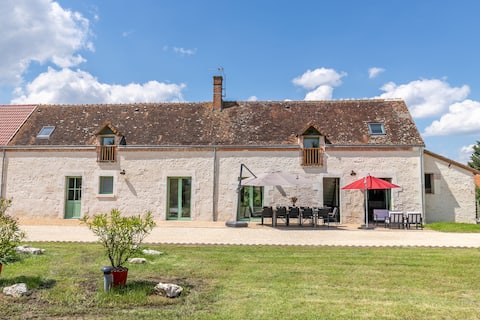
Longère "Les Lilas", nature, and calm
Entire Place • 6 bedrooms
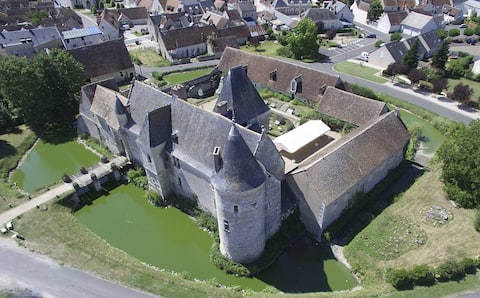
Chateau de Chémery, weddings, authentic stays
Entire Place • 5 bedrooms
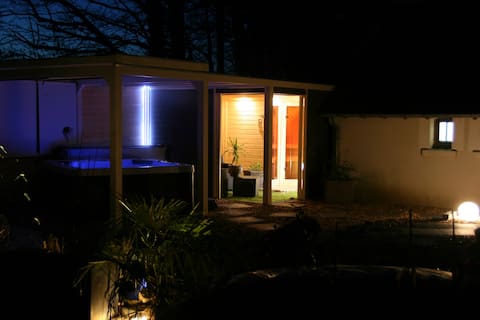
*** SPA et SAUNA privatifs ***
Entire Place • 3 bedrooms

GITE DE L'ETANGdeL'ARCHE near CHAMBORD/BEAUVAL ZOO
Entire Place • 4 bedrooms

Relaxation cottage with Spa and Sauna
Entire Place • 1 bedroom
La Clairette - Climatisé - 11 pers proche Beauval
Entire Place • 4 bedrooms
Note: Performance varies based on location, size, amenities, seasonality, and management quality. Data reflects the past 12 months.
Top Performing Airbnb Hosts in Chémery (2025)
Learn from the best! This table showcases top-performing Airbnb hosts in Chémery based on the number of properties managed and estimated total revenue over the past year. Analyze their scale and performance metrics.
| Host Name | Properties | Grossing Revenue | Stay Reviews | Avg Rating |
|---|---|---|---|---|
| Conciergerie Du Domaine Des Ch | 1 | $72,903 | 10 | 5.00/5.0 |
| Nathalie | 4 | $70,278 | 827 | 4.97/5.0 |
| Hameau | 2 | $62,913 | 197 | 4.88/5.0 |
| Luc | 1 | $43,582 | 3 | 4.00/5.0 |
| Host #21636138 | 5 | $33,005 | 0 | 0.00/5.0 |
| Eric | 1 | $32,103 | 103 | 4.99/5.0 |
| Marie Christine | 7 | $27,616 | 75 | 4.87/5.0 |
| Pascale | 2 | $27,181 | 480 | 4.92/5.0 |
| Host #201600155 | 1 | $22,127 | 6 | 5.00/5.0 |
| Adriana Les Clés De Sologne | 2 | $17,840 | 34 | 4.88/5.0 |
Analyzing the strategies of top hosts, such as their property selection, pricing, and guest communication, can offer valuable lessons for optimizing your own Airbnb operations in Chémery.
Dive Deeper: Advanced Chémery STR Market Data (2025)
Ready to unlock more insights? AirROI provides access to advanced metrics and comprehensive Airbnb data for Chémery. Explore detailed analytics beyond this report to refine your investment strategy, optimize pricing, and maximize your vacation rental profits.
Explore Advanced MetricsChémery Short-Term Rental Market Composition (2025): Property & Room Types
Room Type Distribution
Property Type Distribution
Market Composition Insights for Chémery
- The Chémery Airbnb market composition is heavily skewed towards Entire Home/Apt listings, which make up 77.4% of the 31 active rentals. This indicates strong guest preference for privacy and space.
- Looking at the property type distribution in Chémery, House properties are the most common (58.1%), reflecting the local real estate landscape.
- Houses represent a significant 58.1% portion, catering likely to families or larger groups.
- The presence of 19.4% Hotel/Boutique listings indicates integration with traditional hospitality.
- Smaller segments like outdoor/unique (combined 3.2%) offer potential for unique stay experiences.
Chémery Airbnb Room Capacity Analysis (2025): Bedroom Distribution
Distribution of Listings by Number of Bedrooms
Room Capacity Insights for Chémery
- The dominant room capacity in Chémery is 1 bedroom listings, making up 32.3% of the market. This suggests a strong demand for properties suitable for couples or solo travelers.
- Together, 1 bedroom and 3 bedrooms properties represent 54.9% of the active Airbnb listings in Chémery, indicating a high concentration in these sizes.
- A significant 38.8% of listings offer 3+ bedrooms, catering to larger groups and families seeking more space in Chémery.
Chémery Vacation Rental Guest Capacity Trends (2025)
Distribution of Listings by Guest Capacity
Guest Capacity Insights for Chémery
- The most common guest capacity trend in Chémery vacation rentals is listings accommodating 8+ guests (32.3%). This suggests the primary traveler segment is likely larger groups.
- Properties designed for 8+ guests and 4 guests dominate the Chémery STR market, accounting for 51.7% of listings.
- 48.4% of properties accommodate 6+ guests, serving the market segment for larger families or group travel in Chémery.
- On average, properties in Chémery are equipped to host 5.1 guests.
Chémery Airbnb Booking Patterns (2025): Available vs. Booked Days
Available Days Distribution
Booked Days Distribution
Booking Pattern Insights for Chémery
- The most common availability pattern in Chémery falls within the 271-366 days range, representing 58.1% of listings. This suggests many properties have significant open periods on their calendars.
- Approximately 74.2% of listings show high availability (181+ days open annually), indicating potential for increased bookings or specific owner usage patterns.
- For booked days, the 1-30 days range is most frequent in Chémery (25.8%), reflecting common guest stay durations or potential owner blocking patterns.
- A notable 25.8% of properties secure long booking periods (181+ days booked per year), highlighting successful long-term rental strategies or significant owner usage.
Chémery Airbnb Minimum Stay Requirements Analysis
Distribution of Listings by Minimum Night Requirement
1 Night
18 listings
60% of total
2 Nights
9 listings
30% of total
4-6 Nights
2 listings
6.7% of total
30+ Nights
1 listings
3.3% of total
Key Insights
- The most prevalent minimum stay requirement in Chémery is 1 Night, adopted by 60% of listings. This highlights the market's preference for shorter, flexible bookings.
- A strong majority (90.0%) of the Chémery Airbnb data shows acceptance of very short stays (1-2 nights), indicating a dynamic, high-turnover market.
Recommendations
- Align with the market by considering a 1 Night minimum stay, as 60% of Chémery hosts use this setting.
- Adjust minimum nights based on seasonality – potentially shorter during low season and longer during peak demand periods in Chémery.
Chémery Airbnb Cancellation Policy Trends Analysis (2025)
Flexible
14 listings
56% of total
Moderate
6 listings
24% of total
Firm
3 listings
12% of total
Strict
2 listings
8% of total
Cancellation Policy Insights for Chémery
- The prevailing Airbnb cancellation policy trend in Chémery is Flexible, used by 56% of listings.
- The market strongly favors guest-friendly terms, with 80.0% of listings offering Flexible or Moderate policies. This suggests guests in Chémery may expect booking flexibility.
- Strict cancellation policies are quite rare (8%), potentially making listings with this policy less competitive unless justified by high demand or property type.
Recommendations for Hosts
- Consider adopting a Flexible policy to align with the 56% market standard in Chémery.
- Given the high prevalence of Flexible policies (56%), offering this can enhance booking appeal, especially during shoulder seasons.
- Using a Strict policy might deter some guests, as only 8% of listings use it. Evaluate if potential revenue protection outweighs possible lower booking rates.
- Regularly review your cancellation policy against competitors and market demand shifts in Chémery.
Chémery STR Booking Lead Time Analysis (2025)
Average Booking Lead Time by Month
Booking Lead Time Insights for Chémery
- The overall average booking lead time for vacation rentals in Chémery is 54 days.
- Guests book furthest in advance for stays during June (average 96 days), likely coinciding with peak travel demand or local events.
- The shortest booking windows occur for stays in March (average 40 days), indicating more last-minute travel plans during this time.
- Seasonally, Summer (85 days avg.) sees the longest lead times, while Winter (53 days avg.) has the shortest, reflecting typical travel planning cycles.
Recommendations for Hosts
- Use the overall average lead time (54 days) as a baseline for your pricing and availability strategy in Chémery.
- For June stays, consider implementing length-of-stay discounts or slightly higher rates for bookings made less than 96 days out to capitalize on advance planning.
- Target marketing efforts for the Summer season well in advance (at least 85 days) to capture early planners.
- Monitor your own booking lead times against these Chémery averages to identify opportunities for dynamic pricing adjustments.
Popular & Essential Airbnb Amenities in Chémery (2025)
Amenity Prevalence
Amenity Insights for Chémery
- Essential amenities in Chémery that guests expect include: Heating, Free parking on premises, Hot water, TV. Lacking these (any) could significantly impact bookings.
- Popular amenities like Kitchen, Smoke alarm, Wifi are common but not universal. Offering these can provide a competitive edge.
- Warning: Wifi is not universally provided but is considered essential globally. Ensure reliable Wifi is offered.
Recommendations for Hosts
- Ensure your listing includes all essential amenities for Chémery: Heating, Free parking on premises, Hot water, TV.
- Prioritize adding missing essentials: Free parking on premises, Hot water, TV.
- Consider adding popular differentiators like Kitchen or Smoke alarm to increase appeal.
- Highlight unique or less common amenities you offer (e.g., hot tub, dedicated workspace, EV charger) in your listing description and photos.
- Regularly check competitor amenities in Chémery to stay competitive.
Chémery Airbnb Guest Demographics & Profile Analysis (2025)
Guest Profile Summary for Chémery
- The typical guest profile for Airbnb in Chémery consists of primarily domestic travelers (94%), often arriving from nearby Paris, typically belonging to the Post-2000s (Gen Z/Alpha) group (50%), primarily speaking French or English.
- Domestic travelers account for 93.5% of guests.
- Key international markets include France (93.5%) and United Kingdom (1.6%).
- Top languages spoken are French (49.6%) followed by English (29.6%).
- A significant demographic segment is the Post-2000s (Gen Z/Alpha) group, representing 50% of guests.
Recommendations for Hosts
- Target domestic marketing efforts towards travelers from Paris and Montpellier.
- Tailor amenities and listing descriptions to appeal to the dominant Post-2000s (Gen Z/Alpha) demographic (e.g., highlight fast WiFi, smart home features, local guides).
- Highlight unique local experiences or amenities relevant to the primary guest profile.
- Consider seasonal promotions aligned with peak travel times for key origin markets.
Nearby Short-Term Rental Market Comparison
How does the Chémery Airbnb market stack up against its neighbors? Compare key performance metrics like average monthly revenue, ADR, and occupancy rates in surrounding areas to understand the broader regional STR landscape.
| Market | Active Properties | Monthly Revenue | Daily Rate | Avg. Occupancy |
|---|---|---|---|---|
| La Couture-Boussey | 12 | $3,620 | $378.08 | 28% |
| Dourdan | 15 | $3,576 | $223.06 | 52% |
| Millançay | 11 | $3,476 | $370.42 | 39% |
| Coteaux-sur-Loire | 19 | $3,328 | $270.00 | 41% |
| Chaintreaux | 11 | $3,136 | $278.28 | 34% |
| Langon-sur-Cher | 12 | $3,127 | $400.27 | 35% |
| Mesnils-sur-Iton | 22 | $3,028 | $309.05 | 40% |
| Tournan-en-Brie | 16 | $3,020 | $249.98 | 47% |
| Villiers-sur-Loir | 10 | $2,967 | $216.51 | 41% |
| Artannes-sur-Indre | 21 | $2,949 | $275.91 | 41% |