Saint-Renan Airbnb Market Analysis 2025: Short Term Rental Data & Vacation Rental Statistics in Brittany, France
Is Airbnb profitable in Saint-Renan in 2025? Explore comprehensive Airbnb analytics for Saint-Renan, Brittany, France to uncover income potential. This 2025 STR market report for Saint-Renan, based on AirROI data from April 2024 to March 2025, reveals key trends in the niche market of 22 active listings.
Whether you're considering an Airbnb investment in Saint-Renan, optimizing your existing vacation rental, or exploring rental arbitrage opportunities, understanding the Saint-Renan Airbnb data is crucial. Leveraging the low regulation environment is key to maximizing your short term rental income potential. Let's dive into the specifics.
Key Saint-Renan Airbnb Performance Metrics Overview
Monthly Airbnb Revenue Variations & Income Potential in Saint-Renan (2025)
Understanding the monthly revenue variations for Airbnb listings in Saint-Renan is key to maximizing your short term rental income potential. Seasonality significantly impacts earnings. Our analysis, based on data from the past 12 months, shows that the peak revenue month for STRs in Saint-Renan is typically August, while February often presents the lowest earnings, highlighting opportunities for strategic pricing adjustments during shoulder and low seasons. Explore the typical Airbnb income in Saint-Renan across different performance tiers:
- Best-in-class properties (Top 10%) achieve $2,509+ monthly, often utilizing dynamic pricing and superior guest experiences.
- Strong performing properties (Top 25%) earn $1,741 or more, indicating effective management and desirable locations/amenities.
- Typical properties (Median) generate around $940 per month, representing the average market performance.
- Entry-level properties (Bottom 25%) see earnings around $522, often with potential for optimization.
Average Monthly Airbnb Earnings Trend in Saint-Renan
Saint-Renan Airbnb Occupancy Rate Trends (2025)
Maximize your bookings by understanding the Saint-Renan STR occupancy trends. Seasonal demand shifts significantly influence how often properties are booked. Typically, Augustsees the highest demand (peak season occupancy), while June experiences the lowest (low season). Effective strategies, like adjusting minimum stays or offering promotions, can boost occupancy during slower periods. Here's how different property tiers perform in Saint-Renan:
- Best-in-class properties (Top 10%) achieve 83%+ occupancy, indicating high desirability and potentially optimized availability.
- Strong performing properties (Top 25%) maintain 71% or higher occupancy, suggesting good market fit and guest satisfaction.
- Typical properties (Median) have an occupancy rate around 41%.
- Entry-level properties (Bottom 25%) average 20% occupancy, potentially facing higher vacancy.
Average Monthly Occupancy Rate Trend in Saint-Renan
Average Daily Rate (ADR) Airbnb Trends in Saint-Renan (2025)
Effective short term rental pricing strategy in Saint-Renan involves understanding monthly ADR fluctuations. The Average Daily Rate (ADR) for Airbnb in Saint-Renan typically peaks in July and dips lowest during March. Leveraging Airbnb dynamic pricing tools or strategies based on this seasonality can significantly boost revenue. Here's a look at the typical nightly rates achieved:
- Best-in-class properties (Top 10%) command rates of $212+ per night, often due to premium features or locations.
- Strong performing properties (Top 25%) achieve nightly rates of $140 or more.
- Typical properties (Median) charge around $85 per night.
- Entry-level properties (Bottom 25%) earn around $56 per night.
Average Daily Rate (ADR) Trend by Month in Saint-Renan
Get Live Saint-Renan Market Intelligence 👇

Explore Real-time Analytics
Airbnb Seasonality Analysis & Trends in Saint-Renan (2025)
Peak Season (August, July, June)
- Revenue averages $1,819 per month
- Occupancy rates average 52.2%
- Daily rates average $119
Shoulder Season
- Revenue averages $1,147 per month
- Occupancy maintains around 41.6%
- Daily rates hold near $114
Low Season (January, February, March)
- Revenue drops to average $780 per month
- Occupancy decreases to average 46.1%
- Daily rates adjust to average $98
Seasonality Insights for Saint-Renan
- The Airbnb seasonality in Saint-Renan shows highly seasonal trends requiring careful strategy. While the sections above show seasonal averages, it's also insightful to look at the extremes:
- During the high season, the absolute peak month showcases Saint-Renan's highest earning potential, with monthly revenues capable of climbing to $2,190, occupancy reaching a high of 69.5%, and ADRs peaking at $121.
- Conversely, the slowest single month of the year, typically falling within the low season, marks the market's lowest point. In this month, revenue might dip to $587, occupancy could drop to 32.9%, and ADRs may adjust down to $97.
- Understanding both the seasonal averages and these monthly peaks and troughs in revenue, occupancy, and ADR is crucial for maximizing your Airbnb profit potential in Saint-Renan.
Seasonal Strategies for Maximizing Profit
- Peak Season: Maximize revenue through premium pricing and potentially longer minimum stays. Ensure high availability.
- Low Season: Offer competitive pricing, special promotions (e.g., extended stay discounts), and flexible cancellation policies. Target off-season travelers like remote workers or budget-conscious guests.
- Shoulder Seasons: Implement dynamic pricing that balances peak and low rates. Target weekend travelers or specific events. Offer slightly more flexible terms than peak season.
- Regularly analyze your own performance against these Saint-Renan seasonality benchmarks and adjust your pricing and availability strategy accordingly.
Best Areas for Airbnb Investment in Saint-Renan (2025)
Exploring the top neighborhoods for short-term rentals in Saint-Renan? This section highlights key areas, outlining why they are attractive for hosts and guests, along with notable local attractions. Consider these locations based on your target guest profile and investment strategy.
| Neighborhood / Area | Why Host Here? (Target Guests & Appeal) | Key Attractions & Landmarks |
|---|---|---|
| Saint-Renan Town Center | Charming historic town with beautiful architecture and a vibrant market atmosphere. Ideal for tourists wanting to experience local culture and history. | Saint-Renan Church, Market Square, La Route des Vins, Local boutiques, Cafés and bistros |
| Plougonvelin Beaches | Stunning coastal area with sandy beaches and nature. Great for families and beach lovers looking for seaside activities. | Plage de Trez Hir, Plage de Bertheaume, Hiking trails, Kitesurfing spots, Scenic viewpoints |
| Océanopolis | Aquarium and ocean discovery park, offering educational experiences. Attracts families and tourists interested in marine life. | Océanopolis exhibits, Educational workshops, Seaside walks, Nearby restaurants, Aquatic shows |
| Camaret-sur-Mer | Quaint fishing village known for its picturesque harbor and marine activities. Perfect for tourists looking for a peaceful retreat by the sea. | Camaret harbor, Tour Vauban, Hiking trails, Local seafood restaurants, Cultural events |
| Crozon Peninsula | Dramatic cliffs and breathtaking scenery attract outdoor enthusiasts and nature lovers. Ideal for active visitors and scenic views. | Cap de la Chèvre, Beach of La Palue, Hiking trails, Sea kayaking, Wildlife watching |
| Local Markets | Saint-Renan hosts local markets that showcase regional produce and crafts. Ideal for tourists seeking an authentic experience. | Weekly market at Place de l'Hôtel de Ville, Local artisan goods, Regional food vendors, Crafts and textiles, Cultural atmosphere |
| Ile de Ouessant | Famous island accessible by boat, known for its rugged beauty and rich maritime heritage. Attracts adventurous visitors. | Lighthouses, Hiking paths, Beautiful coastline, Local wildlife, Cultural museums |
| Historic Sites Nearby | The area is rich in history with numerous megalithic sites and ancient monuments. Perfect for history buffs visiting Brittany. | Alignments of Lagatjar, Château de Brest, Neolithic sites, Historic villages, Cultural heritage tours |
Understanding Airbnb License Requirements & STR Laws in Saint-Renan (2025)
While Saint-Renan, Brittany, France currently shows low STR regulations, specific Airbnb license requirements might still exist or change. Always verify the latest short term rental regulations and Airbnb license requirements directly with local government authorities for Saint-Renan to ensure full compliance before hosting.
(Source: AirROI data, 2025, based on 9% licensed listings)
Top Performing Airbnb Properties in Saint-Renan (2025)
Benchmark your potential! Explore examples of top-performing Airbnb properties in Saint-Renanbased on Trailing Twelve Month (TTM) revenue. Analyze their characteristics, revenue, occupancy rate, and ADR to understand what drives success in this market.
ideal house seaside holidays
Entire Place • 4 bedrooms
Sleeps 7, St Renan center
Entire Place • 3 bedrooms

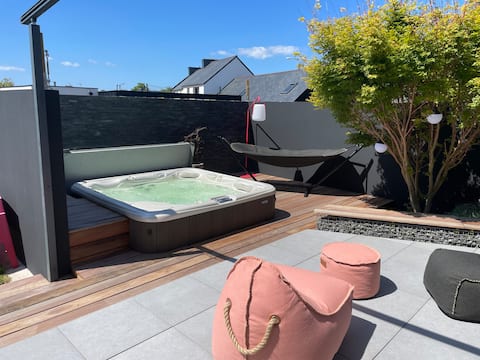
House with jacuzzi near beaches and city center
Entire Place • 2 bedrooms
House wood garden spa 10 minutes from the beaches
Entire Place • 4 bedrooms

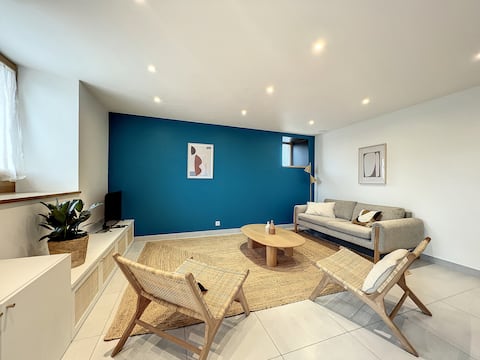
Apartment for 4-5 non-smokers near village centre
Entire Place • 2 bedrooms
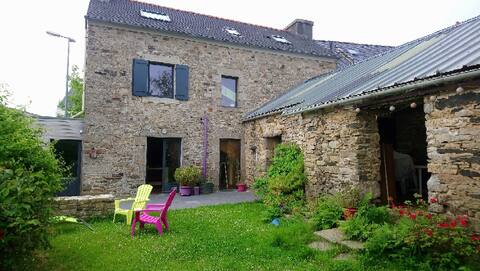
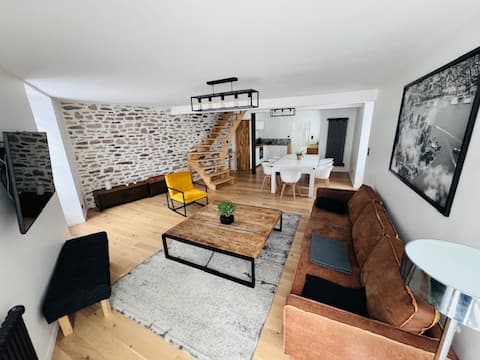
Fully renovated farmhouse
Entire Place • 2 bedrooms
Note: Performance varies based on location, size, amenities, seasonality, and management quality. Data reflects the past 12 months.
Top Performing Airbnb Hosts in Saint-Renan (2025)
Learn from the best! This table showcases top-performing Airbnb hosts in Saint-Renan based on the number of properties managed and estimated total revenue over the past year. Analyze their scale and performance metrics.
| Host Name | Properties | Grossing Revenue | Stay Reviews | Avg Rating |
|---|---|---|---|---|
| Anne-Cécile | 1 | $25,836 | 130 | 4.89/5.0 |
| Pierre | 2 | $22,601 | 58 | 4.84/5.0 |
| Sébastien | 1 | $17,406 | 6 | 4.83/5.0 |
| Bertrand | 2 | $15,621 | 60 | 4.71/5.0 |
| Sébastien | 1 | $14,838 | 7 | 4.71/5.0 |
| Carole | 1 | $14,793 | 3 | 5.00/5.0 |
| Aurore | 1 | $12,719 | 8 | 4.75/5.0 |
| Marie Lou | 1 | $11,910 | 14 | 4.71/5.0 |
| Concierge BNB | 1 | $11,318 | 43 | 4.30/5.0 |
| Lise | 1 | $10,678 | 9 | 5.00/5.0 |
Analyzing the strategies of top hosts, such as their property selection, pricing, and guest communication, can offer valuable lessons for optimizing your own Airbnb operations in Saint-Renan.
Dive Deeper: Advanced Saint-Renan STR Market Data (2025)
Ready to unlock more insights? AirROI provides access to advanced metrics and comprehensive Airbnb data for Saint-Renan. Explore detailed analytics beyond this report to refine your investment strategy, optimize pricing, and maximize your vacation rental profits.
Explore Advanced MetricsSaint-Renan Short-Term Rental Market Composition (2025): Property & Room Types
Room Type Distribution
Property Type Distribution
Market Composition Insights for Saint-Renan
- The Saint-Renan Airbnb market composition is heavily skewed towards Entire Home/Apt listings, which make up 81.8% of the 22 active rentals. This indicates strong guest preference for privacy and space.
- Looking at the property type distribution in Saint-Renan, House properties are the most common (63.6%), reflecting the local real estate landscape.
- Houses represent a significant 63.6% portion, catering likely to families or larger groups.
- Smaller segments like others (combined 4.5%) offer potential for unique stay experiences.
Saint-Renan Airbnb Room Capacity Analysis (2025): Bedroom Distribution
Distribution of Listings by Number of Bedrooms
Room Capacity Insights for Saint-Renan
- The dominant room capacity in Saint-Renan is 2 bedrooms listings, making up 27.3% of the market. This suggests a strong demand for properties suitable for couples or solo travelers.
- Together, 2 bedrooms and 1 bedroom properties represent 50.0% of the active Airbnb listings in Saint-Renan, indicating a high concentration in these sizes.
- A significant 36.4% of listings offer 3+ bedrooms, catering to larger groups and families seeking more space in Saint-Renan.
Saint-Renan Vacation Rental Guest Capacity Trends (2025)
Distribution of Listings by Guest Capacity
Guest Capacity Insights for Saint-Renan
- The most common guest capacity trend in Saint-Renan vacation rentals is listings accommodating 4 guests (27.3%). This suggests the primary traveler segment is likely small families or groups.
- Properties designed for 4 guests and 8+ guests dominate the Saint-Renan STR market, accounting for 50.0% of listings.
- 36.3% of properties accommodate 6+ guests, serving the market segment for larger families or group travel in Saint-Renan.
- On average, properties in Saint-Renan are equipped to host 4.5 guests.
Saint-Renan Airbnb Booking Patterns (2025): Available vs. Booked Days
Available Days Distribution
Booked Days Distribution
Booking Pattern Insights for Saint-Renan
- The most common availability pattern in Saint-Renan falls within the 181-270 days range, representing 45.5% of listings. This suggests many properties have significant open periods on their calendars.
- Approximately 86.4% of listings show high availability (181+ days open annually), indicating potential for increased bookings or specific owner usage patterns.
- For booked days, the 91-180 days range is most frequent in Saint-Renan (45.5%), reflecting common guest stay durations or potential owner blocking patterns.
- A notable 13.6% of properties secure long booking periods (181+ days booked per year), highlighting successful long-term rental strategies or significant owner usage.
Saint-Renan Airbnb Minimum Stay Requirements Analysis
Distribution of Listings by Minimum Night Requirement
1 Night
6 listings
30% of total
2 Nights
3 listings
15% of total
3 Nights
1 listings
5% of total
4-6 Nights
3 listings
15% of total
7-29 Nights
3 listings
15% of total
30+ Nights
4 listings
20% of total
Key Insights
- The most prevalent minimum stay requirement in Saint-Renan is 1 Night, adopted by 30% of listings. This highlights the market's preference for shorter, flexible bookings.
- A significant segment (20%) caters to monthly stays (30+ nights) in Saint-Renan, pointing to opportunities in the extended-stay market.
Recommendations
- Align with the market by considering a 1 Night minimum stay, as 30% of Saint-Renan hosts use this setting.
- Explore offering discounts for stays of 30+ nights to attract the 20% of the market seeking extended stays.
- Adjust minimum nights based on seasonality – potentially shorter during low season and longer during peak demand periods in Saint-Renan.
Saint-Renan Airbnb Cancellation Policy Trends Analysis (2025)
Flexible
9 listings
47.4% of total
Moderate
4 listings
21.1% of total
Firm
4 listings
21.1% of total
Strict
2 listings
10.5% of total
Cancellation Policy Insights for Saint-Renan
- The prevailing Airbnb cancellation policy trend in Saint-Renan is Flexible, used by 47.4% of listings.
- There's a relatively balanced mix between guest-friendly (68.5%) and stricter (31.6%) policies, offering choices for different guest needs.
Recommendations for Hosts
- Consider adopting a Flexible policy to align with the 47.4% market standard in Saint-Renan.
- Using a Strict policy might deter some guests, as only 10.5% of listings use it. Evaluate if potential revenue protection outweighs possible lower booking rates.
- Regularly review your cancellation policy against competitors and market demand shifts in Saint-Renan.
Saint-Renan STR Booking Lead Time Analysis (2025)
Average Booking Lead Time by Month
Booking Lead Time Insights for Saint-Renan
- The overall average booking lead time for vacation rentals in Saint-Renan is 53 days.
- Guests book furthest in advance for stays during May (average 86 days), likely coinciding with peak travel demand or local events.
- The shortest booking windows occur for stays in February (average 13 days), indicating more last-minute travel plans during this time.
- Seasonally, Spring (59 days avg.) sees the longest lead times, while Winter (28 days avg.) has the shortest, reflecting typical travel planning cycles.
Recommendations for Hosts
- Use the overall average lead time (53 days) as a baseline for your pricing and availability strategy in Saint-Renan.
- For May stays, consider implementing length-of-stay discounts or slightly higher rates for bookings made less than 86 days out to capitalize on advance planning.
- During February, focus on last-minute booking availability and promotions, as guests book with very short notice (13 days avg.).
- Target marketing efforts for the Spring season well in advance (at least 59 days) to capture early planners.
- Monitor your own booking lead times against these Saint-Renan averages to identify opportunities for dynamic pricing adjustments.
Popular & Essential Airbnb Amenities in Saint-Renan (2025)
Amenity Prevalence
Amenity Insights for Saint-Renan
- Essential amenities in Saint-Renan that guests expect include: Hot water, Wifi. Lacking these (any) could significantly impact bookings.
- Popular amenities like Heating, Smoke alarm, Kitchen are common but not universal. Offering these can provide a competitive edge.
Recommendations for Hosts
- Ensure your listing includes all essential amenities for Saint-Renan: Hot water, Wifi.
- Prioritize adding missing essentials: Hot water, Wifi.
- Consider adding popular differentiators like Heating or Smoke alarm to increase appeal.
- Highlight unique or less common amenities you offer (e.g., hot tub, dedicated workspace, EV charger) in your listing description and photos.
- Regularly check competitor amenities in Saint-Renan to stay competitive.
Saint-Renan Airbnb Guest Demographics & Profile Analysis (2025)
Guest Profile Summary for Saint-Renan
- The typical guest profile for Airbnb in Saint-Renan consists of primarily domestic travelers (93%), often arriving from nearby Telgruc-sur-Mer, typically belonging to the Post-2000s (Gen Z/Alpha) group (50%), primarily speaking French or English.
- Domestic travelers account for 92.6% of guests.
- Key international markets include France (92.6%) and United Kingdom (1.1%).
- Top languages spoken are French (55.1%) followed by English (29.9%).
- A significant demographic segment is the Post-2000s (Gen Z/Alpha) group, representing 50% of guests.
Recommendations for Hosts
- Target domestic marketing efforts towards travelers from Telgruc-sur-Mer and Nantes.
- Tailor amenities and listing descriptions to appeal to the dominant Post-2000s (Gen Z/Alpha) demographic (e.g., highlight fast WiFi, smart home features, local guides).
- Highlight unique local experiences or amenities relevant to the primary guest profile.
- Consider seasonal promotions aligned with peak travel times for key origin markets.
Nearby Short-Term Rental Market Comparison
How does the Saint-Renan Airbnb market stack up against its neighbors? Compare key performance metrics like average monthly revenue, ADR, and occupancy rates in surrounding areas to understand the broader regional STR landscape.
| Market | Active Properties | Monthly Revenue | Daily Rate | Avg. Occupancy |
|---|---|---|---|---|
| Île-de-Bréhat | 46 | $2,254 | $221.52 | 45% |
| Ushant | 64 | $2,087 | $152.83 | 54% |
| Lanmodez | 19 | $2,050 | $219.93 | 42% |
| Guern | 13 | $1,802 | $102.72 | 42% |
| Landaul | 17 | $1,697 | $148.36 | 45% |
| Plourin | 16 | $1,686 | $176.47 | 45% |
| Sainte-Brigitte | 11 | $1,652 | $164.87 | 39% |
| Langoat | 10 | $1,645 | $105.20 | 58% |
| Plounéour-Brignogan-Plages | 170 | $1,596 | $192.20 | 39% |
| Sibiril | 43 | $1,568 | $162.58 | 44% |