Saint-Grégoire Airbnb Market Analysis 2025: Short Term Rental Data & Vacation Rental Statistics in Brittany, France
Is Airbnb profitable in Saint-Grégoire in 2025? Explore comprehensive Airbnb analytics for Saint-Grégoire, Brittany, France to uncover income potential. This 2025 STR market report for Saint-Grégoire, based on AirROI data from April 2024 to March 2025, reveals key trends in the niche market of 30 active listings.
Whether you're considering an Airbnb investment in Saint-Grégoire, optimizing your existing vacation rental, or exploring rental arbitrage opportunities, understanding the Saint-Grégoire Airbnb data is crucial. Leveraging the low regulation environment is key to maximizing your short term rental income potential. Let's dive into the specifics.
Key Saint-Grégoire Airbnb Performance Metrics Overview
Monthly Airbnb Revenue Variations & Income Potential in Saint-Grégoire (2025)
Understanding the monthly revenue variations for Airbnb listings in Saint-Grégoire is key to maximizing your short term rental income potential. Seasonality significantly impacts earnings. Our analysis, based on data from the past 12 months, shows that the peak revenue month for STRs in Saint-Grégoire is typically September, while January often presents the lowest earnings, highlighting opportunities for strategic pricing adjustments during shoulder and low seasons. Explore the typical Airbnb income in Saint-Grégoire across different performance tiers:
- Best-in-class properties (Top 10%) achieve $2,039+ monthly, often utilizing dynamic pricing and superior guest experiences.
- Strong performing properties (Top 25%) earn $1,401 or more, indicating effective management and desirable locations/amenities.
- Typical properties (Median) generate around $904 per month, representing the average market performance.
- Entry-level properties (Bottom 25%) see earnings around $505, often with potential for optimization.
Average Monthly Airbnb Earnings Trend in Saint-Grégoire
Saint-Grégoire Airbnb Occupancy Rate Trends (2025)
Maximize your bookings by understanding the Saint-Grégoire STR occupancy trends. Seasonal demand shifts significantly influence how often properties are booked. Typically, Septembersees the highest demand (peak season occupancy), while January experiences the lowest (low season). Effective strategies, like adjusting minimum stays or offering promotions, can boost occupancy during slower periods. Here's how different property tiers perform in Saint-Grégoire:
- Best-in-class properties (Top 10%) achieve 77%+ occupancy, indicating high desirability and potentially optimized availability.
- Strong performing properties (Top 25%) maintain 62% or higher occupancy, suggesting good market fit and guest satisfaction.
- Typical properties (Median) have an occupancy rate around 40%.
- Entry-level properties (Bottom 25%) average 21% occupancy, potentially facing higher vacancy.
Average Monthly Occupancy Rate Trend in Saint-Grégoire
Average Daily Rate (ADR) Airbnb Trends in Saint-Grégoire (2025)
Effective short term rental pricing strategy in Saint-Grégoire involves understanding monthly ADR fluctuations. The Average Daily Rate (ADR) for Airbnb in Saint-Grégoire typically peaks in August and dips lowest during February. Leveraging Airbnb dynamic pricing tools or strategies based on this seasonality can significantly boost revenue. Here's a look at the typical nightly rates achieved:
- Best-in-class properties (Top 10%) command rates of $190+ per night, often due to premium features or locations.
- Strong performing properties (Top 25%) achieve nightly rates of $88 or more.
- Typical properties (Median) charge around $60 per night.
- Entry-level properties (Bottom 25%) earn around $42 per night.
Average Daily Rate (ADR) Trend by Month in Saint-Grégoire
Get Live Saint-Grégoire Market Intelligence 👇

Explore Real-time Analytics
Airbnb Seasonality Analysis & Trends in Saint-Grégoire (2025)
Peak Season (September, June, April)
- Revenue averages $1,381 per month
- Occupancy rates average 44.6%
- Daily rates average $86
Shoulder Season
- Revenue averages $1,105 per month
- Occupancy maintains around 44.6%
- Daily rates hold near $82
Low Season (January, March, October)
- Revenue drops to average $809 per month
- Occupancy decreases to average 38.7%
- Daily rates adjust to average $80
Seasonality Insights for Saint-Grégoire
- The Airbnb seasonality in Saint-Grégoire shows moderate seasonality with distinct peak and low periods. While the sections above show seasonal averages, it's also insightful to look at the extremes:
- During the high season, the absolute peak month showcases Saint-Grégoire's highest earning potential, with monthly revenues capable of climbing to $1,384, occupancy reaching a high of 52.3%, and ADRs peaking at $87.
- Conversely, the slowest single month of the year, typically falling within the low season, marks the market's lowest point. In this month, revenue might dip to $709, occupancy could drop to 35.0%, and ADRs may adjust down to $76.
- Understanding both the seasonal averages and these monthly peaks and troughs in revenue, occupancy, and ADR is crucial for maximizing your Airbnb profit potential in Saint-Grégoire.
Seasonal Strategies for Maximizing Profit
- Peak Season: Maximize revenue through premium pricing and potentially longer minimum stays. Ensure high availability.
- Low Season: Offer competitive pricing, special promotions (e.g., extended stay discounts), and flexible cancellation policies. Target off-season travelers like remote workers or budget-conscious guests.
- Shoulder Seasons: Implement dynamic pricing that balances peak and low rates. Target weekend travelers or specific events. Offer slightly more flexible terms than peak season.
- Regularly analyze your own performance against these Saint-Grégoire seasonality benchmarks and adjust your pricing and availability strategy accordingly.
Best Areas for Airbnb Investment in Saint-Grégoire (2025)
Exploring the top neighborhoods for short-term rentals in Saint-Grégoire? This section highlights key areas, outlining why they are attractive for hosts and guests, along with notable local attractions. Consider these locations based on your target guest profile and investment strategy.
| Neighborhood / Area | Why Host Here? (Target Guests & Appeal) | Key Attractions & Landmarks |
|---|---|---|
| Centre-ville de Saint-Grégoire | A bustling area with shops, cafes, and restaurants. Ideal for visitors who want to experience local life and have easy access to essential services. | Église de Saint-Grégoire, Parc de Couronnes, Centre commercial La Touche, Bibliothèque de Saint-Grégoire |
| Les Deux Ruisseaux | A serene residential area with parks and green spaces, perfect for families and nature lovers seeking a quiet retreat. | Parc de la Ville, Sentier de randonnée, École de musique de Saint-Grégoire |
| Bourg de Saint-Grégoire | The historic heart of the town featuring charming architecture and a community atmosphere, attracting those interested in history and culture. | Maison des Associations, Festival de la Saint-Grégoire, Événements locaux, Brocantes |
| La Moraisière | A modern neighborhood with new developments and amenities, appealing to business travelers and those looking for convenience. | Centre commercial le Monde des Enfants, Parc de la Moraisière, Établissements scolaires à proximité |
| Cesson-Sévigné | Adjacent to Saint-Grégoire, this area offers quick access to Rennes and its vibrant urban life, making it a draw for tourists wanting to explore both towns. | Parc des Deux Rivières, Centre culturel Le Grand Logis, Marché de Cesson |
| Proximité de Rennes | Being close to Rennes provides easy access to a larger city's attractions, making it attractive for guests wanting to experience both rural and urban environments. | La Vilaine, Métro de Rennes, Écomusée de la Bintinais |
| Rive droite de la Vilaine | This area along the river offers scenic views and walking paths, attracting visitors who enjoy outdoor activities and picturesque landscapes. | Promenade le long de la Vilaine, Parc des Gayeulles, Activités nautiques |
| La Châtaigneraie | A peaceful neighborhood ideally suited for longer stays, attracting families and travelers looking for a home-like environment with accessible facilities. | Écoles et crèches locales, Sentiers de promenade, Commodités familiales |
Understanding Airbnb License Requirements & STR Laws in Saint-Grégoire (2025)
While Saint-Grégoire, Brittany, France currently shows low STR regulations, specific Airbnb license requirements might still exist or change. Always verify the latest short term rental regulations and Airbnb license requirements directly with local government authorities for Saint-Grégoire to ensure full compliance before hosting.
(Source: AirROI data, 2025, finding no licensed listings among those analyzed)
Top Performing Airbnb Properties in Saint-Grégoire (2025)
Benchmark your potential! Explore examples of top-performing Airbnb properties in Saint-Grégoirebased on Trailing Twelve Month (TTM) revenue. Analyze their characteristics, revenue, occupancy rate, and ADR to understand what drives success in this market.

Contemporary house 4 bedrooms sleeps 8
Entire Place • 4 bedrooms
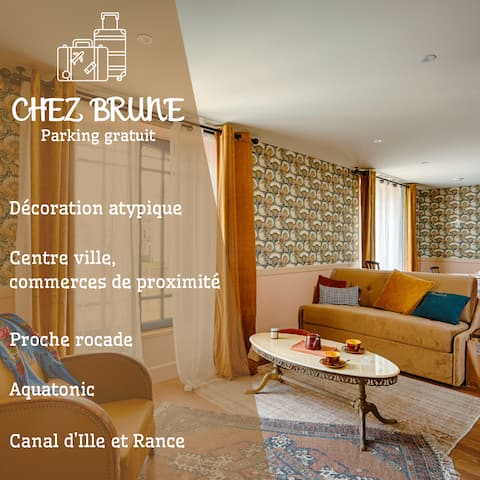
Chez Brune: house,center, parking
Entire Place • 2 bedrooms
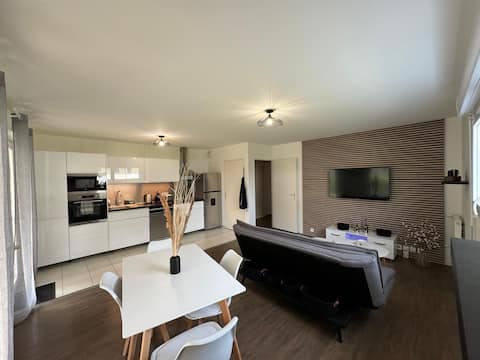
Apartment 4 to 6 beds
Entire Place • 2 bedrooms
Beautiful apartment with gated garage in the city center
Entire Place • 2 bedrooms
Hays and Galia's Apartment
Entire Place • 1 bedroom

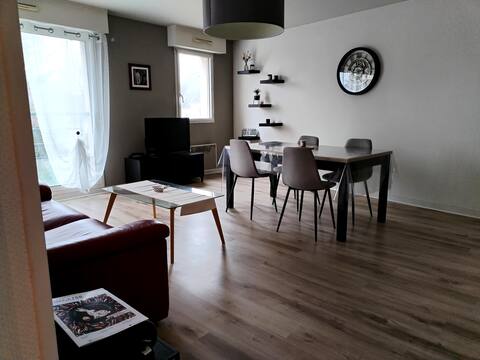
Apartment T3 60 m² in residence 5 minutes from Rennes
Entire Place • 2 bedrooms
Note: Performance varies based on location, size, amenities, seasonality, and management quality. Data reflects the past 12 months.
Top Performing Airbnb Hosts in Saint-Grégoire (2025)
Learn from the best! This table showcases top-performing Airbnb hosts in Saint-Grégoire based on the number of properties managed and estimated total revenue over the past year. Analyze their scale and performance metrics.
| Host Name | Properties | Grossing Revenue | Stay Reviews | Avg Rating |
|---|---|---|---|---|
| Xavier | 1 | $33,936 | 7 | 5.00/5.0 |
| Marie | 1 | $21,565 | 59 | 4.95/5.0 |
| Guillaume | 1 | $19,748 | 15 | 5.00/5.0 |
| Eric | 1 | $16,723 | 45 | 4.91/5.0 |
| Haysam | 1 | $16,510 | 79 | 4.89/5.0 |
| Maelys | 1 | $16,345 | 130 | 4.89/5.0 |
| Gaëdig | 1 | $15,666 | 37 | 4.97/5.0 |
| Hélène Et Quentin | 2 | $15,566 | 162 | 4.92/5.0 |
| Isabelle | 1 | $14,866 | 24 | 4.96/5.0 |
| Karine Claudine Chantal | 1 | $14,735 | 47 | 4.87/5.0 |
Analyzing the strategies of top hosts, such as their property selection, pricing, and guest communication, can offer valuable lessons for optimizing your own Airbnb operations in Saint-Grégoire.
Dive Deeper: Advanced Saint-Grégoire STR Market Data (2025)
Ready to unlock more insights? AirROI provides access to advanced metrics and comprehensive Airbnb data for Saint-Grégoire. Explore detailed analytics beyond this report to refine your investment strategy, optimize pricing, and maximize your vacation rental profits.
Explore Advanced MetricsSaint-Grégoire Short-Term Rental Market Composition (2025): Property & Room Types
Room Type Distribution
Property Type Distribution
Market Composition Insights for Saint-Grégoire
- The Saint-Grégoire Airbnb market composition is heavily skewed towards Entire Home/Apt listings, which make up 73.3% of the 30 active rentals. This indicates strong guest preference for privacy and space.
- Looking at the property type distribution in Saint-Grégoire, Apartment/Condo properties are the most common (46.7%), reflecting the local real estate landscape.
- Houses represent a significant 43.3% portion, catering likely to families or larger groups.
- The presence of 10% Hotel/Boutique listings indicates integration with traditional hospitality.
Saint-Grégoire Airbnb Room Capacity Analysis (2025): Bedroom Distribution
Distribution of Listings by Number of Bedrooms
Room Capacity Insights for Saint-Grégoire
- The dominant room capacity in Saint-Grégoire is 1 bedroom listings, making up 46.7% of the market. This suggests a strong demand for properties suitable for couples or solo travelers.
- Together, 1 bedroom and 2 bedrooms properties represent 60.0% of the active Airbnb listings in Saint-Grégoire, indicating a high concentration in these sizes.
Saint-Grégoire Vacation Rental Guest Capacity Trends (2025)
Distribution of Listings by Guest Capacity
Guest Capacity Insights for Saint-Grégoire
- The most common guest capacity trend in Saint-Grégoire vacation rentals is listings accommodating 2 guests (40%). This suggests the primary traveler segment is likely couples or solo travelers.
- Properties designed for 2 guests and 4 guests dominate the Saint-Grégoire STR market, accounting for 53.3% of listings.
- A significant 43.3% of listings cater specifically to 1-2 guests, highlighting strong demand from couples and solo travelers in Saint-Grégoire.
- 20.0% of properties accommodate 6+ guests, serving the market segment for larger families or group travel in Saint-Grégoire.
- On average, properties in Saint-Grégoire are equipped to host 3.0 guests.
Saint-Grégoire Airbnb Booking Patterns (2025): Available vs. Booked Days
Available Days Distribution
Booked Days Distribution
Booking Pattern Insights for Saint-Grégoire
- The most common availability pattern in Saint-Grégoire falls within the 271-366 days range, representing 40% of listings. This suggests many properties have significant open periods on their calendars.
- Approximately 76.7% of listings show high availability (181+ days open annually), indicating potential for increased bookings or specific owner usage patterns.
- For booked days, the 91-180 days range is most frequent in Saint-Grégoire (36.7%), reflecting common guest stay durations or potential owner blocking patterns.
- A notable 23.3% of properties secure long booking periods (181+ days booked per year), highlighting successful long-term rental strategies or significant owner usage.
Saint-Grégoire Airbnb Minimum Stay Requirements Analysis
Distribution of Listings by Minimum Night Requirement
1 Night
7 listings
25% of total
2 Nights
11 listings
39.3% of total
3 Nights
4 listings
14.3% of total
4-6 Nights
4 listings
14.3% of total
7-29 Nights
1 listings
3.6% of total
30+ Nights
1 listings
3.6% of total
Key Insights
- The most prevalent minimum stay requirement in Saint-Grégoire is 2 Nights, adopted by 39.3% of listings. This highlights the market's preference for shorter, flexible bookings.
- A strong majority (64.3%) of the Saint-Grégoire Airbnb data shows acceptance of very short stays (1-2 nights), indicating a dynamic, high-turnover market.
Recommendations
- Align with the market by considering a 2 Nights minimum stay, as 39.3% of Saint-Grégoire hosts use this setting.
- If feasible, allowing 1-night stays, especially midweek or during low season, could capture last-minute bookings, as only 25% currently do.
- Adjust minimum nights based on seasonality – potentially shorter during low season and longer during peak demand periods in Saint-Grégoire.
Saint-Grégoire Airbnb Cancellation Policy Trends Analysis (2025)
Flexible
8 listings
27.6% of total
Moderate
6 listings
20.7% of total
Firm
7 listings
24.1% of total
Strict
8 listings
27.6% of total
Cancellation Policy Insights for Saint-Grégoire
- The prevailing Airbnb cancellation policy trend in Saint-Grégoire is Flexible, used by 27.6% of listings.
- A majority (51.7%) of hosts in Saint-Grégoire utilize Firm or Strict policies, indicating a market where hosts prioritize booking security.
Recommendations for Hosts
- Consider adopting a Flexible policy to align with the 27.6% market standard in Saint-Grégoire.
- Regularly review your cancellation policy against competitors and market demand shifts in Saint-Grégoire.
Saint-Grégoire STR Booking Lead Time Analysis (2025)
Average Booking Lead Time by Month
Booking Lead Time Insights for Saint-Grégoire
- The overall average booking lead time for vacation rentals in Saint-Grégoire is 36 days.
- Guests book furthest in advance for stays during May (average 66 days), likely coinciding with peak travel demand or local events.
- The shortest booking windows occur for stays in November (average 12 days), indicating more last-minute travel plans during this time.
- Seasonally, Spring (52 days avg.) sees the longest lead times, while Fall (21 days avg.) has the shortest, reflecting typical travel planning cycles.
Recommendations for Hosts
- Use the overall average lead time (36 days) as a baseline for your pricing and availability strategy in Saint-Grégoire.
- For May stays, consider implementing length-of-stay discounts or slightly higher rates for bookings made less than 66 days out to capitalize on advance planning.
- During November, focus on last-minute booking availability and promotions, as guests book with very short notice (12 days avg.).
- Target marketing efforts for the Spring season well in advance (at least 52 days) to capture early planners.
- Monitor your own booking lead times against these Saint-Grégoire averages to identify opportunities for dynamic pricing adjustments.
Popular & Essential Airbnb Amenities in Saint-Grégoire (2025)
Amenity Prevalence
Amenity Insights for Saint-Grégoire
- Essential amenities in Saint-Grégoire that guests expect include: Hot water, Heating, Dishes and silverware. Lacking these (any) could significantly impact bookings.
- Popular amenities like Free parking on premises, Wifi, Smoke alarm are common but not universal. Offering these can provide a competitive edge.
- Warning: Wifi is not universally provided but is considered essential globally. Ensure reliable Wifi is offered.
Recommendations for Hosts
- Ensure your listing includes all essential amenities for Saint-Grégoire: Hot water, Heating, Dishes and silverware.
- Prioritize adding missing essentials: Heating, Dishes and silverware.
- Consider adding popular differentiators like Free parking on premises or Wifi to increase appeal.
- Highlight unique or less common amenities you offer (e.g., hot tub, dedicated workspace, EV charger) in your listing description and photos.
- Regularly check competitor amenities in Saint-Grégoire to stay competitive.
Saint-Grégoire Airbnb Guest Demographics & Profile Analysis (2025)
Guest Profile Summary for Saint-Grégoire
- The typical guest profile for Airbnb in Saint-Grégoire consists of primarily domestic travelers (91%), often arriving from nearby Paris, typically belonging to the Post-2000s (Gen Z/Alpha) group (50%), primarily speaking French or English.
- Domestic travelers account for 91.2% of guests.
- Key international markets include France (91.2%) and United Kingdom (1.8%).
- Top languages spoken are French (48.3%) followed by English (33.4%).
- A significant demographic segment is the Post-2000s (Gen Z/Alpha) group, representing 50% of guests.
Recommendations for Hosts
- Target domestic marketing efforts towards travelers from Paris and Nantes.
- Tailor amenities and listing descriptions to appeal to the dominant Post-2000s (Gen Z/Alpha) demographic (e.g., highlight fast WiFi, smart home features, local guides).
- Highlight unique local experiences or amenities relevant to the primary guest profile.
- Consider seasonal promotions aligned with peak travel times for key origin markets.
Nearby Short-Term Rental Market Comparison
How does the Saint-Grégoire Airbnb market stack up against its neighbors? Compare key performance metrics like average monthly revenue, ADR, and occupancy rates in surrounding areas to understand the broader regional STR landscape.
| Market | Active Properties | Monthly Revenue | Daily Rate | Avg. Occupancy |
|---|---|---|---|---|
| St Martin | 14 | $4,074 | $436.70 | 51% |
| Moulins-le-Carbonnel | 11 | $3,213 | $320.85 | 35% |
| Gonneville-en-Auge | 12 | $3,061 | $235.90 | 40% |
| Vallon-sur-Gée | 11 | $2,913 | $379.01 | 30% |
| Saint Lawrence | 11 | $2,911 | $317.86 | 52% |
| Auberville | 22 | $2,777 | $249.63 | 36% |
| St Ouen | 15 | $2,635 | $339.51 | 51% |
| Chambellay | 11 | $2,525 | $255.24 | 34% |
| St Clement | 14 | $2,522 | $219.76 | 51% |
| Grouville | 21 | $2,510 | $218.40 | 52% |